Stocks Today – Everything You Need to Know

Stocks Today – Everything You Need to Know

In this article I’m going to talk about stocks today – what’s been happening on the NASDAQ, the S&P 500, and Gold, for good measure! I’m going to examine the recent price movements with a view to helping you decide where they might be headed in the short to medium term. Let’s get started!

Stocks today – the NASDAQ

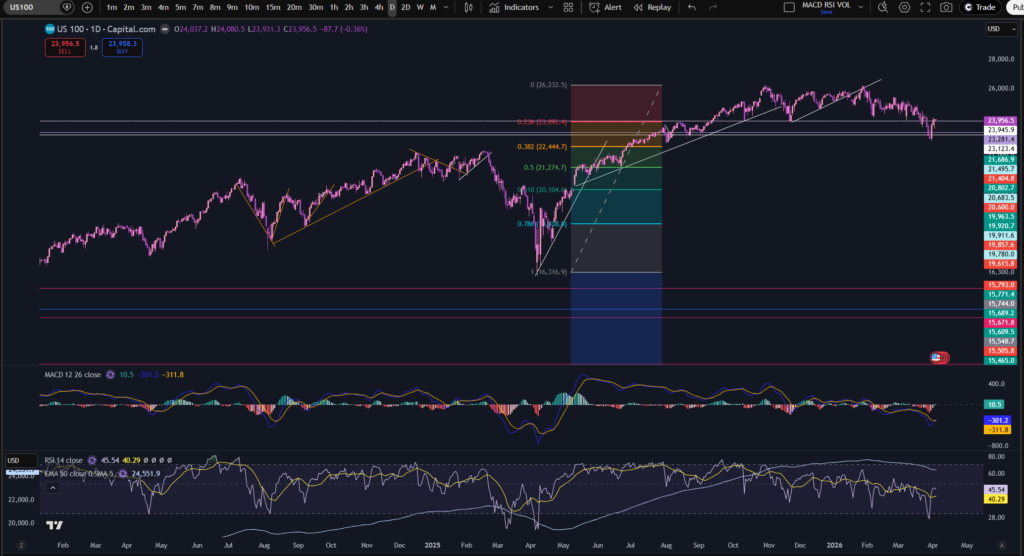
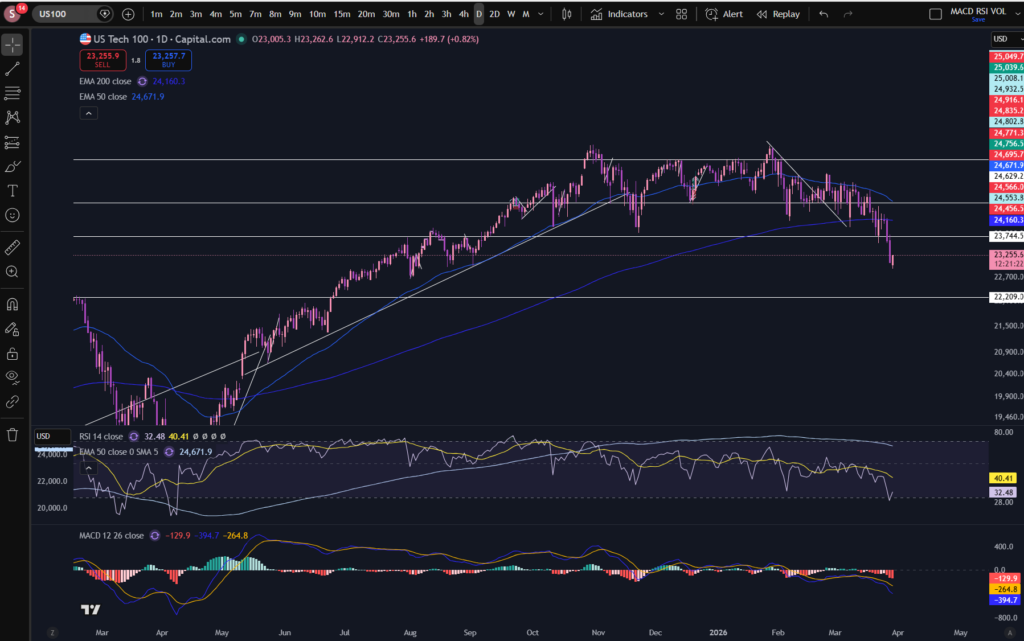
A great tool in understanding stocks today is looking at the NASDAQ index chart. This has seen some recovery in price more recently. Let’s take a look at the daily time frame chart, using Trading View, my favourite chart software platform:

stocks today

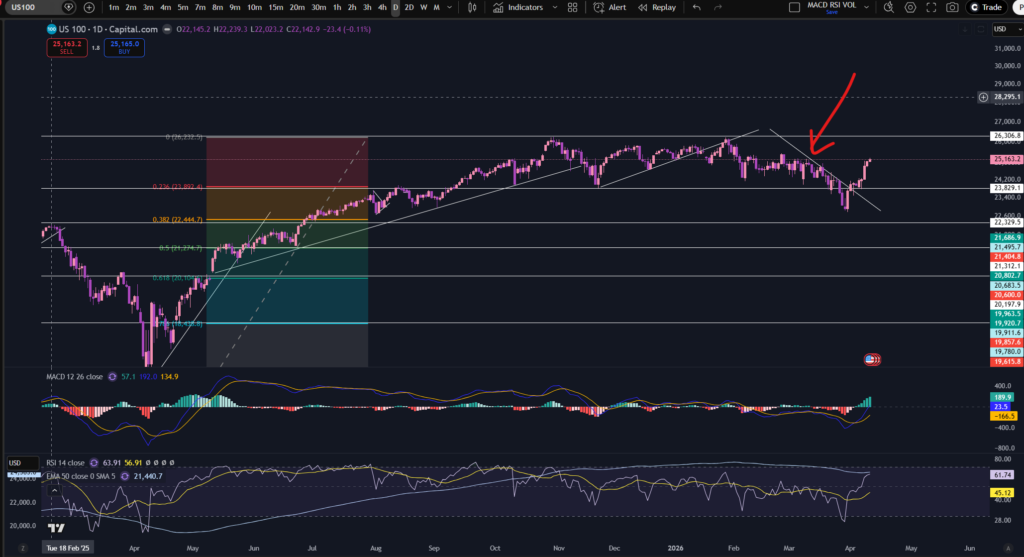
Ok so as you can see the price has pushed up significantly from the most recent low it made in around the end of March 2026. It’s broken through the recent diagonal downward trend with a significant push upwards. It’s worth noting that the MACD and Signal lines have crossed on the MACD indicator and the histogram bars are becoming taller and still remain dark green, meaning as of Friday, the market was still pushing up strongly. The RSI indicator is pushing towards the top of its channel. When the RSI indicator generally gets to a level of 70 or above, traders tend to be more aware that the price could be due a pull back. The current level on the RSI indicator is 63.74.

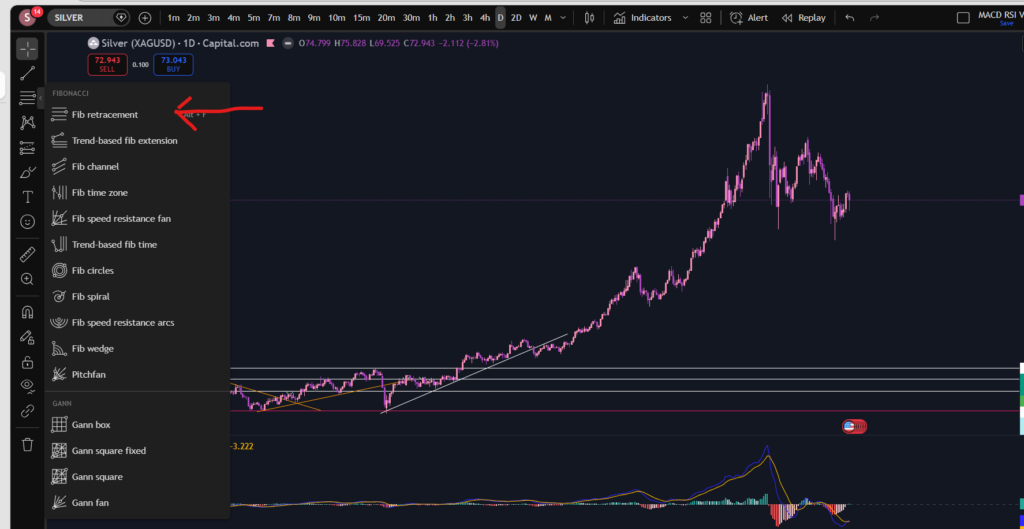
It’s also worth noting that the price has ‘bounced’ at around one of the significant Fibonacci levels. You can learn about using the Fibonacci tool, here, in an article I published recently:

How to buy stocks, using Fibonacci Retracement as a Day Trader – Everything you Need to Know – Sophia Trades – Learn how to Trade the Stock Market

It remains to be seen whether the price will continue pushing up or not. I hope this analysis has provided you with some educational resource for you to start making your own decisions about what you think will happen in the short to medium term.

Let’s take a look at the S&P 500 next to see if it’s following suit…
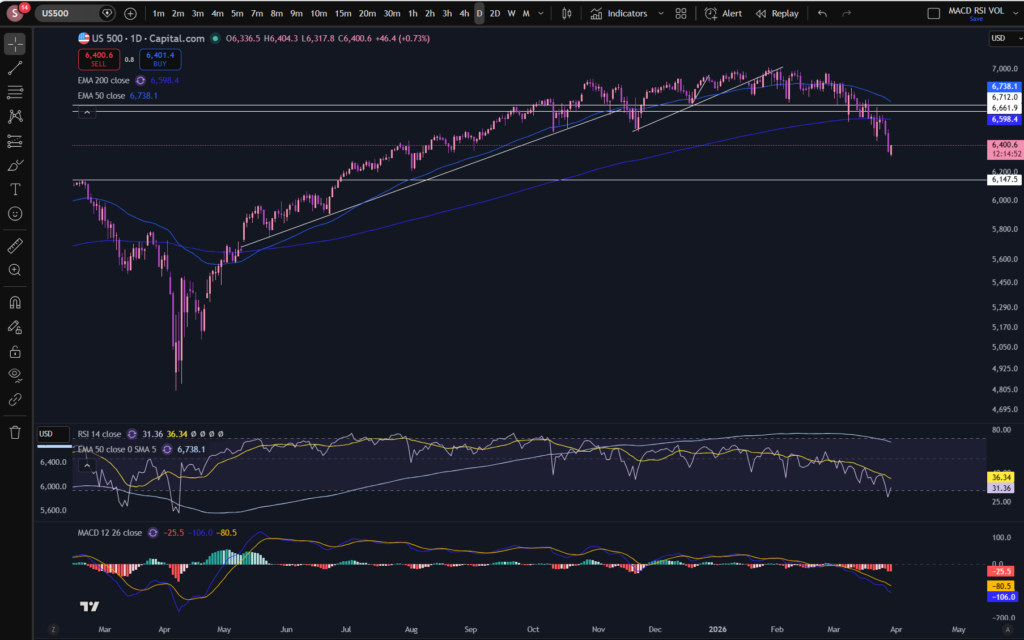
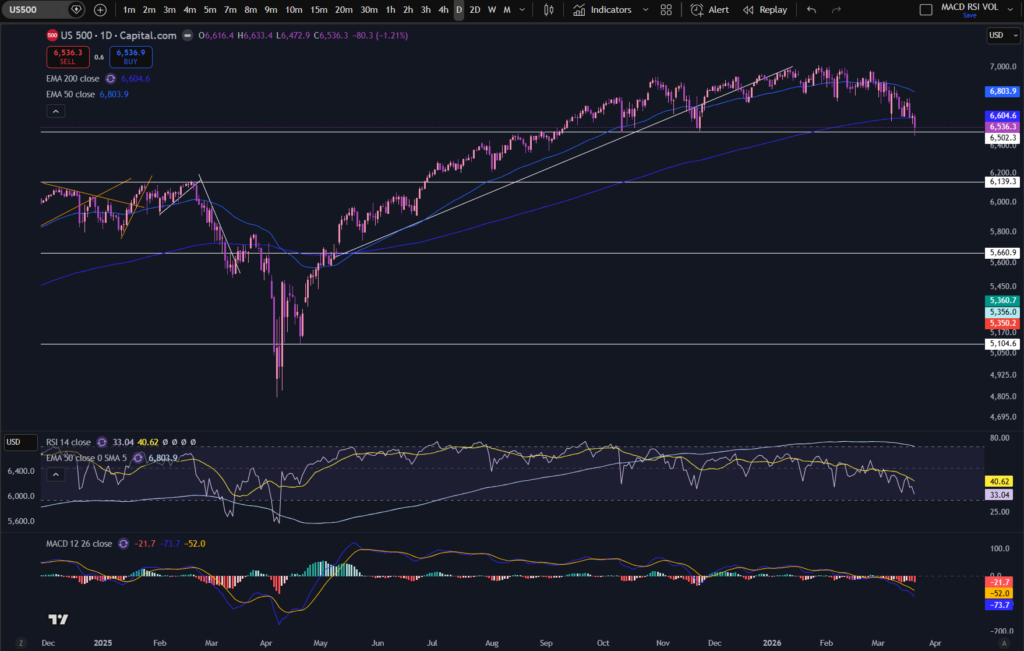
S&P 500

stocks today

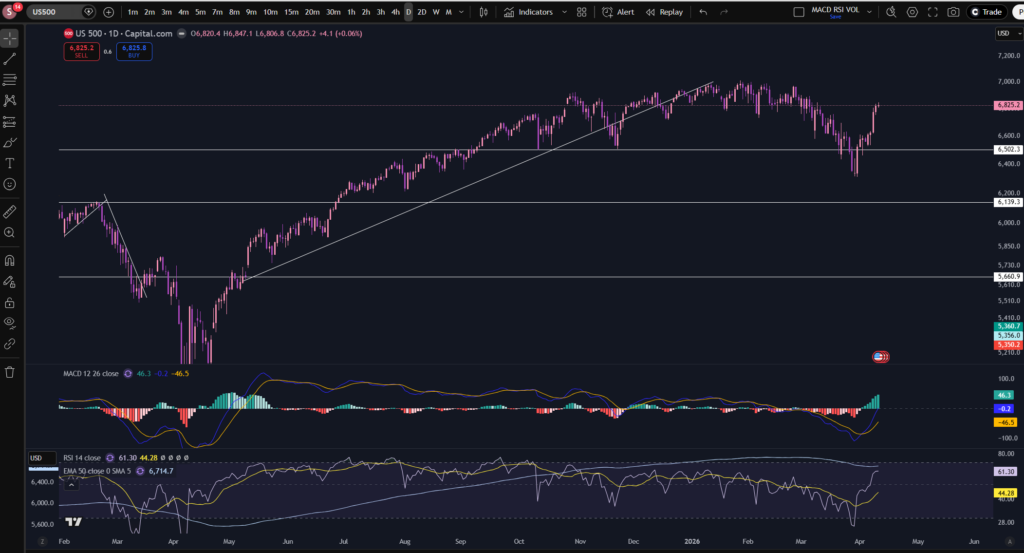
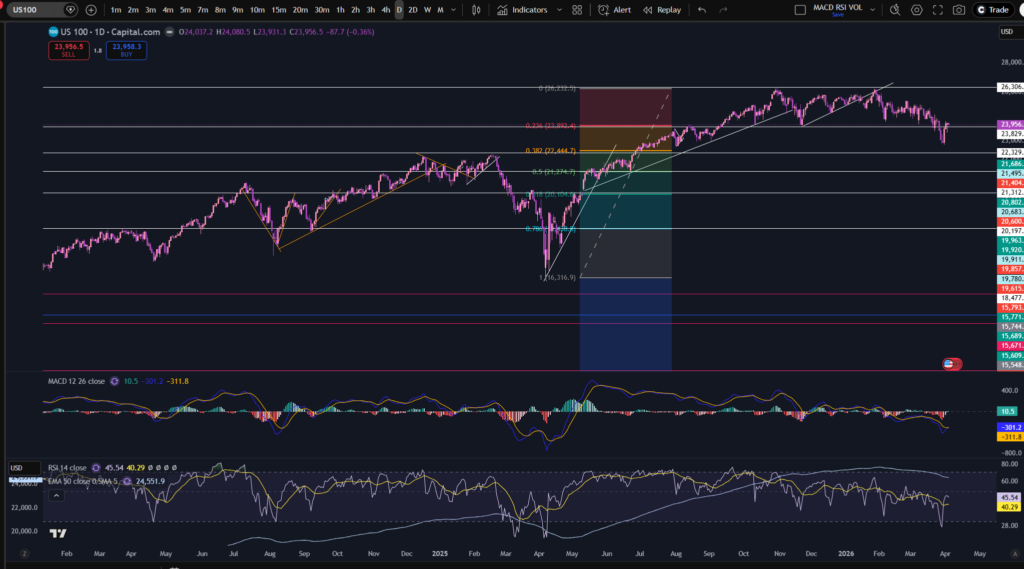
When considering stocks today, the S&P is also fundamental. This index gives you an overall indication as to the health of the markets. As you can see, the same sort of pattern is forming on the S&P 500. This is no surprise given that it is heavily influenced by the NASDAQ. They look very similar indeed.

Let’s take a look at what’s happening to Gold – this can be a critical market for examining overall market sentiment etc in the stocks – the Gold market tends to soar when people lose confidence in the stock market…

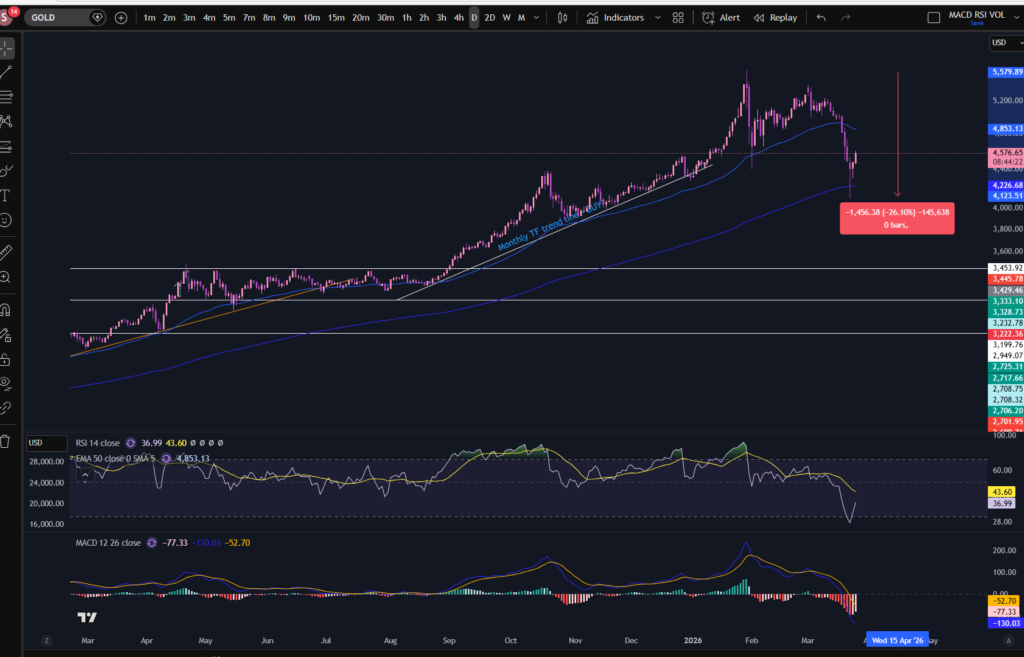
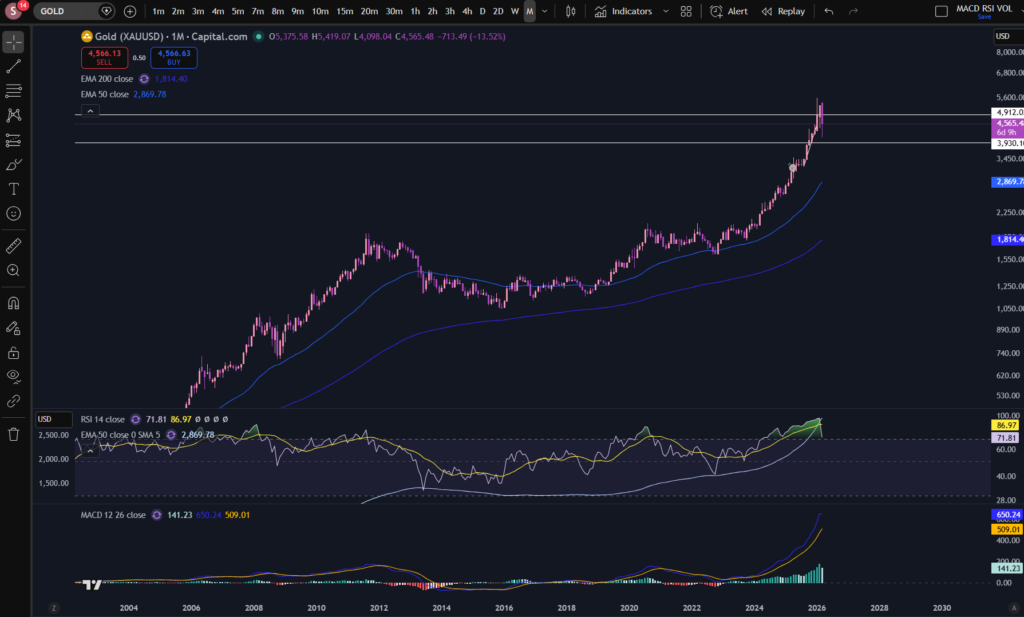
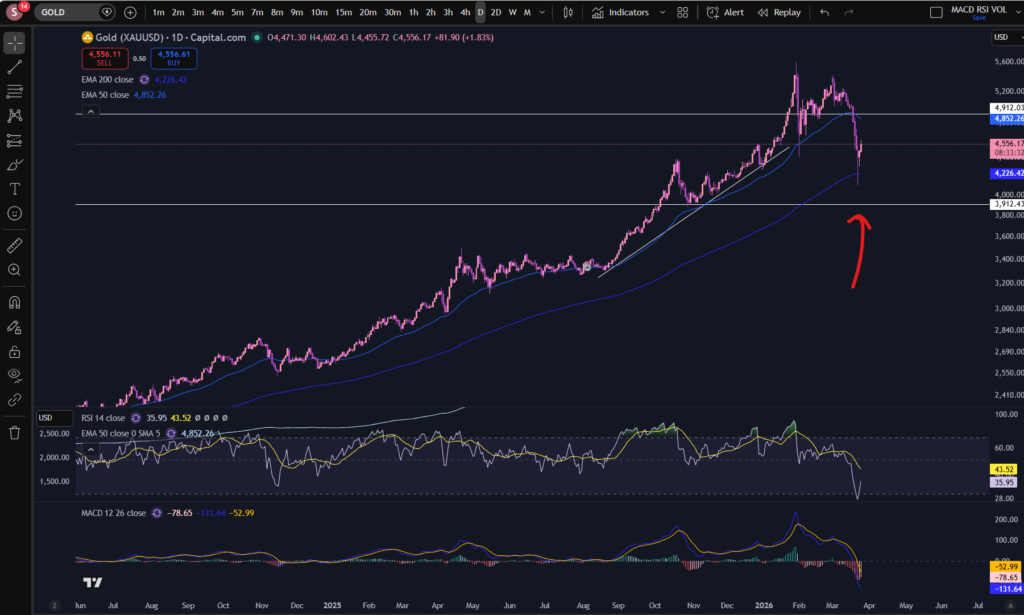
What’s happening to Gold?

stocks today

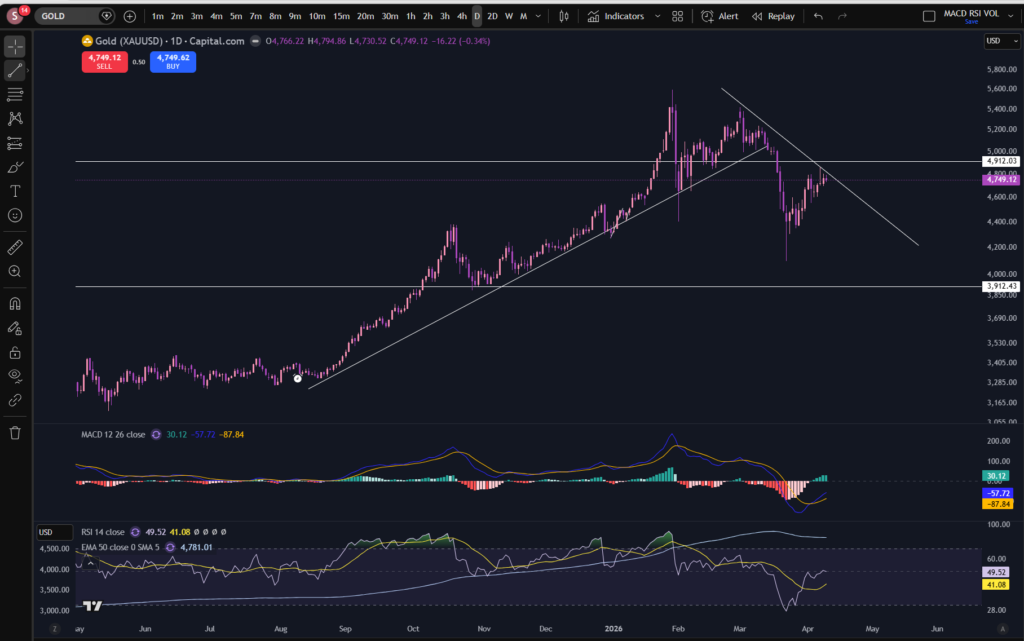
As you can see, the Gold market reached all time highs at around the start of 2026 and since then, it’s been pulling back strongly. At the moment it is at the point of potential resistance, as can be seen with the diagonal downward trend line. If recovered confidence in the stock market continues to push the stock prices up, it is possible this will negatively impact the price of Gold.

This is all, of course, being influenced by Trump, the war with Iran and all of the turbulence in the real world too… so it is possible we could see more fluctuations.

The idea of this blog is to share my own thoughts and analysis on what’s happened to date, with a view to helping you decide for yourselves what might happen next.

I hope you found this article helpful.

Disclaimer!

Nothing on this blog should be taken as financial advice or encouragement for you to enter a trade.  You are expected to speak to a financial adviser or carry out your own due diligence before entering any positions.  Everything on this blog is made for educational purposes and to equip you with the knowledge you need to be able to make your own financial decisions.

For more great tips and advice on trading the stock market, please visit:

https://www.sophiatrades.co.uk

To watch me trade live please visit my patreon page here:

https://www.patreon.com/sophiatrades

Finally, if you would like to receive a discount on the Trading View charting software I use, please click on the relevant link here:

https://www.tradingview.com/?aff_id=117138

Please note any subscriptions taken via my affiliate link with Trading View may result in me earning a small commission.  However, I provide complete transparency on me using Trading View personally – I publish my success on the financial markets via my broker reports and any profits earned were done so by using my own Trading View subscription,  so I genuinely do recommend them and have been using the Trading View charts for many years.

How to buy stocks, using Fibonacci Retracement as a Day Trader – Everything you Need to Know

In this article i’m going to talk about how to buy stocks using a Fibonacci Retracement as a day trader. Fibonacci is a magical mathematical proportion which exists in everything in the universe. It’s no surprise that it exists as significant levels for buying and selling demand in the stock market. Price movements are driven, after all, by human beings – biological organisms. Let’s take a look at how you can use this as a day trader to make more money trading.

What is Fibonacci?

Before we can understand how to buy stocks using Fibonacci Retracement, we first need to understand what it is. Fibonacci is an almost ‘magical’ pattern which exists in the universe. It represents a sequence where every number in the sequence is the sum of the two preceding numbers. It was discovered by the mathematician, Leonardo of Pisa. These ratios and patterns can be found in the human body, leaves, flowers, other animals – the list is endless. Mother nature uses it to build organisms on the Earth and it also exists in ancient archaeological structures too! The sequence is identified by the formula Fn = Fn-1 + Fn-2, starting with F0=0 and F1 = 1.

As the sequence progresses, the results tend to a special value – 1.618. This is known as the Golden Ratio.

How to buy stocks using the Fibonacci Retracement as a Day Trader then?

The special Fibonacci proportions can indicate areas of buying and selling pressure on a stock chart. It can help traders to identify areas for entry points and pull backs. You can use the Fibonacci tool in Trading View, by accessing it on the menu in the left, as shown below:

How to buy stocks

Once selected you can click the chart and drag the indicator down over the price movements, to show the various levels of the Fibonacci Retracement tool- you line the tool up with the lowest or the highest point, and then pull/extend it over the price movements, to the highest if you started at the lowest, or vice versa.

How to buy stocks

Let’s take a look at where this indicator ended up being accurate, in terms of support and resistance levels:

As you can see, i’ve added support and resistance lines everywhere where you can see significant levels of buying or selling pressure. I also stretched the Fibonacci indicator vertically, to line it up with the pull back/resistance and support areas.

As an example, the next level up is half the height of the previous one, as shown below:

Amazingly, these line up perfectly with the Fibonacci retracement levels?! How is this possible? It’s amazing but it’s real, and you can probably now imagine how you will be able to use this in your trading… let’s take a look at this next…

Where to buy or sell with Fibonacci Retracement

So as you can see the Fibonacci Retracement tool can be very useful in understanding how to buy stocks. The idea is to buy at the level where the market pulls back to. You can see these types of levels at, for example, 21.686, 21.495, 22.329…You can see the price pulled back to these levels and then went on higher. You could add a stop loss underneath the level, and then set a take profit at the next level up! Or continue to ride the trend, by moving your stop loss up to the next successive levels, as the price moves.

I hope you found this article helpful.

Disclaimer!

Nothing on this blog should be taken as financial advice or encouragement for you to enter a trade.  You are expected to speak to a financial adviser or carry out your own due diligence before entering any positions.  Everything on this blog is made for educational purposes and to equip you with the knowledge you need to be able to make your own financial decisions.

For more great tips and advice on trading the stock market, please visit:

https://www.sophiatrades.co.uk

To watch me trade live please visit my patreon page here:

https://www.patreon.com/sophiatrades

Finally, if you would like to receive a discount on the Trading View charting software I use, please click on the relevant link here:

https://www.tradingview.com/?aff_id=117138

Please note any subscriptions taken via my affiliate link with Trading View may result in me earning a small commission.  However, I provide complete transparency on me using Trading View personally – I publish my success on the financial markets via my broker reports and any profits earned were done so by using my own Trading View subscription,  so I genuinely do recommend them and have been using the Trading View charts for many years.

How to Trade Commodities – Cocoa – Everything you Need to Know

In this article i’m going to consider how to trade commodities, and in particular, Cocoa. I’m going to look at the chart for Cocoa using my favourite chart platform, Trading View. I’m going to perform some technical analysis on the recent and longer term price movements and patterns. Let’s get straight into it…

Cocoa birds eye view

How to trade commodities

A great place to start in understanding how to trade commodities, is to first, get a birds eye view of a market. In order to get a great bird’s eye view of this market, it’s helpful to consider what is happening on the monthly timeframe. The monthly timeframe contains Japanese candlesticks where each candlestick represents a single month’s worth of price movements – so you can see from the above chart, the long term view of what is happening on the market.

As you can see, the price reached an enormous, all time high, ‘peak’, at around the end of 2025, and since then it has fallen sharply. The price has since respected a diagonal downwards trend line. At the moment it has made a sharp steep peak away from the trend line in the downwards direction, and it has started pulling back again, with a significant pink candle – closing higher, within the last couple of days of the markets being open. As you can see, there is also a strong support level at around 6588.8 but the price has now sailed away from this, so it is useful to check any other horizontal levels which are closer to the current price:

As you can see, there is another horizontal resistance/support line identified at around 3.485. The recent price movements show that they have broken below this support. The price is currently at the horizontal level. It remains to be seen whether it will now descend further, or pull back to the horizontal trend line again.

Overall the price on Cocoa has been down trending long term. Let’s take a closer look using the daily time frame:

As you can see, the daily timeframe does not really add anything additional here, other than being able to see the support and resistance lines very clearly The MACD Indicator shows the price is currently pushing up in the nearer term. It looks as though it’s trying to push up to make a higher low, but we will need to wait and see what happens…

How to trade commodities – Cocoa – So how could you plan a trade on this market?

So in understanding the answer to the question, how to trade commodities, I hope you can see that you can use the support and resistance lines to plan where to enter and exit your trade. You want to trade close to the ‘structure’ of the pattern and allow the price to move away from it. You would have to decide which support or resistance line to use, and when but I hope you can see the potential for predicting price movements, from this article.

I hope you found this article helpful.

Disclaimer!

Nothing on this blog should be taken as financial advice or encouragement for you to enter a trade.  You are expected to speak to a financial adviser or carry out your own due diligence before entering any positions.  Everything on this blog is made for educational purposes and to equip you with the knowledge you need to be able to make your own financial decisions.

For more great tips and advice on trading the stock market, please visit:

https://www.sophiatrades.co.uk

To watch me trade live please visit my patreon page here:

https://www.patreon.com/sophiatrades

Finally, if you would like to receive a discount on the Trading View charting software I use, please click on the relevant link here:

https://www.tradingview.com/?aff_id=117138

Please note any subscriptions taken via my affiliate link with Trading View may result in me earning a small commission.  However, I provide complete transparency on me using Trading View personally – I publish my success on the financial markets via my broker reports and any profits earned were done so by using my own Trading View subscription,  so I genuinely do recommend them and have been using the Trading View charts for many years.

How to use Bollinger Bands for Day Trading

In this article i’m going to talk about how to use Bollinger Bands for day trading. I’m going to talk about how you can use this technical indicator to give you entry and exit signals, and to show you levels where the price is overbought or oversold. Let’s get straight into it!

How to use Bollinger Bands for Day Trading… but first, what are Bollinger Bands?

Bollinger Bands is a technical analysis tool which was developed by John Bollinger. They can measure market volatility and determine, relatively, whether prices are high or low. The way they work is they contain a simple 20 period moving average (“SMA”), and two outer lines (bands) which are a standard deviation away from the 20 SMA, of + or – 2. The bands expand and become wider around the 20 period SMA at times of high volatility and contract at times of low volatility. This is what the bands look like:

How to use bollinger bands for day trading

I have shown you what they look like here, using my favourite Trading View platform. If you would like a discount to this software, click the button below!

OK, so as you can see on the above chart, there is a line at the top, a line in the middle and a line below. The top and bottom lines are + and – 2 standard deviations away from the centre SMA line. You can change the settings of the bollinger bands, to use a slightly different SMA period for example, by clicking on the settings, in Trading View, here:

How to use bollinger bands for day trading

It’s sometimes best to use the default settings – set to 20 period SMA with 2 standard deviations. I have changed the colours on my Trading View charts, because I like using dark mode and the bands show up here, a bit more by changing them to white, light green and light orange.

How can you use Bollinger Bands for entry signals?

So lets talk about how to use Bollinger Bands for Day Trading…With Bollinger Bands you can buy the market when the price goes to or dips down below the lower band, and enter a take profit when it reaches the top band.

Similarly, you could sell when the price is at the top band, and then buy back on a short, when the price reaches the bottom band.

You can also use the bands to follow trends by entering and then waiting for the price to ride up the bands.

How to avoid false signals with Bollinger Bands?

You can avoid false entry signals by confirming the entry with another indicator such as the RSI. To learn about the RSI indicator please see the link below:

RSI Indicator – Sophia Trades – Learn how to Trade the Stock Market

I hope you found this article helpful.

Disclaimer!

Nothing on this blog should be taken as financial advice or encouragement for you to enter a trade.  You are expected to speak to a financial adviser or carry out your own due diligence before entering any positions.  Everything on this blog is made for educational purposes and to equip you with the knowledge you need to be able to make your own financial decisions.

For more great tips and advice on trading the stock market, please visit:

https://www.sophiatrades.co.uk

To watch me trade live please visit my patreon page here:

https://www.patreon.com/sophiatrades

Finally, if you would like to receive a discount on the Trading View charting software I use, please click on the relevant link here:

https://www.tradingview.com/?aff_id=117138

Please note any subscriptions taken via my affiliate link with Trading View may result in me earning a small commission.  However, I provide complete transparency on me using Trading View personally – I publish my success on the financial markets via my broker reports and any profits earned were done so by using my own Trading View subscription,  so I genuinely do recommend them and have been using the Trading View charts for many years.

Stocks today – everything you need to know!

In this article i’m going to take a look at what’s happening with the stocks today. I’m going to consider the major indices and give my thoughts on their recent activity. I will also try to identify whether the markets have started recovering. Let’s take a look!

Stocks today – the NASDAQ

A great way of establishing quite quickly, what’s happening with stocks today, is by considering the major indices. This will give a quick overview/average idea of the direction they are headed in. Let’s take a look at what’s happening on the NASDAQ, monthly timeframe. The monthly timeframe gives a great birds eye view of the position of the markets. It’s great for long term planning:

stocks today

As you can see on this monthly timeframe chart, the position recently, from a long term perspective is still very much that the market is pulling back. The latest monthly timeframe candle is a big downwards one, (meaning the price closed lower than where it opened at the start of the month). To understand more about how to read Japanese candlestick patterns, please see the relevant section of this blog, here:

Japanese Candlesticks – Sophia Trades – Learn how to Trade the Stock Market

You can also see on the above chart that the MACD has crossed over the signal line and the MACD histogram has made its first red bar. It’s not clear whether this new downwards move will continue. You can see at the previous occasion this happened, it only lasted for two red histogram bars, and then recovered.

It’s also worth noting the position of the RSI indicator. The RSI has pulled back to the ‘pull back’ level it usually reaches, while it’s still uptrending. Note the position of where it pulled back to, previously, marked with the red line, here:

The RSI is at a critical point. If the RSI dips below this sort of level and stays there, it can indicate the markets are downtreding long term, rather than them just pulling back.

Let’s zoom in, next, and take a look at the daily timeframe:

Stocks today – the NASDAQ daily timeframe chart

As you can see, the picture is quite gloomy for buyers on the daily timeframe. The price has broken below the firm support level at around 23.744. Once a price breaks through a major support or resistance level it can then act as the opposite so in this case it could end up being a level of resistance. However, the RSI indicator has pulled back significantly and the MACD indicator has dropped significantly to the downside. It is still making large red histogram bars so currently it appears as though the downward move has still got a lot of momentum.

S&P 500

I like to consider the S&P 500 chart for a wider, overall view, of what is happening with the markets, although it can often follow the same sort of shape or pattern, as the NASDAQ, so i’m not anticipating good news for buyers with this either. Let’s take a look:

As you can see on the daily timeframe for the S&P 500, it’s showing a similar sort of story as the NASDAQ.

Conclusion – stocks today

The markets are not yet recovering so I, personally, will be avoiding entering any more ‘buy’ positions, for the time being.

I hope you found this article helpful.

Disclaimer!

Nothing on this blog should be taken as financial advice or encouragement for you to enter a trade.  You are expected to speak to a financial adviser or carry out your own due diligence before entering any positions.  Everything on this blog is made for educational purposes and to equip you with the knowledge you need to be able to make your own financial decisions.

For more great tips and advice on trading the stock market, please visit:

https://www.sophiatrades.co.uk

To watch me trade live please visit my patreon page here:

https://www.patreon.com/sophiatrades

Finally, if you would like to receive a discount on the Trading View charting software I use, please click on the relevant link here:

https://www.tradingview.com/?aff_id=117138

Please note any subscriptions taken via my affiliate link with Trading View may result in me earning a small commission.  However, I provide complete transparency on me using Trading View personally – I publish my success on the financial markets via my broker reports and any profits earned were done so by using my own Trading View subscription,  so I genuinely do recommend them and have been using the Trading View charts for many years.

Stocks today – Everything You Need to Know

Stocks today – Everything You Need to Know

In this article I want to talk to you about what’s happening to the price of Gold, currently. Whilst this is not a stock, I have prepared by usual style ‘stocks today’ blog article on it, because it is worth paying attention to, as Gold gives an indication of the overall position and health of the markets. As you will know from my recent blog posts, many of the markets are pulling back right now or simply moving sideways, following having reached record highs!. Gold is no exception to this. Let’s take a look at the chart movements to see what’s going on and whether we can identify any recent patterns…

Stocks today – the Gold Daily Time Frame chart

stocks today

As you can see the Gold market reached all time highs at around 29th January 2026. The price has descended quite steeply since then – by 26%, as you can see on the chart. This is quite a drop and highly significant for our consideration of stocks today! It could represent a big bargain for someone if the prices went back up to previous levels.

Let’s take a look at the monthly timeframe, too, to get a better birds eye view:

Gold monthly timeframe chart:

stocks today

As you can see on the monthly timeframe chart, the price had literally gone to the moon recently. The dip down which we can see in detail on the daily timeframe, seems small compared to the amount it has risen in the recent past. The price is nearing a bit of a support level per the daily timeframe, marked below:

There are a number of scenarios which could play out and it is very difficult to determine which one is likely to happen. If Gold continues to drop, it could find some support, even temporarily, at some of these horizontal support levels. However, it has dropped already by 26% which is not insignificant. If it dropped even further this would amount to an enormous discount on the recent highs, prices.

Ultimately, it will be difficult to try and predict which way this market will go, but I will be keeping a close eye on the chart. Before getting into any gold positions, I would want to see the market making higher highs and higher lows once again. This may be a while off yet. We will see!

I hope you found this article helpful, on ‘stocks today’.

Disclaimer!

Nothing on this blog should be taken as financial advice or encouragement for you to enter a trade.  You are expected to speak to a financial adviser or carry out your own due diligence before entering any positions.  Everything on this blog is made for educational purposes and to equip you with the knowledge you need to be able to make your own financial decisions.

For more great tips and advice on trading the stock market, please visit:

https://www.sophiatrades.co.uk

To watch me trade live please visit my patreon page here:

https://www.patreon.com/sophiatrades

Finally, if you would like to receive a discount on the Trading View charting software I use, please click on the relevant link here:

https://www.tradingview.com/?aff_id=117138

Please note any subscriptions taken via my affiliate link with Trading View may result in me earning a small commission.  However, I provide complete transparency on me using Trading View personally – I publish my success on the financial markets via my broker reports and any profits earned were done so by using my own Trading View subscription,  so I genuinely do recommend them and have been using the Trading View charts for many years.

Stocks today – Everything You Need to Know

Stocks today – Everything You Need to Know

In this article i’m going to talk about what’s happening with stocks today. I’m going to look at recent activity, the highs and lows and the current state of price movements. Let’s get straight into it!

Stocks today – Google Class C

To form a view about stocks today in respect of Google Class C (Alphabet) let’s take a look at the monthly and daily timeframes on the Trading View chart software, to get a birds eye view of what has been happening with this stock:

stocks today

As you can see on the monthly timeframe, this stock reached all time highs recently. A lot of this push upwards is to do with the AI market and expectation that this will generate a lot of revenue for the Tech sector and companies. It reached highs of $350.04 on 2nd February 2026 and has been pulling back since then. The MACD indicator is still green but slowly losing its strength. The RSI, however, has pulled down quite significantly from having been in a very overbought position. It had extended up into the 83.21 position at the highest price reached. Now the RSI is showing 69.03. It’s worth nothing that the previous time this happened back between 2021 and 2022, as you can see on the chart, the prices did descent quite significantly from the highs reached. This dip coincided, however, with increased interest rates as dictated by the FEDS. On this occasion, the FEDS have reduced rates. It remains to be seen, whether the market has finished pulling back or whether it will descent further.

Let’s look at the daily timeframe next:

stocks today

You can see a more zoomed in view of the long term picture, from the daily timeframe, above. The price is currently at a major level of support. It touched it last Friday and remains there currently. I cannot see any sign of recovery from this, yet. The price is still making lower highs and the lows are dotted along the support level. This could be seen as a descending triangle pattern but it is not clear whether the price will break down through the support level. It has touched it at least four or five times – note that the support level became one after a slight resistance previously, in around November time.

Tesla

Let’s take a look at stocks today (Tesla) to see what’s happening. I’ve copied the monthly timeframe chart, below:

stocks today

The pattern on Tesla is not very clear to me. It too reached all time highs recently. It’s touched a resistance area a couple of times, at around 495.33. It has pulled back quite significantly on the RSI indicator but note that the MACD and signal lines have not yet crossed over to the downside. A recovery or further downwards push is entirely possible. Let’s zoom in on the daily timeframe and see what else is happening:

You can see much more clearly, what is happening on the daily timeframe, above. You can see the resistance at the all time highs more clearly and also the slight support level marked at around 328.51 on the chart. It looks to me like the price is still very much in a downward pattern – note that it is currently making lower highs and lower lows – as marked by the diagonal resistance line, here:

The above analysis should give you an idea of what could happen next with this stock, although it is for you to decide upon this and make a critical judgement. There are lots of resources on this blog to help you understand charts, including information on candlestick patterns, here:

Japanese Candlesticks – Trader Pro Consultancy – Learn how to Trade the Stock Market

and also, understanding Support and Resistance levels, here:

Support and Resistance – Trader Pro Consultancy – Learn how to Trade the Stock Market

I hope you found this article on stocks today, helpful.

Disclaimer!

Nothing on this blog should be taken as financial advice or encouragement for you to enter a trade.  You are expected to speak to a financial adviser or carry out your own due diligence before entering any positions.  Everything on this blog is made for educational purposes and to equip you with the knowledge you need to be able to make your own financial decisions.

For more great tips and advice on trading the stock market, please visit:

https://sophiatrades.co.uk

To watch me trade live please visit my patreon page here:

https://www.patreon.com/Traderpro8320

Finally, if you would like to receive a discount on the Trading View charting software I use, please click on the relevant link here:

https://www.tradingview.com/?aff_id=117138

Please note any subscriptions taken via my affiliate link with Trading View may result in me earning a small commission.  However, I provide complete transparency on me using Trading View personally – I publish my success on the financial markets via my broker reports and any profits earned were done so by using my own Trading View subscription,  so I genuinely do recommend them and have been using the Trading View charts for many years.

What are stocks?  Everything You Need to Know

What are stocks? Everything You Need to Know

You may have heard it’s a good thing to buy stocks, to invest in stocks, etc, but you may be new to the financial markets completely and you may be wondering what they are. Perhaps you are someone who has worked your whole life in a manual job and you have never had any dealings with the financial markets or business. Perhaps you have been a stay at home mum and you now want to understand how to look after your wealth and your finances for yourself? You have come to the right place. Let me help you understand, what are stocks…

What are stocks? The basics

In a nutshell, a stock is a share of a company. When answering the question, what are stocks, you should think of the answer like a literal slice of pie:

What are stocks

The pie – the whole pie, is a company/business and buy purchasing a ‘share’ you will literally own a fraction of the business. Stocks have particular ‘control’ rights when it comes to running the business. Since you would partly own the business by owning a share, you would have the right to control what goes on in the business. This is handled by shareholder meeting and votes. Note that some shares do not attract voting or control rights. You need to pay attention to the ‘class’ of shares which you are buying and what rights are attached to them. When answering the question what are stocks, therefore, we must note that different stocks have different benefits and rights attached to them.

What other benefits come from owing a stock?

Since you own a part of a business when you purchase a stock, you are also entitled to receive income from the business (insofar as its profitable). You may receive income as ‘dividends’, or you can wait for your stock to accumulate in capital value. Over time, the business will ‘hopefully’ grow, and this will mean that your share will be worth more, later. What do we mean by ‘grow’? The business will be striving to make profit and that profit can be reinvested into new technologies, so that the business can sell more product. Note that if a company distributes a lot of its profits by way of dividends, then you are likely to get less capital growth in that particular shareholding. You can buy stocks which are good for capital growth (i.e. the directors typically decide to reinvest the profits into making the business grow and become more profitable), or you can buy stocks where the directors are usually paying a good chunk of the profits earned, out to shareholders in the form of dividends. You can tailor your stock portfolio to hold some of each!

I would like to refer you to my other article on dividends and how these can affect the share price of a company, which you may find helpful:

How does a dividend affect a share price? Everything you need to know! – Trader Pro – Learn how to Trade the Stock Market

I hope this article helped you to understand the answer to the question, ‘what is a stock?’.

Disclaimer!

Nothing on this blog should be taken as financial advice or encouragement for you to enter a trade.  You are expected to speak to a financial adviser or carry out your own due diligence before entering any positions.  Everything on this blog is made for educational purposes and to equip you with the knowledge you need to be able to make your own financial decisions.

For more great tips and advice on trading the stock market, please visit:

https://sophiatrades.co.uk

To watch me trade live please visit my patreon page here:

https://www.patreon.com/Traderpro8320

Finally, if you would like to receive a discount on the Trading View charting software I use, please click on the relevant link here:

https://www.tradingview.com/?aff_id=117138

Please note any subscriptions taken via my affiliate link with Trading View may result in me earning a small commission.  However, I provide complete transparency on me using Trading View personally – I publish my success on the financial markets via my broker reports and any profits earned were done so by using my own Trading View subscription,  so I genuinely do recommend them and have been using the Trading View charts for many years.

Stocks today – everything you need to know

Stocks today – everything you need to know

In this article i’m going to talk about the stocks today, and recent activity on the NASDAQ and S&P 500. This is another follow up to some of my other recent articles on what’s been happening in the markets. The markets are being affected by the Iran war so we have to bear this in mind when considering whether or not to open more positions. Let’s take a look at the charts…

Stocks today – NASDAQ

Stocks today

I like to consider the NASDAQ and the S&P 500 before zooming in and trying to establish which stocks may be good for closer attention in terms of ‘stocks today’! As you can see, there is no sign of any recovery yet, from the above chart. The price descended to a major support level on Friday and rebounded away from it, as can be seen by the last purple candle on the above chart. You can see the price touched the support level and then was pushed higher buy buyers coming in! Note the longer wick on this candle, a bit like a hammer pattern. To understand more about candlestick patterns, please see the following link:

Japanese Candlesticks – Trader Pro – Learn how to Trade the Stock Market

Also, if you would like a discount to the above chart software, please click below:

At the moment, the price is holding itself above the support level marked on the chart in white. It remains to be seen whether it will descend further or start to recover. I am still in the ‘waiting’ stage. I’m waiting to see prices start to make higher highs and higher lows before I enter any new positions. As far as stocks today are concerned, my conclusion for the NASDAQ is that I will wait to see what happens first…

S&P 500

The story on the S&P 500 stocks today, is very similar. With the turbulence from the Iran war and missiles being fired to Cyprus and other countries in the area, it is no wonder they are struggling to pull up. Let’s take a look at the S&P 500 chart:

stocks today

You can see the exact same pattern almost, on the 500 top stocks in America too. It’s at a major support level and on Friday it rebounded away from it.

If you are a regular visitor to this blog, you will know that I like to focus my attention on the US markets. They are normally very bullish and I find it easy to find great trading set ups on the US markets. However, there are times when I need to exercise patience and caution. This is one of those times. I will be waiting for the markets to show signs of recovery before I invest or trade with any more open positions.

I hope you found this article helpful!

Disclaimer!

Nothing on this blog should be taken as financial advice or encouragement for you to enter a trade.  You are expected to speak to a financial adviser or carry out your own due diligence before entering any positions.  Everything on this blog is made for educational purposes and to equip you with the knowledge you need to be able to make your own financial decisions.

For more great tips and advice on trading the stock market, please visit:

https://sophiatrades.co.uk

To watch me trade live please visit my patreon page here:

https://www.patreon.com/Traderpro8320

Finally, if you would like to receive a discount on the Trading View charting software I use, please click on the relevant link here:

https://www.tradingview.com/?aff_id=117138

Please note any subscriptions taken via my affiliate link with Trading View may result in me earning a small commission.  However, I provide complete transparency on me using Trading View personally – I publish my success on the financial markets via my broker reports and any profits earned were done so by using my own Trading View subscription,  so I genuinely do recommend them and have been using the Trading View charts for many years.

What is Scalping in Trading – Everything you need to Know!

What is Scalping in Trading – Everything you need to Know!

What is scalping in trading? This is a common question asked by beginner traders so I hope I can help you out with an understanding….Scalping is a very specific style of trading. In order to understand what it is, you need to know how it contrasts with the other styles… Let me explain!

What is Scalping in Trading? – Background

So just to give some background, there are many different types of traders, and what distinguishes you as a trader, from an investor to begin with, is that you hold positions for shorter periods of time and selling them on quickly. Within the sphere of trading, however, there are different styles again – and some of these styles can be categorised based on how long the position is held open as with trading versus investing. There are ‘swing’ traders who typically hold positions overnight or for a few days, and there are day traders who are in and out of trades within the same day. Then there are scalpers…

So what is Scalping in Trading?

A scalper trader jumps in and out of the markets many times over, within the space of just minutes. They execute many trades over the course of a day, accumulating profits slowly in small increments. I hope you are starting to understand the answer to the question, what is scalping in trading.

Positions are typically held for a few seconds to a few minutes. Traders who trade in this way, tend to focus on markets with high liquidity, so that they can enter and exit position easily. (If there are many buyers and sellers it helps them get in and out multiple times). They trade the smaller timeframe charts.

What scalping strategies are available?

There are many scalping strategies available to follow and many higher time frame strategies can be used on the smaller timeframes too. You can find a lot of traders on YouTube sharing their scalping strategies with you. My advice would be to test one with very small risks at first (risk only, say, £1 per trade) until you know it works, as there are many traders on YouTube who are misinforming people.

Is Scalping better than Swing trading?

This is a very difficult question to answer, because it depends on what you need and want from your trading. You may say, well, just money! However, the other details can be important for some traders. For example, I am a female trader, and the aim of this blog is especially to encourage other women to have the confidence and knowledge on how to trade the stock market. If a woman has small children, it may not be a suitable strategy for her to employ, as she will have many distractions and scalping may require high levels of concentration over a period of time. Unless of course she has childcare or periods where the kids are with Granny, hubby etc. This is in contrast to swing trading, where the trader can probably set a stop loss and target, and walk away for several hours or days.

Some traders are also more comfortable with deciding slowly and carefully, what the plan is, and executing it – and placing orders to safeguard it, whereas other traders may prefer to make decisions quickly in the moment! For some traders, the speed at which you need to make decisions as a scalper, will terrify them. It probably depends heavily on your preference for handling other things in life – do you like working under extreme pressure, or do you like to go carefully and slowly, and take your time? Only you can answer this.

What types of indicators are common in a scalping strategy?

Scalping traders commonly use indicators like the moving averages, the RSI, the MACD, and bolinger bands as indicators on where to get in and out of the markets. I personally use the MACD indicator a lot, and I know it can be used on the smaller timeframes, but it must be applied with discipline when the ‘direction’ of the market, is clear. I am not a scalper, however.

If you would like to understand more about the MACD indicator and some of the other ones I’ve mentioned, you can refer to the technical indicators section of this blog:

Technical indicators – Trader Pro – Learn how to Trade the Stock Market

I hope you found this article helpful in understanding the answer to the question, what is scalping in trading.

Disclaimer!

Nothing on this blog should be taken as financial advice or encouragement for you to enter a trade.  You are expected to speak to a financial adviser or carry out your own due diligence before entering any positions.  Everything on this blog is made for educational purposes and to equip you with the knowledge you need to be able to make your own financial decisions.

For more great tips and advice on trading the stock market, please visit:

https://sophiatrades.co.uk

To watch me trade live please visit my patreon page here:

https://www.patreon.com/Traderpro8320

Finally, if you would like to receive a discount on the Trading View charting software I use, please click on the relevant link here:

https://www.tradingview.com/?aff_id=117138

Please note any subscriptions taken via my affiliate link with Trading View may result in me earning a small commission.  However, I provide complete transparency on me using Trading View personally – I publish my success on the financial markets via my broker reports and any profits earned were done so by using my own Trading View subscription,  so I genuinely do recommend them and have been using the Trading View charts for many years.