In this article I’m going to explain what support and resistance is, how it affects the markets and how you can use it to make more money in your trading. All traders have got knowledge about support and resistance, and they use this knowledge frequently when placing trades on the market – it would be suicide to attempt trading without it! So let’s get started in understanding it!

What is support and resistance?
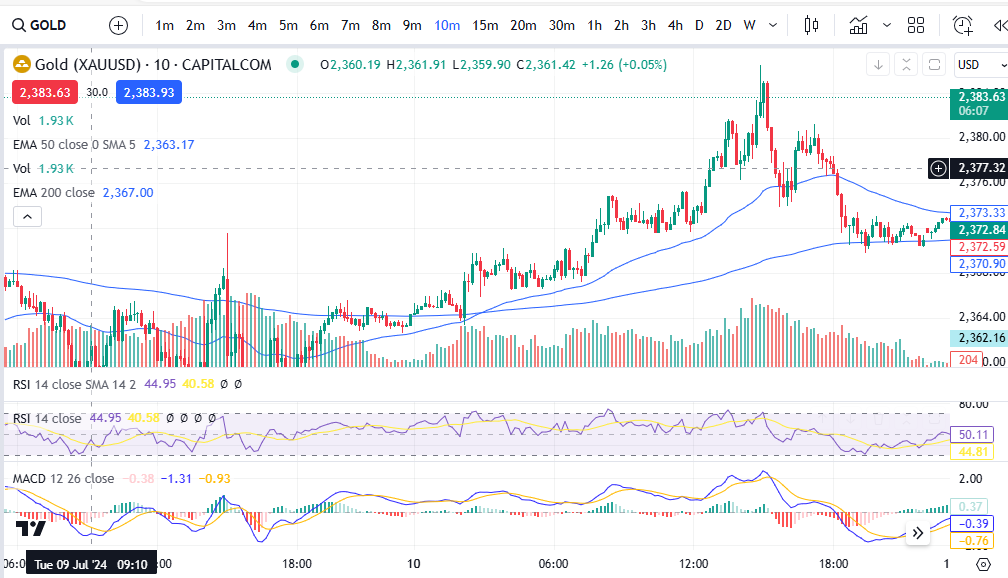
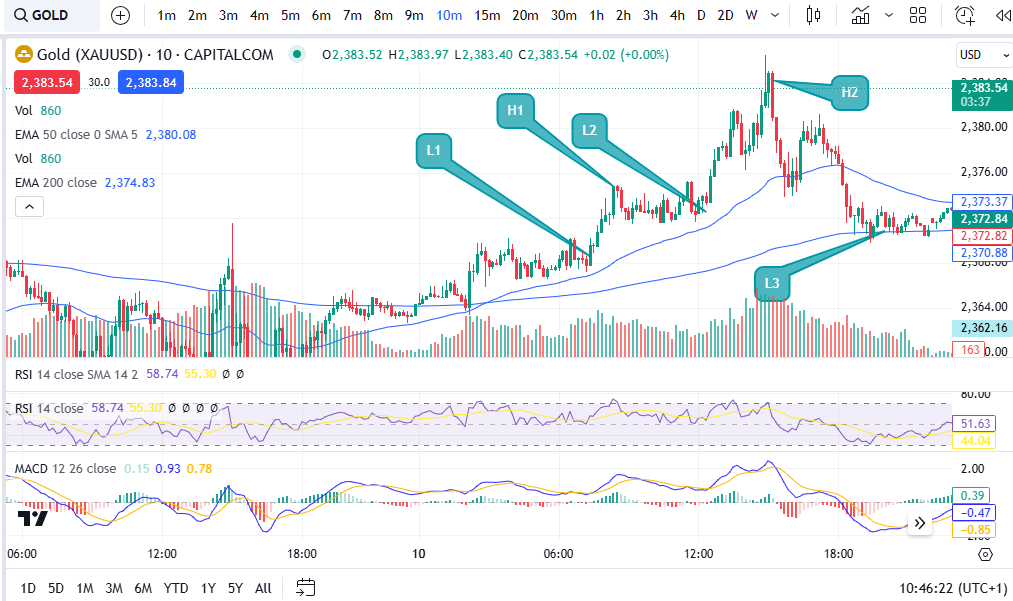
Support and resistance refers to areas which are particular zones of a financial chart where the price tends to touch the area and then rebound away from it. These areas are where there tends to be a lot of buying and selling pressure. Let’s take a look at some examples:
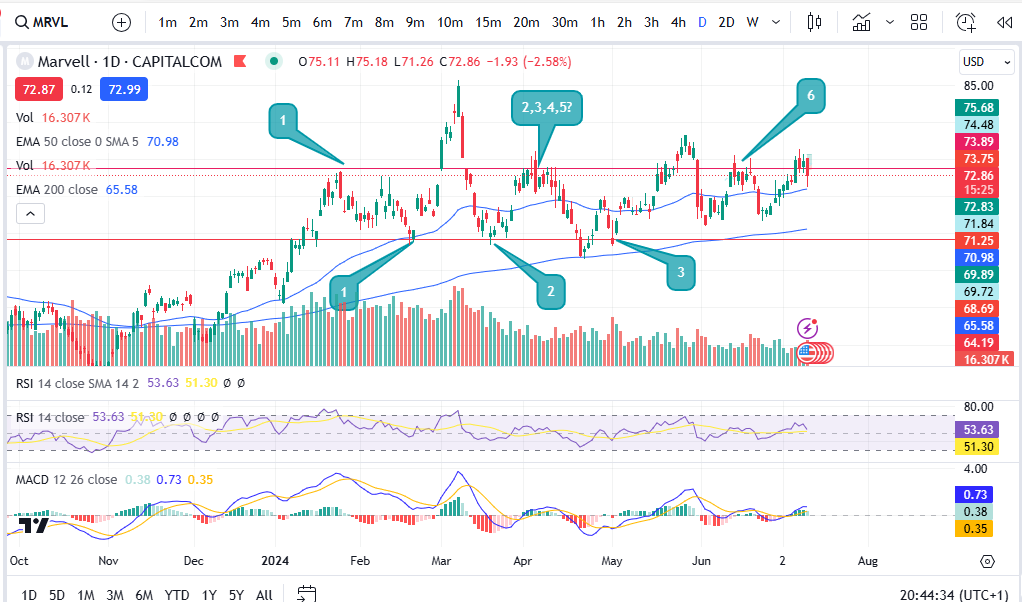
OK… So I’ve given you the example of the chart of Marvell. (If you would like a discount on the chart software I use, please click here):
https://www.tradingview.com/?aff_id=117138
As you can see on the chart, the price tends to touch the red lines and then rebound away. It has done this several times (numbered with the chat bubbles). When the price gets to around 71.25, the price tends to react at this level and push up from there. The opposite is true for the red line at the top of the price movements which is around 73.69.
So why does the price move in this way?
The answer is that many sellers including hedge funds and institutional investors, are aware that the price historically has reached such a level as a limit to the extent to which it can stretch before rebounding. Sellers and buyers are aware of these historical levels – and they then reinforce them by buying and selling at these levels even more, which creates something similar to a self fulfilling prophecy.
For example, if historically on the chart it can be noted that the price always moves up after it falls to the 71.25 level, many buyers will be watching and waiting for the price to reach this level before they place a buy order. They know there is a strong probability that the price will increase from this area. This in turn leads to more buying pressure and volume, creating the movement again away from the area – and so a pattern is formed after some time where this happens repeatedly. This leads me on to discuss the ‘usefulness’ of support and resistance in trading.
So how can support and resistance be used in trading?
If you can see historically that the price tends to move upwards after it touches a particular point on the chart, you can make a note of this and wait patiently for the price to enter the ‘support’ zone. The area will be called a support if there is a lot of buying pressure there. Likewise, the area is referred to as a ‘resistance’ when there is a lot of selling pressure at the area. Once the price has entered the support zone, the buyer can place a buy order and wait for the price to ascend upwards in line with the historical movements. The movement upwards from a support is not guaranteed but it will have a strong probability to move upwards from that spot.
The same is true for placing a sell order at a resistance level. A seller can place an order there and wait for the price to descend towards a profit target.
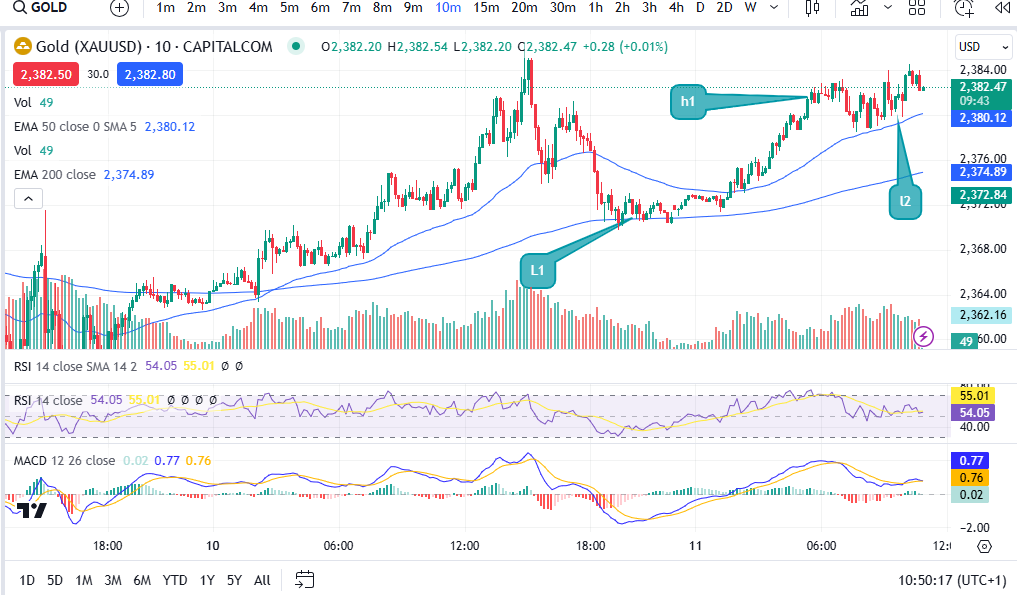
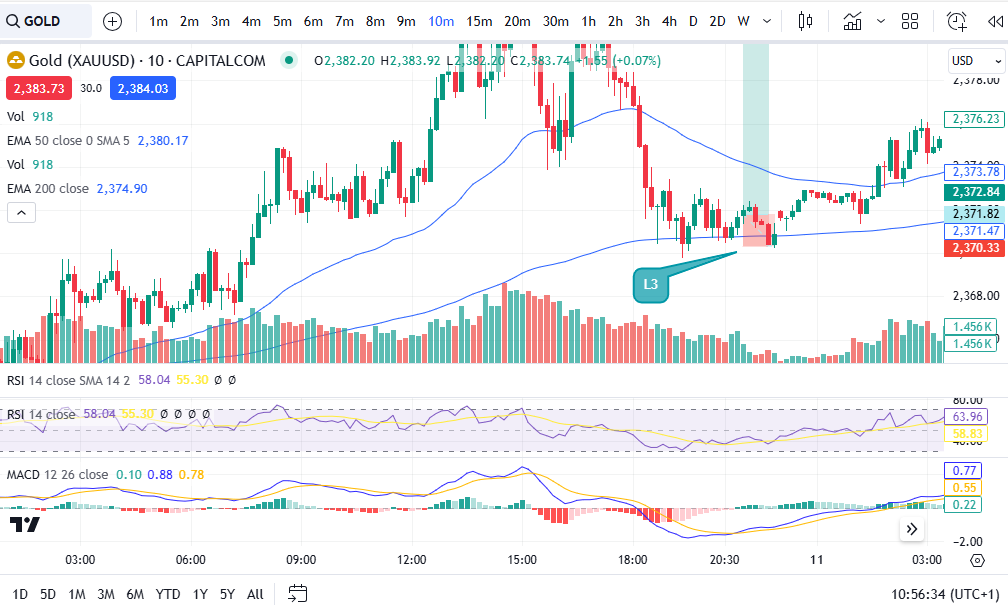
The stop losses can be set to the other side of the support/resistance zone, as so:
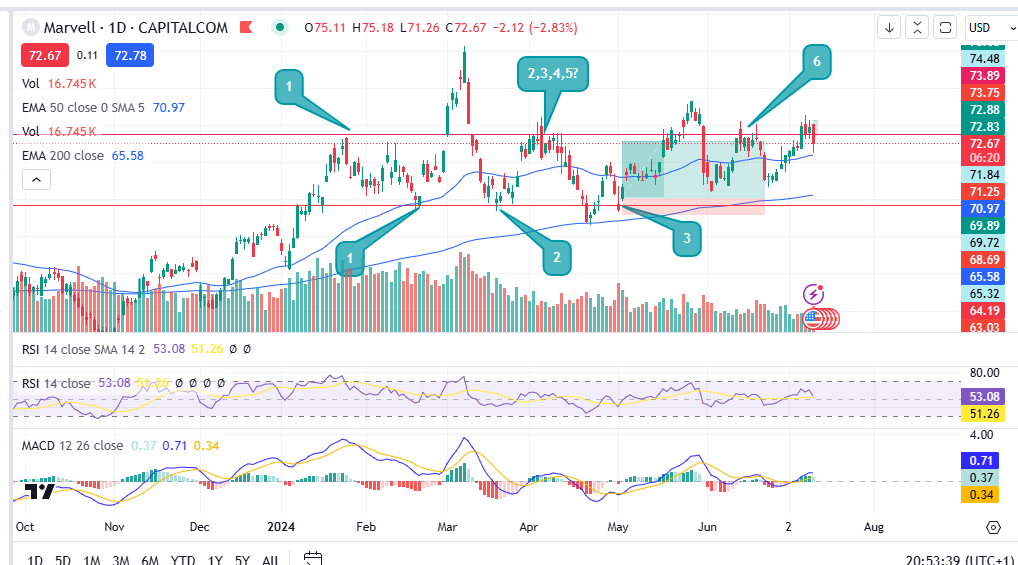
The stop loss would be placed where the bottom of the red zone is on the trade set up diagram above. The target could be set for the upper resistance area/line. This would apply the opposite way for a sell at the top line with the stop loss being placed above the top red line and the profit target being placed at the bottom red line.
As well as taking profit at these types of zones, some traders also place ‘break out’ trades. Break out trades work on the basis of the event of the price breaking through a strong support or resistance level. If this happens the price tends to move far and quickly beyond the level. Some break out traders achieve a 4:1 reward risk ratio for example. To understand risk management, please see my other article here:
How do you identify and draw these lines on the charts?
When ‘identifying’ support and resistance zones, you want to go to the daily time frame and zoom out as far as you can go, to see the greatest amount of historical price movement on the screen. Then take note of any really obvious levels. If you are squinting to see whether a level is present or not, it’s not! It needs to jump out at you and be really obvious. You want the price to have touched the level and rebounded at least three times but preferably more. The greater number of times it has touched the level and rebounded away, the better! I shared a video on my Patreon channel on how to draw support and resistance, here:
https://www.patreon.com/posts/support-and-102073984
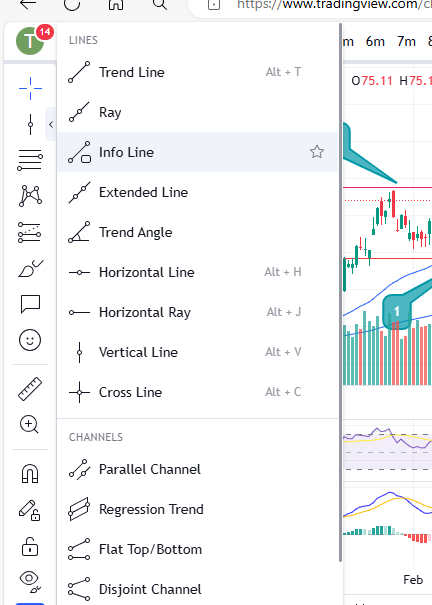
You can select some tools on most charts to apply horizontal or diagonal lines to a chart (support and resistance can happen diagonally too but these are less strong than the horizontal lines) – you can see them in Trading View in the menu on the left here:
Also note that the most recent activity is the most important activity. Be sure to observe any recently formed support and resistance lines as well as really old ones.
Another thing to be aware of is that when the price busts through one of these zones, let’s say a resistance level, this resistance will then likely become a support for the higher prices – meaning it will in future touch it and go up, whereas previously it was touching the level and rebounding down.
I hope you found this article helpful.
For more great tips and advice on trading the stock market, please visit:
To watch me trade live please visit my patreon page here:
https://www.patreon.com/Traderpro8320
Finally, if you would like to receive a discount on the Trading View charting software I use, please click on the relevant link here:
https://www.tradingview.com/?aff_id=117138
Please note any subscriptions taken via my affiliate link with Trading View may result in me earning a small commission. However, I provide complete transparency on me using Trading View personally – I publish my success on the financial markets via my broker reports and any profits earned were done so by using my own Trading View subscription, so I genuinely do recommend them and have been using the Trading View charts for many years.