In this article i’m going to answer the question, how do changes in interest rates affect the stock market. I’m going to focus on decisions by the FEDS but this will equally apply to changes by the Bank of England and other similar organisations. Let’s get straight into it!
How do changes in interest rates affect the stock market – let’s start with the basics!
First of all, when we talk about ‘how do changes in interest rates affect the stock market’, which interest rates do we mean, and who changes them, and why? The interest rates I’m talking about in this article, are the ones set by the institutions such as the Bank of England or the FEDS (Federal Reserve Bank in America). These organisations change the interest rates to try and control the economy and often inflation. They can change spending by businesses and the public by changing the rates. For example, when your mortgage goes up due to a change in rates, you have less disposable income, right? The same is true for businesses – they tend to borrow for business purposes, and this affects how much profit they can retain, reinvest and use to grow. If inflation is spiraling out of control in the economy, these organisations can increase the rates to slow the economy down. Let’s take a look in more detail, at some of these scenarios.
How do changes in interest rates affect the stock market – An increase to rates – the purpose and effect
When the FEDS increase the interest rates, it raises the cost of borrowing for individuals and businesses. Borrowing for mortgages, and business loans become more costly. This has the effect of slowing down the economy and the outflow of this is that inflation is being controlled – which is the purpose. The economy is slowed because of the lack of buying power on the part of the people and businesses who are paying the debts and this results in less sales for businesses and slower economy growth.
The effect on the stock market is that the investors will now be worrying about a lack of growth and they will switch their money out of stocks, into something more steady (but which attracts slower growth) like bonds.
What about a decrease to interest rates?
The opposite is true for a decrease to rates. With a decrease to rates, people and businesses have more disposable income. Businesses are able to make more investment into growing the business which in turn, can make more profit. People can spend more due to the increase in disposable income and they therefore buy more product, being produced by the businesses, and this in turn leads to more growth still.
How can I take advantage of these changes when trading or investing in the stock market?
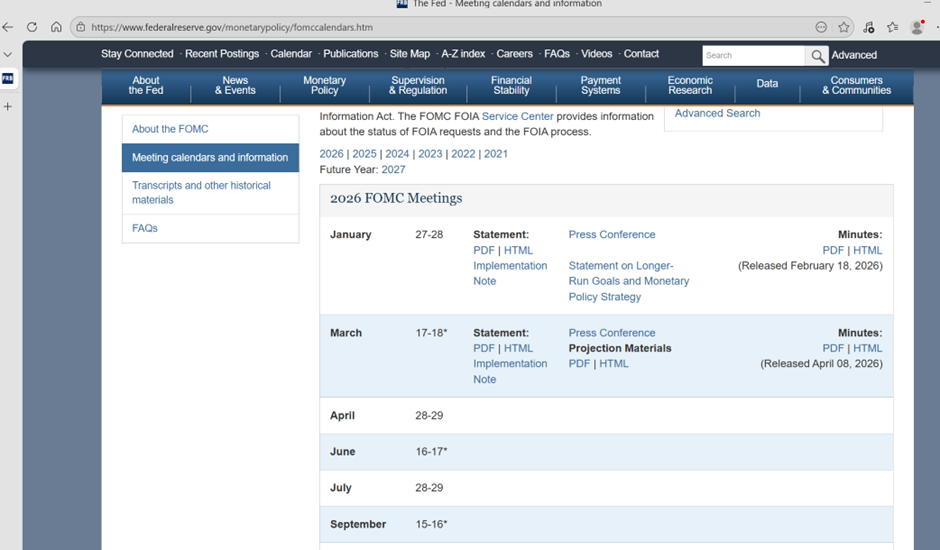
You can keep track of when interest rate decisions are going to be announced on the Federal Reserve Bank’s website, and the Bank of England’s website, and take note of whether the rate has increased or decreased and, therefore, how this will affect the stocks. I have published a separate page detailing links to the calendars noting the dates on which these organisations will next be making these decisions, here:
Nothing on this blog should be taken as financial advice or encouragement for you to enter a trade. You are expected to speak to a financial adviser or carry out your own due diligence before entering any positions. Everything on this blog is made for educational purposes and to equip you with the knowledge you need to be able to make your own financial decisions.
For more great tips and advice on trading the stock market, please visit:
Please note any subscriptions taken via my affiliate link with Trading View may result in me earning a small commission. However, I provide complete transparency on me using Trading View personally – I publish my success on the financial markets via my broker reports and any profits earned were done so by using my own Trading View subscription, so I genuinely do recommend them and have been using the Trading View charts for many years.
In this article I’m going to talk about a major FOMC meeting which is happening this week in the US. This meeting is scheduled for the 28th or 29th April. These types of meetings can affect the stock market – they can cause the price to dramatically increase or drop, during the meeting, depending on what the FEDS say in relation to what they are doing with the interest rates in America. Let’s jump into it and find out why…
FOMC meeting
Tomorrow will be another FOMC meeting in America. During these meetings, the Federal Reserve Bank decides whether or not to increase or decrease rates of interest in America. Briefly, when interest rates change, this can have an impact on the stock market. This is because borrowings are either more or less expensive for businesses and they are able to scale up or down more easily, and their businesses are cheaper or more expensive to run, depending on what they do with the rates, which can either lead to more or less profit being made. This in turn has an impact on the stock market and the share prices and especially during the FED meeting. The reason for this is that the stock market investors are factoring in, what they perceive will be the impact of the FED’s decision on the price of the stocks.
If you go to FED calendars on the link above you will see the following screen on their website. You can see there is a meeting scheduled for 28th to 29th April.
When we get close to the time of the meeting, the stocks do sort of ‘stagnate’ slightly… I can see that stagnation is happening currently. I’ve closed out of a few of my major positions while this is happening. I will be waiting to see what the FEDS say about the interest rates, in the meeting.
If they say the interest rates are going to go down, it may result in the stock prices increasing – even during the meeting. The opposite is true as well. You can often literally see the price of the NASDAQ jumping around on the chart, while the FED meeting is going on and while they are taking questions from the reporters.
It will be interesting to see what they decide tomorrow!
I hope you found this article helpful!
Disclaimer!
Nothing on this blog should be taken as financial advice or encouragement for you to enter a trade. You are expected to speak to a financial adviser or carry out your own due diligence before entering any positions. Everything on this blog is made for educational purposes and to equip you with the knowledge you need to be able to make your own financial decisions.
For more great tips and advice on trading the stock market, please visit:
Please note any subscriptions taken via my affiliate link with Trading View may result in me earning a small commission. However, I provide complete transparency on me using Trading View personally – I publish my success on the financial markets via my broker reports and any profits earned were done so by using my own Trading View subscription, so I genuinely do recommend them and have been using the Trading View charts for many years.
I’ve listed below some of the key links which you may need in order to understand the markets, depending on your trading style. This is especially important for fundamental analysis I will be adding to this page as time goes on so please keep an eye out for further information which may be relevant for you.
Companies House in the UK (for downloading companies’ financial statements): Companies House – GOV.UK
Disclaimer!
Nothing on this blog should be taken as financial advice or encouragement for you to enter a trade. You are expected to speak to a financial adviser or carry out your own due diligence before entering any positions. Everything on this blog is made for educational purposes and to equip you with the knowledge you need to be able to make your own financial decisions.
For more great tips and advice on trading the stock market, please visit:
Finally, if you would like to receive a discount on the Trading View charting software I use, please click on the relevant link here:
https://www.tradingview.com/?aff_id=117138Please note any subscriptions taken via my affiliate link with Trading View may result in me earning a small commission. However, I provide complete transparency on me using Trading View personally – I publish my success on the financial markets via my broker reports and any profits earned were done
In this article i’m going to talk about the Gold price chart and some of the key aspects of understanding how to trade Gold. We will look at the longer term price action per the chart and its relationship with stocks and confidence in the overall economy. Let’s get straight into it!
Gold Price Chart – relationship to the stocks and general consumer confidence
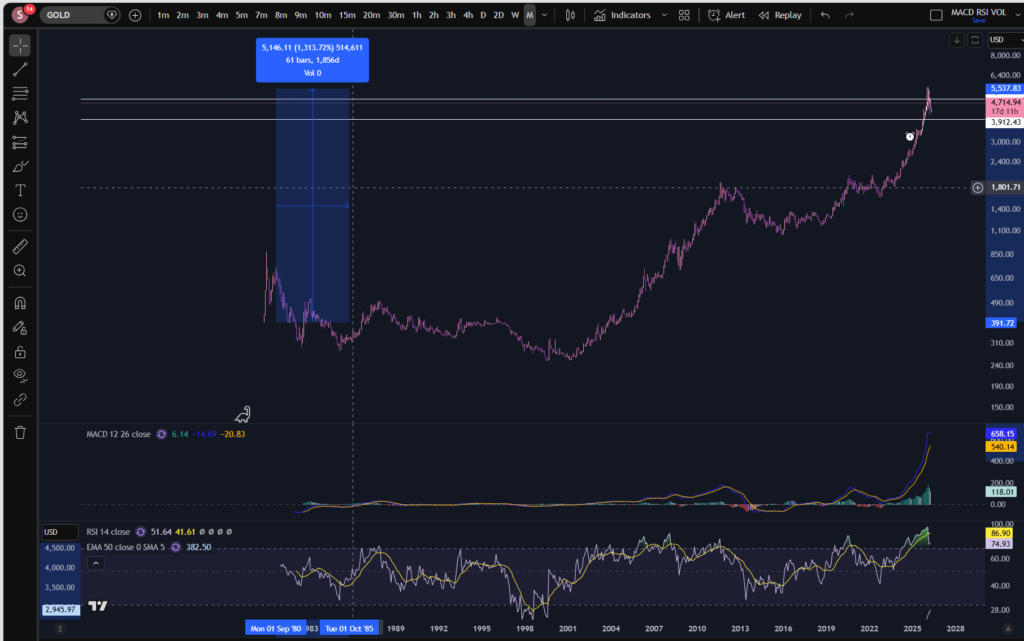
There is an inverse relationship between consumer confidence and the price of gold. This is because when consumer confidence is low, consumers consider that Gold, a precious metal which is real physical thing and valuable in the real world, is worth investing in. The value of Gold increases slowly and steadily over time, like a slow, steady, ticking clock. Let’s take a look at the monthly timeframe chart to get a view of the long term movements of Gold:
If you would like a discount to the chart software that I use (Trading View), please click the link below:
As you can see on the above chart, dating back to 1980, the price of Gold has climbed slowly to a record high. Over this time, the price increased by 1,313%.
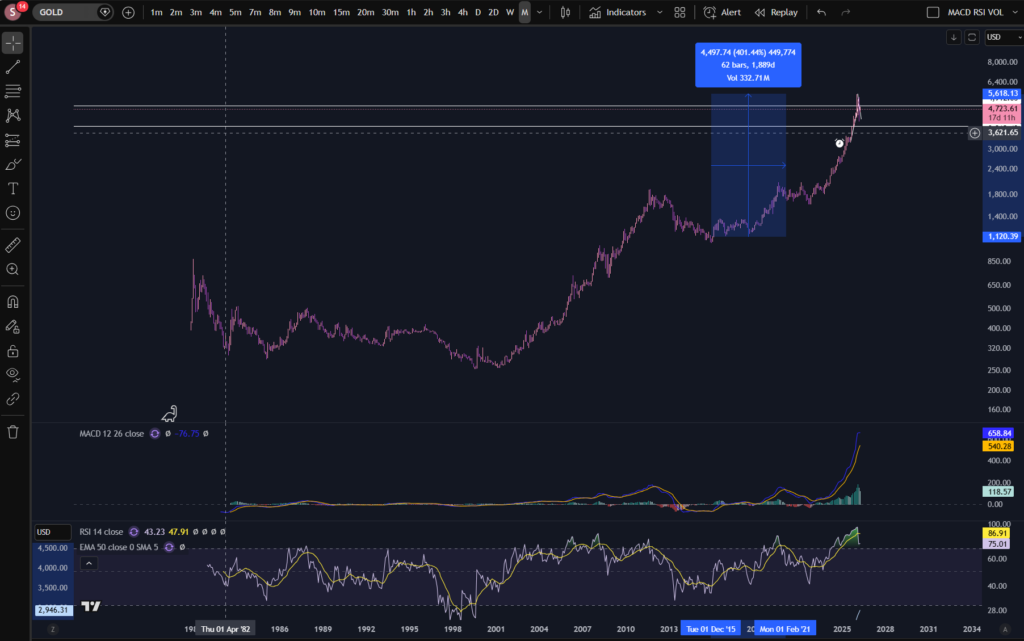
Over the last ten years, the price grew by approximately 400%:
On average, over the ten years this works out to be:
5,618-1120 = 4498 USD
/10 =449 USD per year
This works out to be an annualised return of approximately 13.7%.
When economic growth is strong, consumer confidence is high, and consumers tend to favour higher yielding investments rather than slow and steady. This can cause the price of Gold to dip.
How is the Gold price chart affected by inflation?
If consumer confidence is being driven or influenced by inflation, we may see the Gold price chart prices increasing with a corresponding decline in the relevant currency value.
So is there anything we can use to give us an indication of what levels of consumer confidence are relevant? Yes! We can use the Conference Board’s Consumer Confidence Index (CCI). You can see the website for the CCI here:
If targets are missed, this can trigger nervousness for the markets and this will likely have a positive impact on the Gold price chart.
What happens to the Gold during a recession?
The price of Gold tends to increase during recessions as consumer confidence tends to be lower. As mentioned above, when consumer confidence is low, people tend to invest their money in Gold as a saver haven until the turbulence has reduced in the stock market.
Gold Price Chart – is there anything else to be aware of?
Although the Gold price chart is typically inversely related to consumer confidence and the stock charts, the correlation is not always perfect, as other factors can be at play, including interest rates, the strength of currency and political events and news around the Globe!
What does the CII Board currently say about what they expect to see in consumer confidence?
As per the CII website, they have published graphs showing that they expect consumer confidence to fall slightly from where it is currently. You can see this graph and data here, under the ‘Present Sitaution and Expectations’ index graph:
I hope the information published here will help you in your trading journey and in particular help you to decide whether you think the price of Gold will rise, or fall, in the medium to long term.
Disclaimer!
Nothing on this blog should be taken as financial advice or encouragement for you to enter a trade. You are expected to speak to a financial adviser or carry out your own due diligence before entering any positions. Everything on this blog is made for educational purposes and to equip you with the knowledge you need to be able to make your own financial decisions.
For more great tips and advice on trading the stock market, please visit:
Please note any subscriptions taken via my affiliate link with Trading View may result in me earning a small commission. However, I provide complete transparency on me using Trading View personally – I publish my success on the financial markets via my broker reports and any profits earned were done so by using my own Trading View subscription, so I genuinely do recommend them and have been using the Trading View charts for many years.
How does a dividend affect a share price? This is an important topic for any trader and definitely something you should be considering before placing any trade – both in general and in relation to the timing of the specific stock you are interested in trading. I’m going to talk about what a dividend is, how this affects the price of a stock and how you can prepare for these fluctuations as a trader.
We want to answer, “How can a dividend affect a share price”, but first of all, what is a ‘dividend’?
So…. back to companies 101…. we know that a company is a business (or it can be an investment vehicle) in a legal entity ‘wrapper’. It is treated as a separate person entirely, from the business owner(s). The business is split into portions like dividing up a pie and these portions are the ‘shareholdings’ of the company. So the people who own the business are the ‘shareholders’ and they each own a piece of the company in accordance with their share holding and certificate, like a slice of pie. A dividend is a mechanism by which, the business pays out some profit to its shareholders.
So how do dividends come about?
In order to determine an answer to the question, how does a dividend affect a share price, we must first also understand how dividends come about! Any assets or income belongs to the legal entity of the business and is received within the legal entity. In order to distribute some of this income to the owners of the business (the shareholders), a ‘dividend’ must be declared and paid. The business will declare a dividend from ‘distributable profits’ only. If they do not ensure the dividend is made from ‘distributable profits’ it is possible the dividend will be made illegally. This is a slightly different topic but the directors basically need to ensure that the business has got enough cash and spare money before paying the shareholders a dividend, to make sure it is being fair to its creditors. The worst case scenario which could occur is that the company could pay a dividend and it depletes funds needed to pay creditor liabilities – this is why they must be paid from ‘distributable’ reserves. This is a slight digression, but it was worth noting here for anyone who does not know much about companies and how they work.
OK, so back to where we were… the directors of the company will assess whether the company is in a position to pay a dividend, and they will ‘declare’ it / in other words, they will announce to the market, that they have decided a dividend will be paid. This is the ‘ex dividend’ date – which is important. The cash payment of the dividend will follow a little while later and will be paid to the share holders in accordance with their slice of pie share holding. So if the company is divided up into 10 slices of pie (shareholdings) and they are all equal shareholdings, and the company declares a dividend of £800, what this means is that each slice of the pie shareholding will receive £80 as a dividend.
Are dividends mandatory?
No – dividends are not a mandatory thing on the part of the directors. They need the freedom and discretion to be able to examine the company’s financial position, prior to making any dividend declaration, and consider whether the company can afford to make a dividend from its distributable reserves.
Not only this, but some companies do not usually pay dividends and other ones do. It is entirely in the discretion of the directors and they are usually following the particular customs of the company in question. If a company usually pays a 1% dividend to shareholders, the shareholders would be in a position where they are accustomed to receiving this, and they would expect it. Indeed, it may be the reason they purchased those shares – some shareholders just purchase shares for the purposes of receiving dividends, and some shares pay more dividends, and pay more ‘often’ than others – so if the investor is someone who is interested in receiving dividends as income rather than more capital growth from his/her shareholdings, they may tailor their investment portfolio to the companies which pay dividends regularly and at a good rate. Notwithstanding this, the discretion of the directors must always be applied to ensure the dividends are not made illegally (from non distributable reserves – depleting funds for the creditors).
So how does a dividend affect a share price then?
So when a company makes a dividend, this dividend is in effect, the company paying out some of it’s earned profits to the shareholders. The company’s worth (share price) is based on it’s assets and earnings potential – it’s an estimate by the market based on supply and demand, of what people think that is worth! So when the company pays out some of it’s worth as a dividend, it is literally depleting the balance sheet of reserves and profit/cash – which could be used to buffer the company from any troubles, buy more assets, grow the business etc. I’m not saying paying a dividend is a bad thing but it ‘must’ affect the share price – logically, it will.
So when the stock goes ‘ex dividend’ (when the dividend announcement has been made), you can expect the stock to take a temporary nose dive in terms of the share price.
How can you plan your trades around this?
Make sure before you open a position on an equity, that you know what the next ex dividend date is, and be prepared in the plan of where to enter and exit, for the drop in share price when the stock goes ex dividend. If you are confident that there will be no significant impact from the question, how does a dividend affect a share price that’s fine… but it could affect your win rate if you ignore this and get in anyway!
I hope you found this article informative on resolving the question, how does a dividend affect a share price. Perhaps if you did, you can leave a comment below!
Disclaimer!
Nothing on this blog should be taken as financial advice or encouragement for you to enter a trade. You are expected to speak to a financial adviser or carry out your own due diligence before entering any positions. Everything on this blog is made for educational purposes and to equip you with the knowledge you need to be able to make your own financial decisions.
For more great tips and advice on trading the stock market, please visit:
Please note any subscriptions taken via my affiliate link with Trading View may result in me earning a small commission. However, I provide complete transparency on me using Trading View personally – I publish my success on the financial markets via my broker reports and any profits earned were done so by using my own Trading View subscription, so I genuinely do recommend them and have been using the Trading View charts for many years.
In this article i’m going to talk about how you can read and understand a balance sheet with a view to carrying out fundamental analysis. This is key if you want to rely on fundamentals as a stock market trader. This article may also be useful for junior accountants as a general guide. Let’s get straight into it! In short, every set of financial statements which you will be able to find online about an entity you may be interested in trading, is comprised broadly of a balance sheet, a cash flow, and a profit and loss statement. The balance sheet will give you key information about the health of a company, the position it’s in at a set date (like a snapshot in time), in terms of whether or not it is able to meet its liabilities, how long it is likely to continue trading for etc. The profit statement and the cash flow will be covered in a separate article. I will also provide a separate article on reading balance sheet ratios.
What is a balance sheet – background
The notion of a balance sheet came from the ‘double entry’ accounting concept, thousands of years ago. I believe this originated in China, and it resulted from the double entry accounting method which was used as a way of keeping tight control of money in an organisation. The balance sheet is formed by a simple concept – for every ‘debit’ in a set of financial statements, there is a corresponding ‘credit’. At the end of a period – say, a year, all of the debits will be equal in value to the credits in the accounts. Why does this matter? Why do we make ‘double entries’ in a set of accounts? The idea is that for every asset or liability added to the business, there is a source or corresponding entry to denote what it relates to, or from whom it came, and correspondingly, to whom it will be paid at a later date. For example:
Share capital/premium adjustments – when making an addition to share capital in a set of accounts, we make a ‘credit’ to equity share capital/premium in the company’s accounts, and a debit in the company’s cash records for equal value. The credit denotes that the company owes money to the relevant shareholder. It’s a credit for that person/to that person. The debit records a receipt of an asset for the liability owing to the shareholder – a chunk of cash, which would have been received in the company’s bank account.
Note that debits on the balance sheet represent assets for a company or organisation, and this will feel odd to the reader of this article… mostly we associate credits with ‘good stuff’ but you must understand that the credits in your bank account, represent ‘debits’ for the banker, on the other side of the fence. You are only one party to that transaction. In your banker’s accounts, when you pay money into your bank account, they make the following entries:
Debit cash – assets for the bank
Credit liabilities – to Joe Blogs – (we as the bank, owe him this money which he can withdraw from an ATM whenever he likes etc).
Now, back to the balance sheet! I’ve explained that assets on a balance sheet are debits and liabilities are credits. As I explained, at the end of a period like a year of account, all of the debits for the assets recorded, will equate to the same value of ‘credits’ in the same period. In this way, the company will have a record of all assets, and the people to whom money is owed for those assets. The money could be owed to shareholders as i’ve illustrated above, or directors – by way of directors’ loans… it could also be owed to a bank – again, it’s the same concept… in the company’s accounts, they will debit cash, credit liability to HSBC or whichever bank is involved.
Balance Sheet – the features you will see
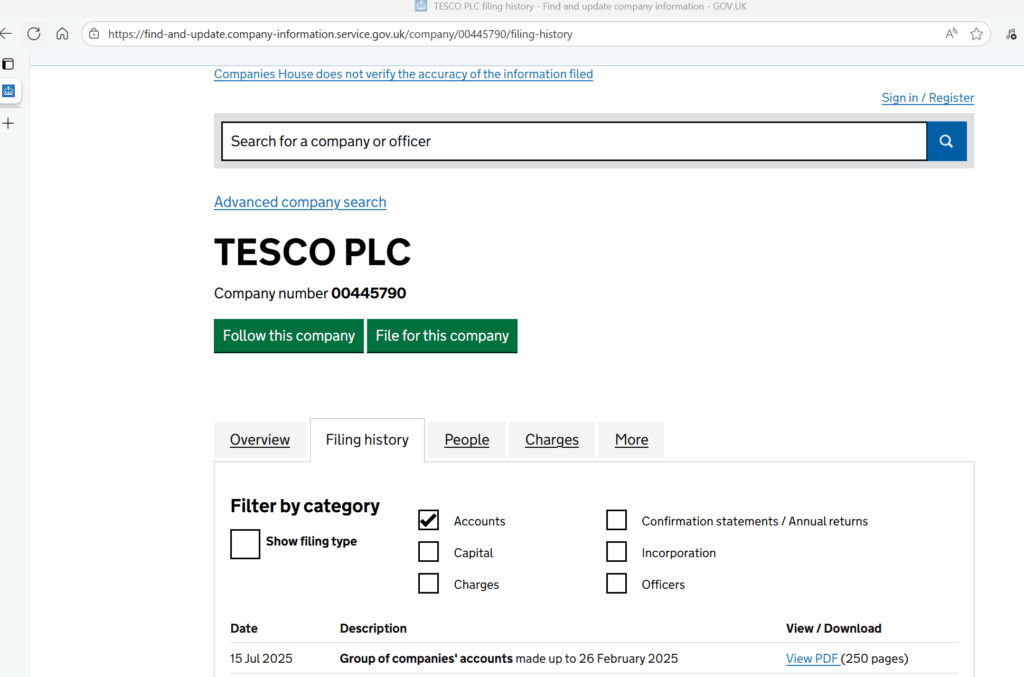
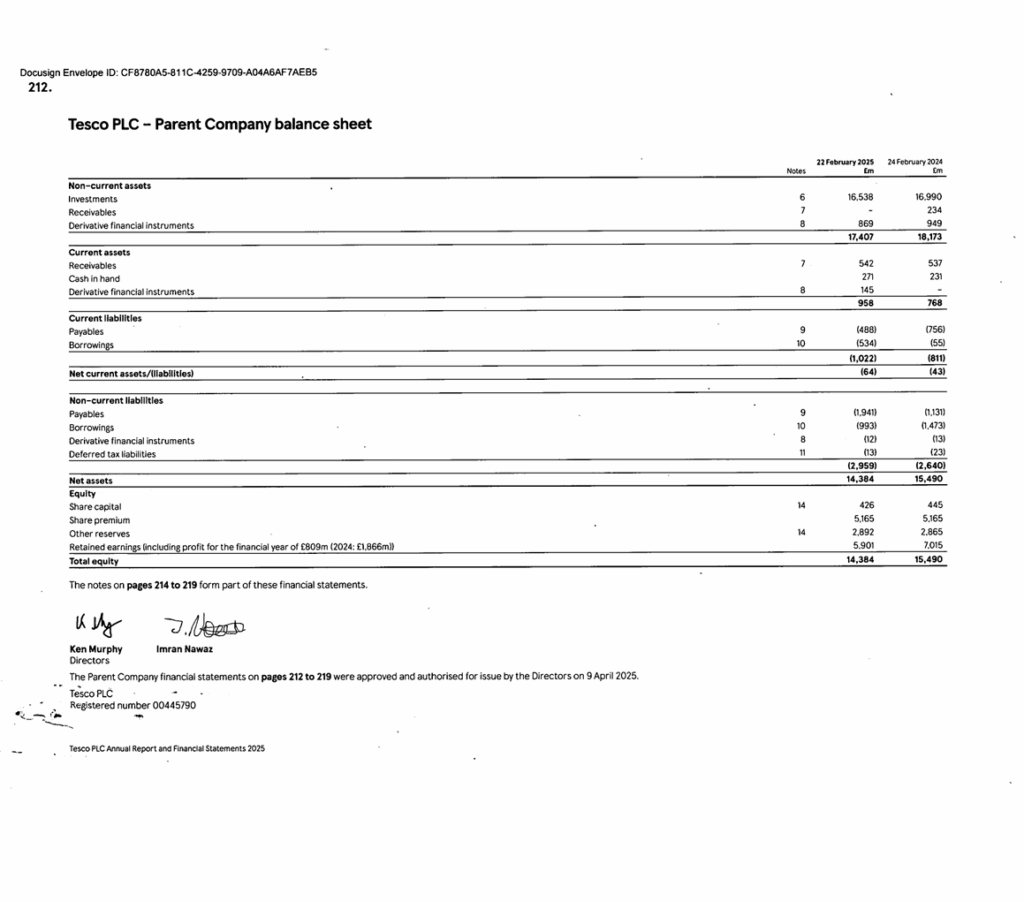
OK so now that i’ve explained to you what a balance sheet actually is, and how it comes about, let’s take a look at some real life examples. I’m going to show you the balance sheet of a well known retailer (Plc). PLC stands for ‘public liability company’. This means anyone can buy its shares. They are traded publicly on an open stock exchange. Let’s take a look at Tesco Plc’s balance sheet for the last year as published…
I’ve gone to the Companies House website in the UK and filtered for Tesco Plc, and then ‘accounts’. Anyone can retrieve this information from Companies House in the UK in respect of UK registered companies. This is free for the UK. However, there will be equivalent registries for companies in the United States etc for which there could be a charge payable.
Here is the link for obtaining this data… note that this search function is not restricted to PLCs. You can also retrieve information about ‘Selfridges’ the retailer on Oxford Street, for example, which is privately owned. You will not find Selfridges in your trading broker account.
Group balance sheet vs Parent balance sheet – what’s the difference?
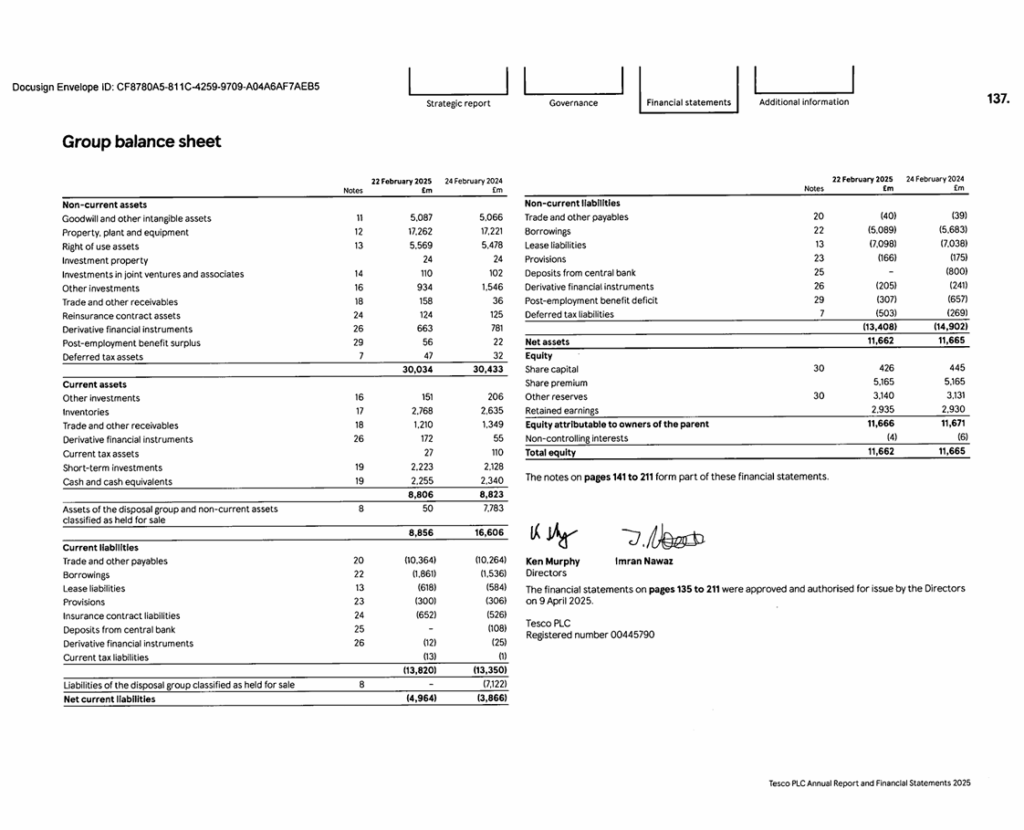
OK, so the first thing to note, is that there are two balance sheets… why is this? One of them relates to the ‘parent company’ only. It represents all of the assets and liabilities recorded in relation to the legal entity of Tesco Plc, solely. In contrast, the Group balance sheet, will also include the assets and liabilities of all of the company Tesco Plc’s, ‘SUBSIDIARIES’. Every time Tesco Plc buys another legal entity’s shares, and holds the controlling shareholding (>50%), it will have obligations and rules to follow in terms of reporting what the newly acquired assets and liabilities are in those subsidiaries, along with its own assets and liabilities. In the accounting world, once a parent obtains ‘control’ of another entity, it is viewed, almost like it’s the ‘same company’. Its basically the same people running both. The numbers are presented in group accounts, like it’s the same legal entity therefore.
Health of a company – a quick glance!
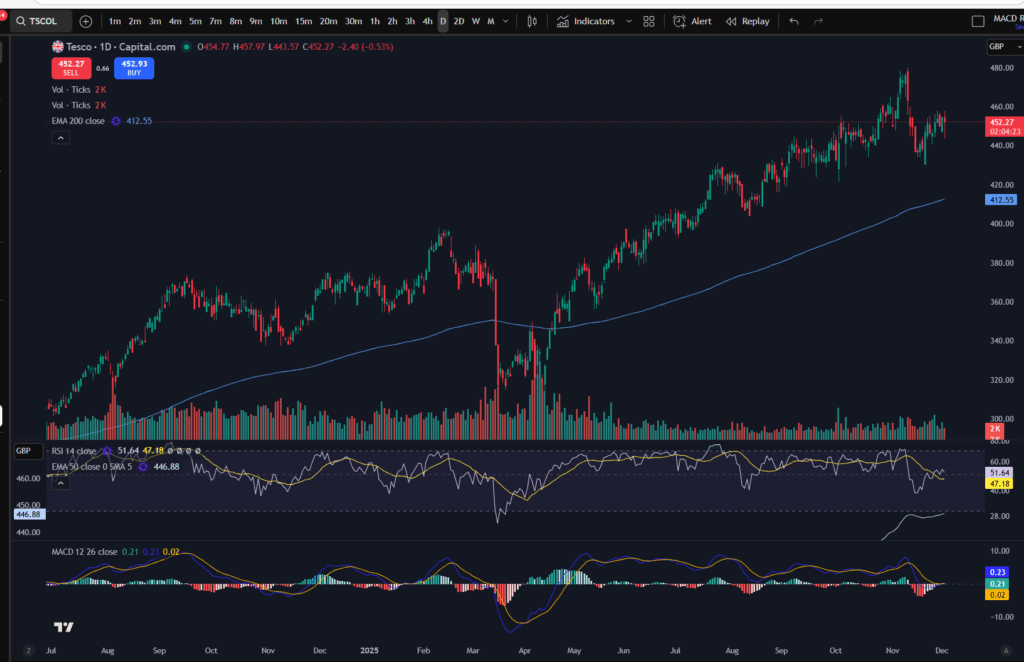
Before we get into what the actual assets and liabilities are, it’s important to note whether the company is in a position of net current ‘assets’ or net current ‘liabilities’. If a company is in a net current liabilities position, this is not a great sign as a start! It means the amount of assets it could convert into cash within the next year, will not cover the amount of liabilities the company is due to pay/discharge within the next year. As you can imagine, a company in this net liabilities position, may be finding things a struggle in terms of meeting liabilities as they fall due. Tesco’s position is that it is in a net liabilities situation, with assets recoverable within one year of £8.8m and it’s liabilities due within one year are £13m! I thought it might be interesting to take a quick glance at the company’s stock chart – when you compare this type of information, this is where it can get interesting! Interestingly, the company’s share price is growing per the daily timeframe below… obviously the net liabilities position is not something you will see simply by looking at the charts… if you are worried about a net liabilities position, you should most certainly check the directors’ statement in relation to ‘Going Concern’ and also the auditor’s statement on this.
Assets
As you can see, Tesco Plc has got a number of assets listed on its balance sheet. I’m going to talk about the group accounts going forward, since any time you buy shares in Tesco Plc, they will be affected by the performance of any of its subsidiaries too.
Let’s run through the items listed on the balance sheet, and I will tell you what they likely relate to…
Non current items:
What do we mean by ‘non current’? These are items which are going to mature/become payable after one year from the date of reporting.
Goodwill – this is an accounting adjustment which recognises and puts a value on, built up trust and reputation in any subsidiaries acquired. You don’t really need to focus on this very much when considering the company’s health.
Property, plant and equipment – this relates to property used in the business (not investment property), plant and machinery – any computers, tools, diggers, cars – basically anything which is purchased for the purpose of ‘running’ the business. Investments are categorised separately. These types of assets are held on the balance sheet at a value which is made up of cost less depreciation. (A regular adjustment is made to reduce the value on the balance sheet to represent the use of the asset over time – and this is known as depreciation).
Rights of Use assets – there was an accounting rule change a few years ago, and any leases now need to be recognised on the balance sheet either as liabilities or assets. In this scenario, the rights of use assets probably related to rented premises.
Investment property – this is where any properties held for investment purposes, where the company is receiving rental income, will be held. The values there represent the market value of these properties.
Investments in joint ventures and associates – these are investments in companies where Tesco Plc does not own the ‘controlling’ shareholding. It does, nevertheless, own some shares in other businesses as you can see.
Other investments – I have not checked the detail of these but note that you can check the notes to the accounts and you will find a ‘balance sheet note’ in respect of each item listed on the balance sheet. If you are unsure of what something relates to, you can check the notes to find out more information.
Trade and other receivables – these assets relate to contracts where other companies and people owe Tesco some money. A typical example is where another retailer may be selling some of Tesco’s goods and they owe Tesco money for items received. It could also relate to money paid on account, by Tesco to its suppliers. Until they ship something to Tesco, the ‘cash’ held at the other supplier company, is still owing to Tesco. ‘Other receivables’ could be staff loans, HMRC balances due to Tesco – for eg. where they have overpaid tax. Note that these items are non current. Typically, trade receivables such as supplier accounts, will fall under the current category (i.e. due within one year).
Reinsurance contract assets – these are amounts which are ‘recoverable’ from insurance companies. They are due to be paid/discharged to Tesco.
Derivative financial instruments – these can be complex financial instruments. It could be where the company has hedged its foreign exchange exposure for example – a ‘forward’ contract guarantees that Tesco can purchase another currency at a particular rate in the future, for a set period of time. This contract is a derivative financial instrument. It can be a liability or an asset, depending on which way the exchange rates have gone compared to the rate achievable under the contract.
Post employment benefits surplus – this is likely an accounting adjustment relating to employee liabilities. It could relate to holiday pay owing to the staff for example.
Current assets
Current assets are items which are payable or will become due, within one year. This is important for your fundamental analysis!!
Some of the items here are self explanatory – inventories for example – how much stock the company holds. The assets under ‘current’ assets are listed in order of liquidity (how quickly they can be converted into cash, with cash at the bottom).
Trade and other receivables – we talked about these above. These ones will be payable/due within one year.
Current tax assets – these are amounts due from the tax man payable within one year.
Short term investments – these are investments which are expected to mature within one year.
Cash and cash equivalents – this is what it says on the tin! It will be the amount of cash in the company’s bank account. Cash equivalents can represent assets which are very liquid and exchangeable almost immediately – like vouchers for example.
Current Liabilities
The liabilities listed under ‘current’, are all payable within one year.
You can see that the company has got some typical liabilities you would expect for a food retailer –
Trade payables – this is the amount due to its suppliers within one year
Borrowings – this will relate to the ‘current’ part of any bank loans payable
Lease liabilities – this could be for plant and equipment or rental premises
Provisions – these can relate to potential law suits or ongoing ones. It is likely that the accountants will ‘assume’ some will be inevitable, and they will estimate an amount each year. They could also relate to expected warranty claims in manufacturing businesses.
We’ve talked about the other current items as assets, so when they appear under the current liabilities section, they represent the amounts Tesco owe to someone else, for the same items.
Non Current liabilities
These represent items which are payable by Tesco after one year’s time. The items listed are self explanatory in light of my notes above.
Equity
This is generally where the share capital and premium goes – if you buy a share in tesco for £1, your £1 share credit will be sitting in this section of the accounts with your name attached! They also pay out dividends from this area.
This area collects profits each year which accumulate (or losses!!). These go under ‘retained earnings’. Note that the company will not legally be allowed to pay out dividends if they have negative reserves.
Other reserves can include adjustments such as uplifts on investment properties when they are revalued at market rates, intermittently.
The Non Controlling Interest section represents the value of any shareholdings held in the subsidiaries which are not owned by the parent company. It may be that Tesco Plc owns 60% of the shares of a company it has consolidated into its group accounts, but the other 40% of shares is owned by ‘Joe Blogs’. His shareholding goes under this NCI section.
Comparative periods
All parts of the financial statements of a company or organisation, will have comparative periods or balance sheet dates. These are very useful if you want to see the ‘direction’ the company has gone in, over the last year. For example, a negative movement on the reserves could mean a company has made a loss, in the absence of any dividend payments. A volatile cash balance may not be a good sign – especially if it’s decreasing year on year to an unhealthy level. Similarly, check out the company’s liabilities – which direction are they headed in? Does their growth, seem healthy? Any company will have a healthy level of debt but note should be made of the scale of this and what direction it’s going in!
Summary
This article was intended to give you a basic fundamental understanding of what a balance sheet is, and I hope it has achieved this. Watch out for subsequent articles on a company’s cash flow statement, balance sheet ratios and profit and loss statement. These will follow soon!
Used by Google Analytics to determine which links on a page are being clicked
30 seconds
_ga_
ID used to identify users
2 years
_gid
ID used to identify users for 24 hours after last activity
24 hours
_gat
Used to monitor number of Google Analytics server requests when using Google Tag Manager
1 minute
__utmt
Used to monitor number of Google Analytics server requests
10 minutes
__utmb
Used to distinguish new sessions and visits. This cookie is set when the GA.js javascript library is loaded and there is no existing __utmb cookie. The cookie is updated every time data is sent to the Google Analytics server.
30 minutes after last activity
__utmc
Used only with old Urchin versions of Google Analytics and not with GA.js. Was used to distinguish between new sessions and visits at the end of a session.
End of session (browser)
__utmz
Contains information about the traffic source or campaign that directed user to the website. The cookie is set when the GA.js javascript is loaded and updated when data is sent to the Google Anaytics server
6 months after last activity
__utmv
Contains custom information set by the web developer via the _setCustomVar method in Google Analytics. This cookie is updated every time new data is sent to the Google Analytics server.
2 years after last activity
__utmx
Used to determine whether a user is included in an A / B or Multivariate test.
18 months
_gac_
Contains information related to marketing campaigns of the user. These are shared with Google AdWords / Google Ads when the Google Ads and Google Analytics accounts are linked together.
90 days
__utma
ID used to identify users and sessions
2 years after last activity
Marketing cookies are used to follow visitors to websites. The intention is to show ads that are relevant and engaging to the individual user.
A video-sharing platform for users to upload, view, and share videos across various genres and topics.
This cookie is used to play YouTube videos embedded on the website.
2 years
VISITOR_PRIVACY_METADATA
Youtube visitor privacy metadata cookie
180 days
GPS
Registers a unique ID on mobile devices to enable tracking based on geographical GPS location.
1 day
VISITOR_INFO1_LIVE
Tries to estimate the users' bandwidth on pages with integrated YouTube videos. Also used for marketing
179 days
PREF
This cookie stores your preferences and other information, in particular preferred language, how many search results you wish to be shown on your page, and whether or not you wish to have Google’s SafeSearch filter turned on.
10 years from set/ update
YSC
Registers a unique ID to keep statistics of what videos from YouTube the user has seen.
Session
DEVICE_INFO
Used to detect if the visitor has accepted the marketing category in the cookie banner. This cookie is necessary for GDPR-compliance of the website.