In this article i’m going to talk about the Gold price chart and some of the key aspects of understanding how to trade Gold. We will look at the longer term price action per the chart and its relationship with stocks and confidence in the overall economy. Let’s get straight into it!

Gold Price Chart – relationship to the stocks and general consumer confidence
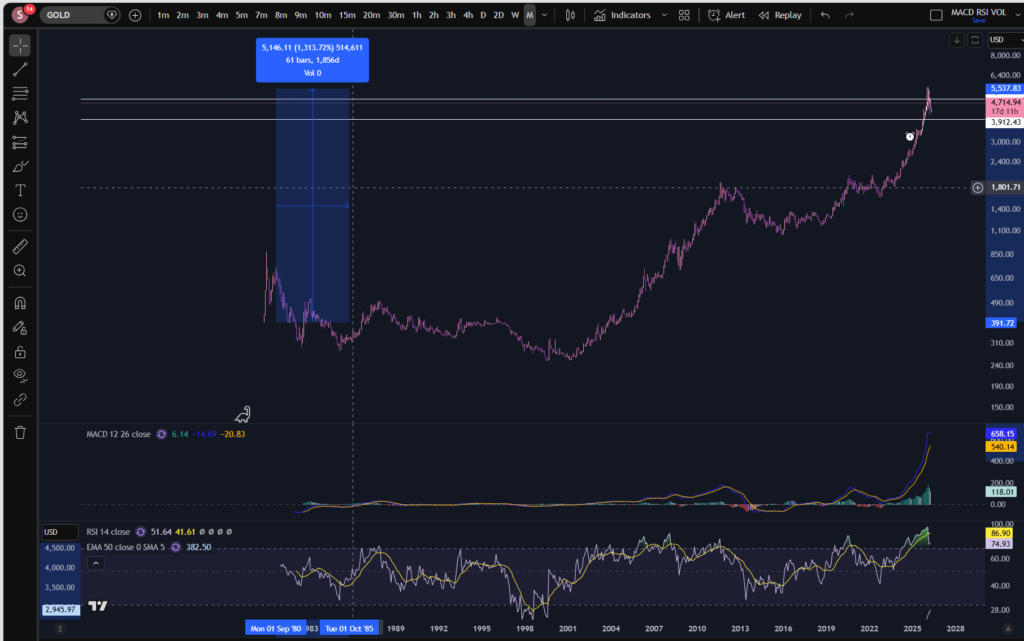
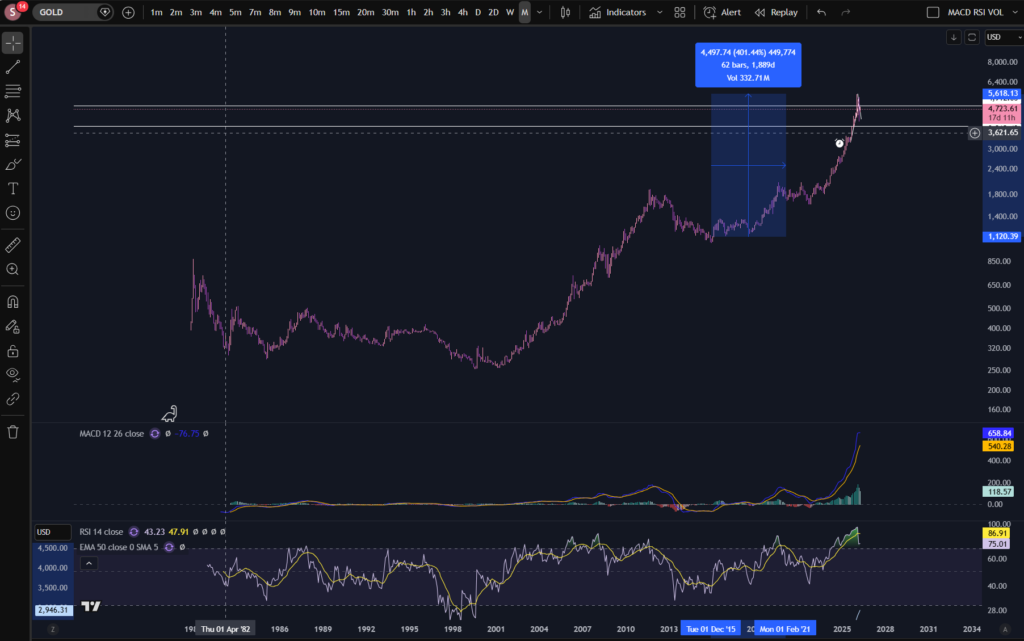
There is an inverse relationship between consumer confidence and the price of gold. This is because when consumer confidence is low, consumers consider that Gold, a precious metal which is real physical thing and valuable in the real world, is worth investing in. The value of Gold increases slowly and steadily over time, like a slow, steady, ticking clock. Let’s take a look at the monthly timeframe chart to get a view of the long term movements of Gold:
If you would like a discount to the chart software that I use (Trading View), please click the link below:
As you can see on the above chart, dating back to 1980, the price of Gold has climbed slowly to a record high. Over this time, the price increased by 1,313%.
Over the last ten years, the price grew by approximately 400%:
On average, over the ten years this works out to be:
5,618-1120 = 4498 USD
/10 =449 USD per year
This works out to be an annualised return of approximately 13.7%.
When economic growth is strong, consumer confidence is high, and consumers tend to favour higher yielding investments rather than slow and steady. This can cause the price of Gold to dip.
How is the Gold price chart affected by inflation?
If consumer confidence is being driven or influenced by inflation, we may see the Gold price chart prices increasing with a corresponding decline in the relevant currency value.
So is there anything we can use to give us an indication of what levels of consumer confidence are relevant? Yes! We can use the Conference Board’s Consumer Confidence Index (CCI). You can see the website for the CCI here:
If targets are missed, this can trigger nervousness for the markets and this will likely have a positive impact on the Gold price chart.
What happens to the Gold during a recession?
The price of Gold tends to increase during recessions as consumer confidence tends to be lower. As mentioned above, when consumer confidence is low, people tend to invest their money in Gold as a saver haven until the turbulence has reduced in the stock market.
Gold Price Chart – is there anything else to be aware of?
Although the Gold price chart is typically inversely related to consumer confidence and the stock charts, the correlation is not always perfect, as other factors can be at play, including interest rates, the strength of currency and political events and news around the Globe!
What does the CII Board currently say about what they expect to see in consumer confidence?
As per the CII website, they have published graphs showing that they expect consumer confidence to fall slightly from where it is currently. You can see this graph and data here, under the ‘Present Sitaution and Expectations’ index graph:
I hope the information published here will help you in your trading journey and in particular help you to decide whether you think the price of Gold will rise, or fall, in the medium to long term.
Disclaimer!
Nothing on this blog should be taken as financial advice or encouragement for you to enter a trade. You are expected to speak to a financial adviser or carry out your own due diligence before entering any positions. Everything on this blog is made for educational purposes and to equip you with the knowledge you need to be able to make your own financial decisions.
For more great tips and advice on trading the stock market, please visit:
https://www.sophiatrades.co.uk
To watch me trade live please visit my patreon page here:
https://www.patreon.com/sophiatrades
Finally, if you would like to receive a discount on the Trading View charting software I use, please click on the relevant link here:
https://www.tradingview.com/?aff_id=117138
Please note any subscriptions taken via my affiliate link with Trading View may result in me earning a small commission. However, I provide complete transparency on me using Trading View personally – I publish my success on the financial markets via my broker reports and any profits earned were done so by using my own Trading View subscription, so I genuinely do recommend them and have been using the Trading View charts for many years.