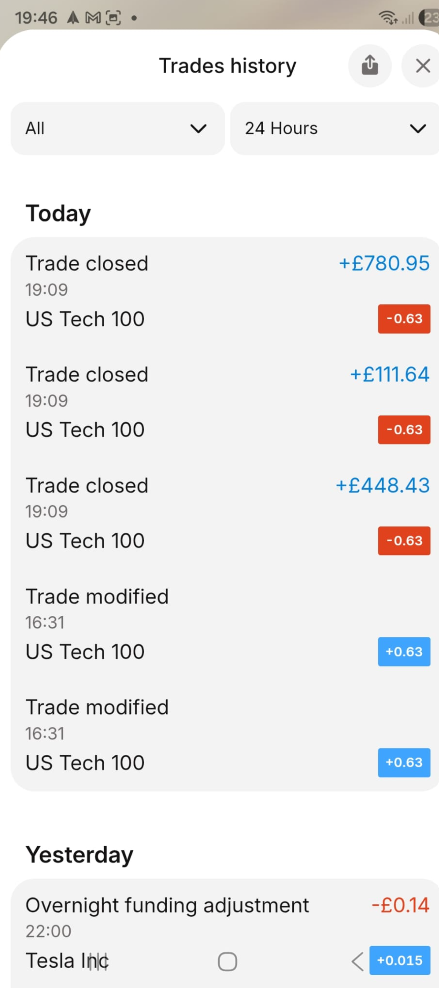
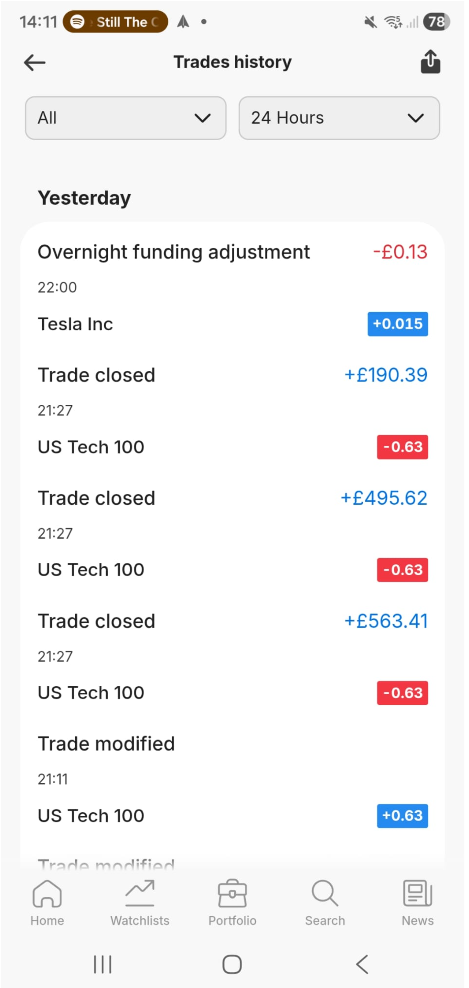
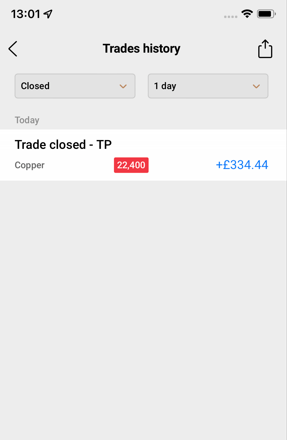
In the interests of being completely transparent with my stock market profit on the financial markets, I am publishing a screen shot here, of my recent success. I hope this gives you some confidence that I am a genuinely successful trader and there is money to be made on the financial markets. I trade with Capital.com. I do not have any affiliation with them.
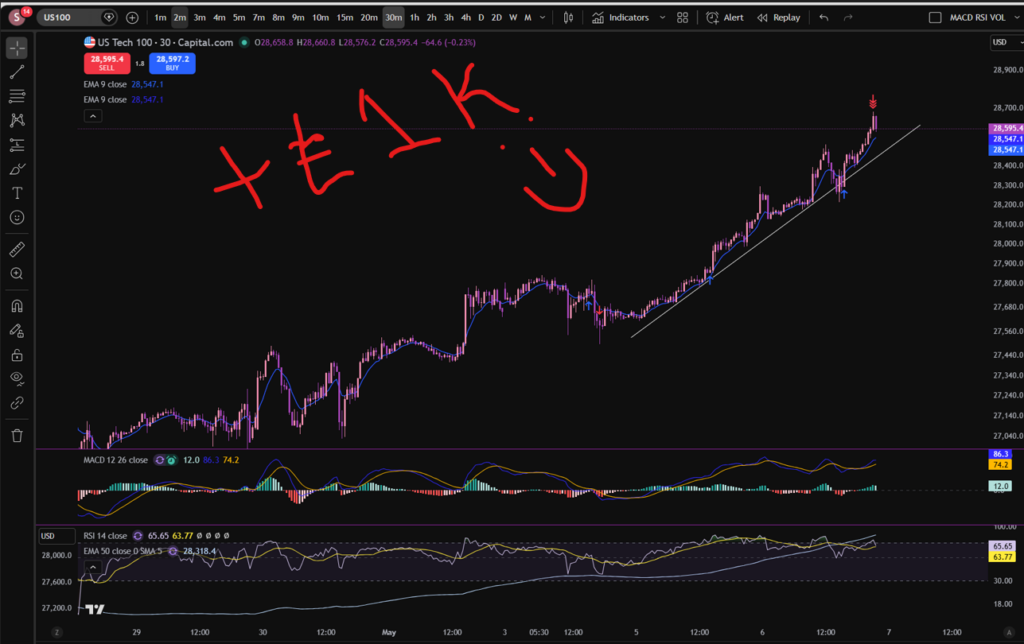
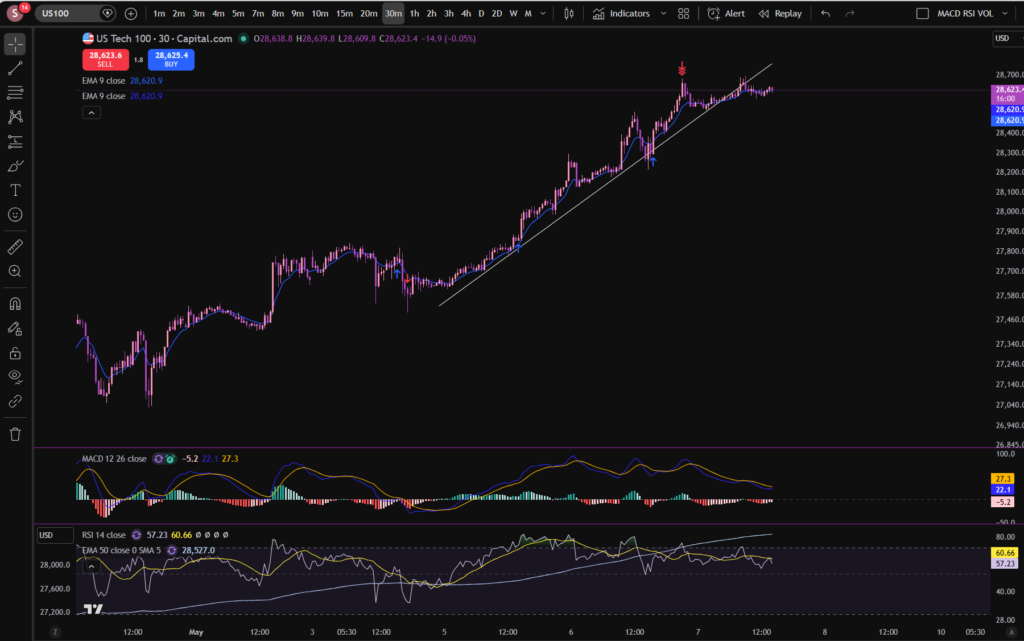
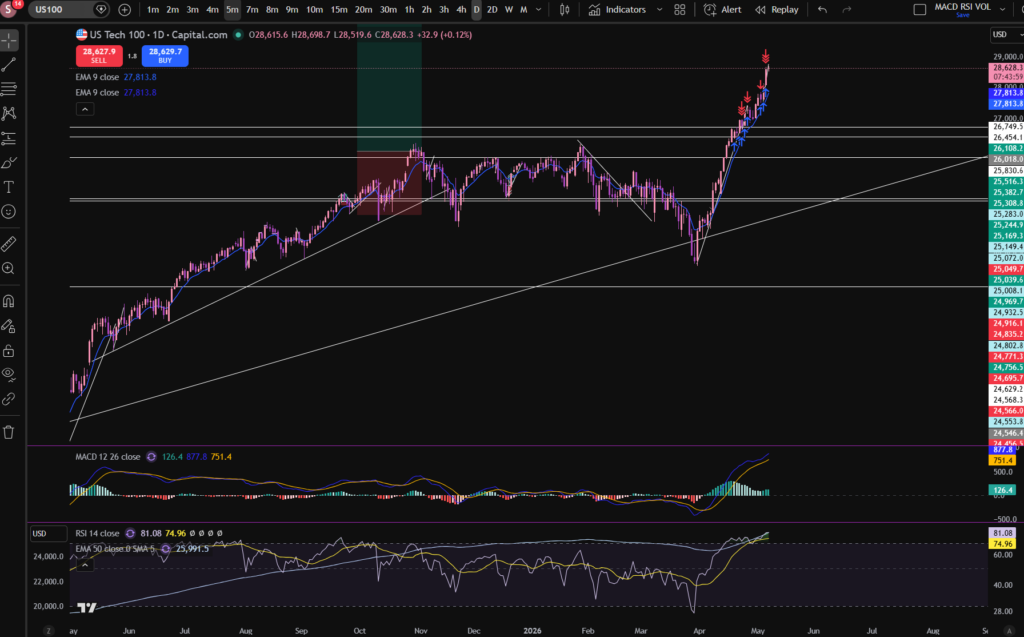
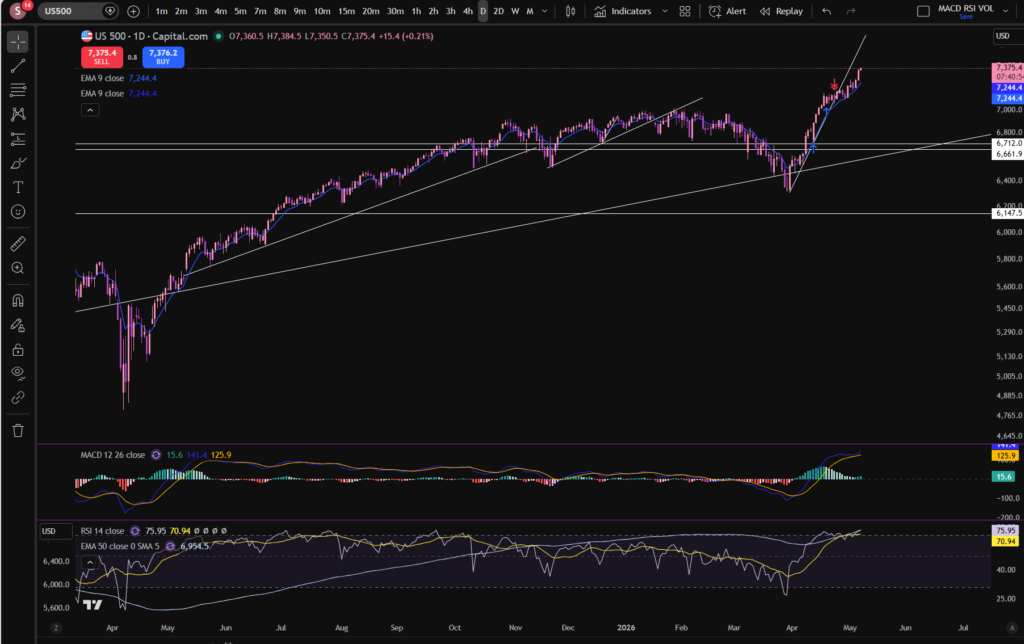
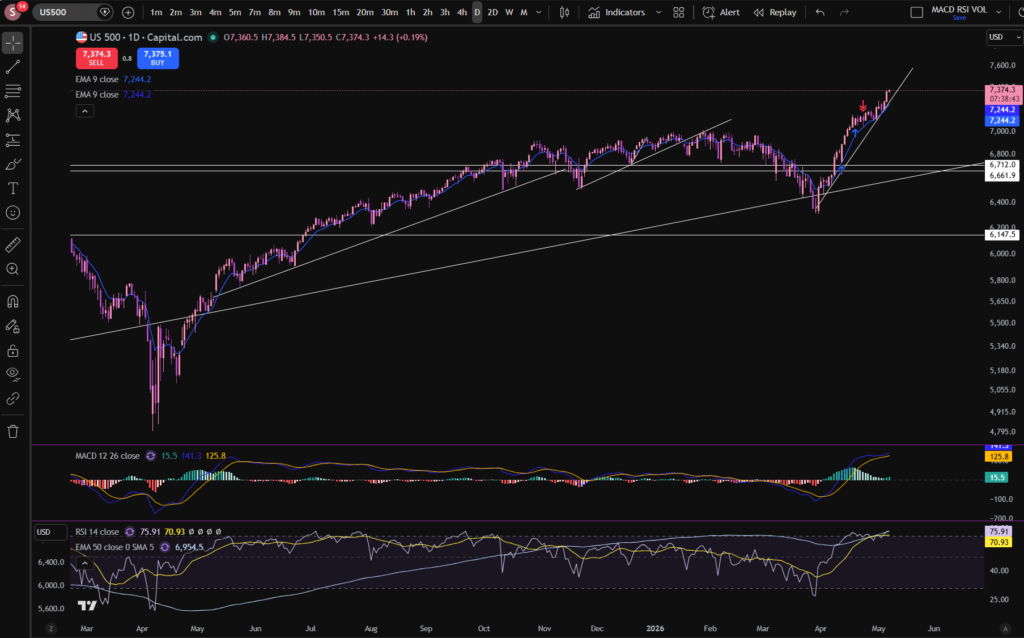
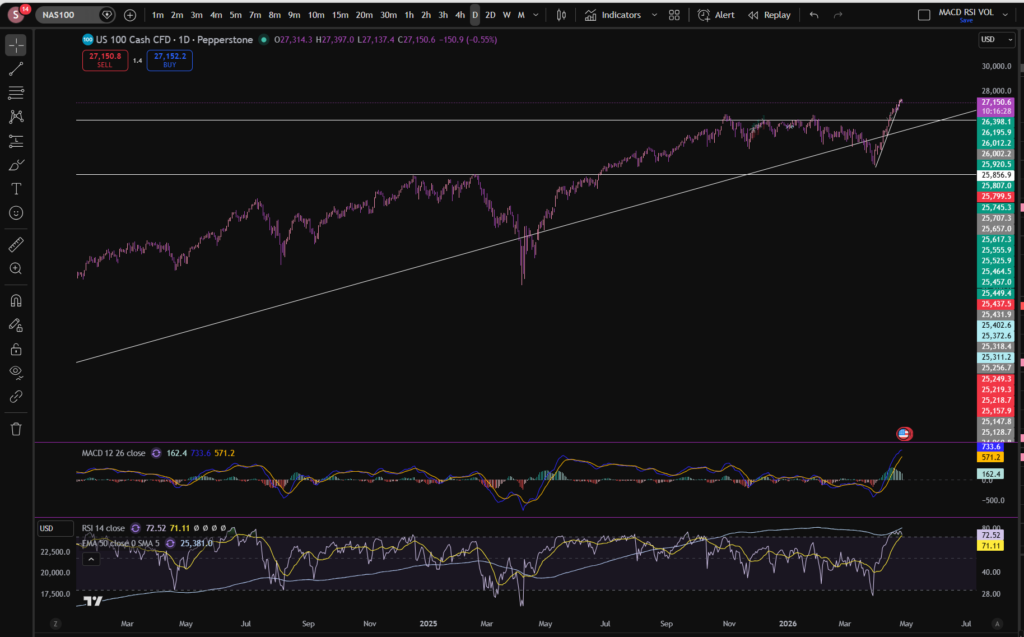
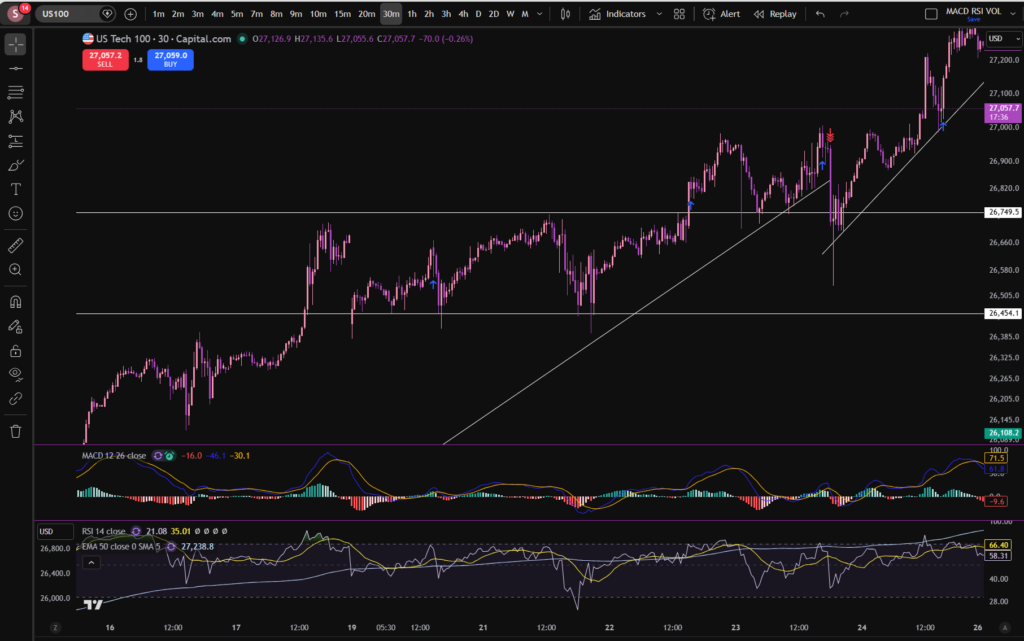
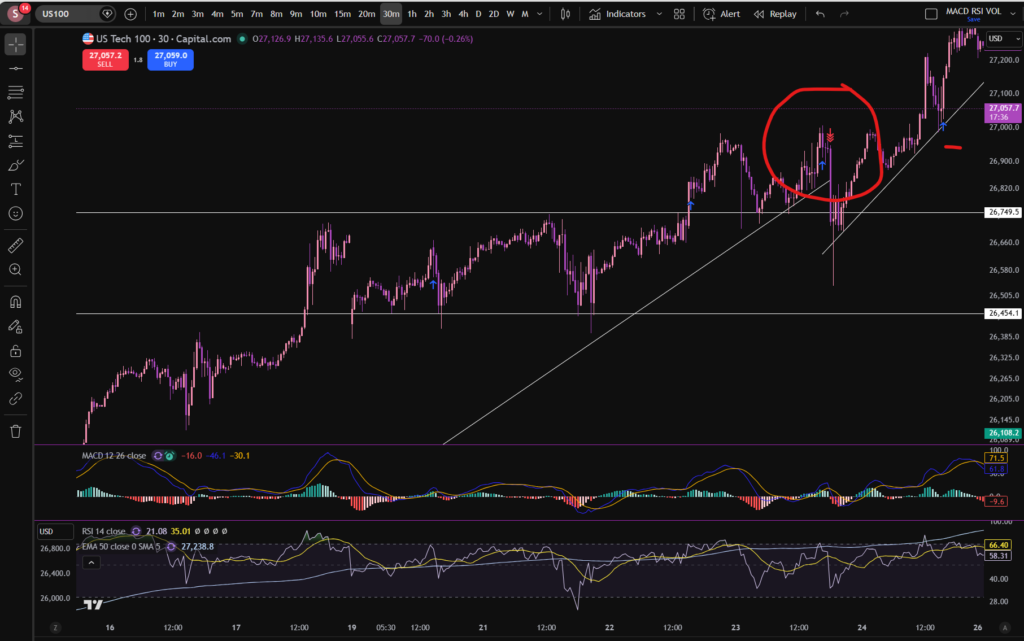
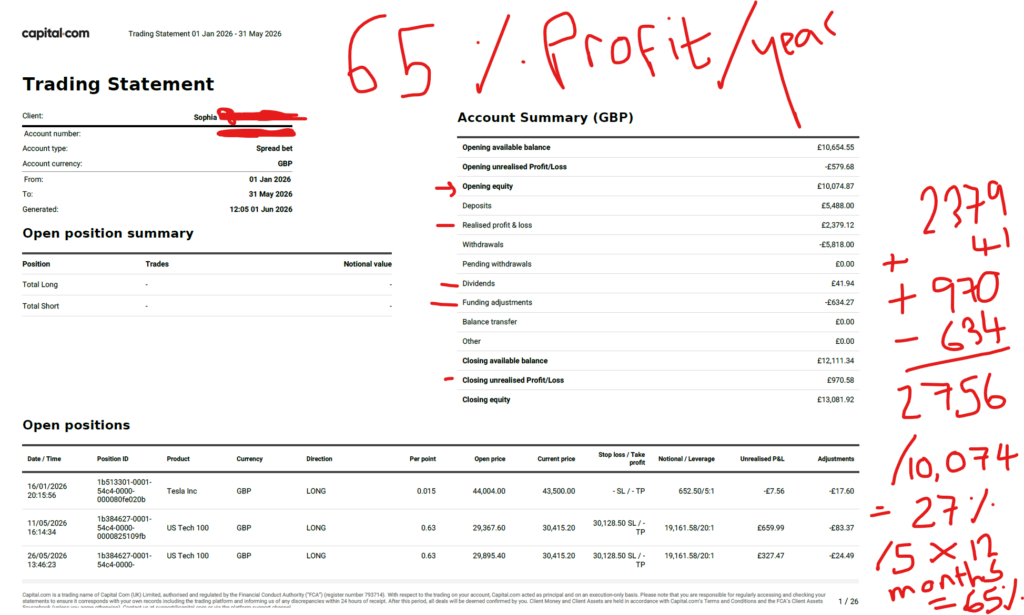
Over the last few months I have been trading the NASDAQ. This resulted in a profit of over £2.7k. When you gross this up for a year i’m on track for a return of 65% for the year. To understand and learn exactly how i’m doing this, you can join me on my Patreon account, linked below.

I hope you found this article on my recent stock market profit, helpful!
Let’s generate wealth independently, together!
Socials:
You Tube:
https://www.youtube.com/channel/UC__AuhOClF8FRudbmT05OKQ
Patreon:
https://www.patreon.com/sophiatrades
To watch me trade live and understand exactly how I make money using my own unique strategy in full, please visit my Patreon page here:
https://www.patreon.com/sophiatrades
Disclaimer!
Nothing on this blog should be taken as financial advice or encouragement for you to enter a trade. You are expected to speak to a financial adviser or carry out your own due diligence before entering any positions. Everything on this blog is made for educational purposes and to equip you with the knowledge you need to be able to make your own financial decisions. I am not regulated by the Financial Conduct Authority.
For more great tips and advice on trading the stock market, please visit:
Sophia Trades – Learn how to Trade the Stock Market
Finally, if you would like to receive a discount on the Trading View charting software I use, please click on the relevant link here:
https://www.tradingview.com/?aff_id=117138
Please note any subscriptions taken via my affiliate link with Trading View may result in me earning a small commission. However, I provide complete transparency on me using Trading View personally – I publish my success on the financial markets via my broker reports and any profits earned were done so by using my own Trading View subscription, so I genuinely do recommend them and have been using the Trading View charts for many years.