Has the NASDAQ pull back ended? Trade now?

Has the NASDAQ pull back ended? In this article i’m going to consider the answer to this. I will talk about some signs which ‘could’ indicate that the NASDAQ may have finished pulling back. As with all my technical analysis you are strongly encouraged to do your own due diligence before placing any trades or investments in the markets. Let’s take a look at whether the NASDAQ pull back has ended.

NASDAQ pull back ended? – Recent movements

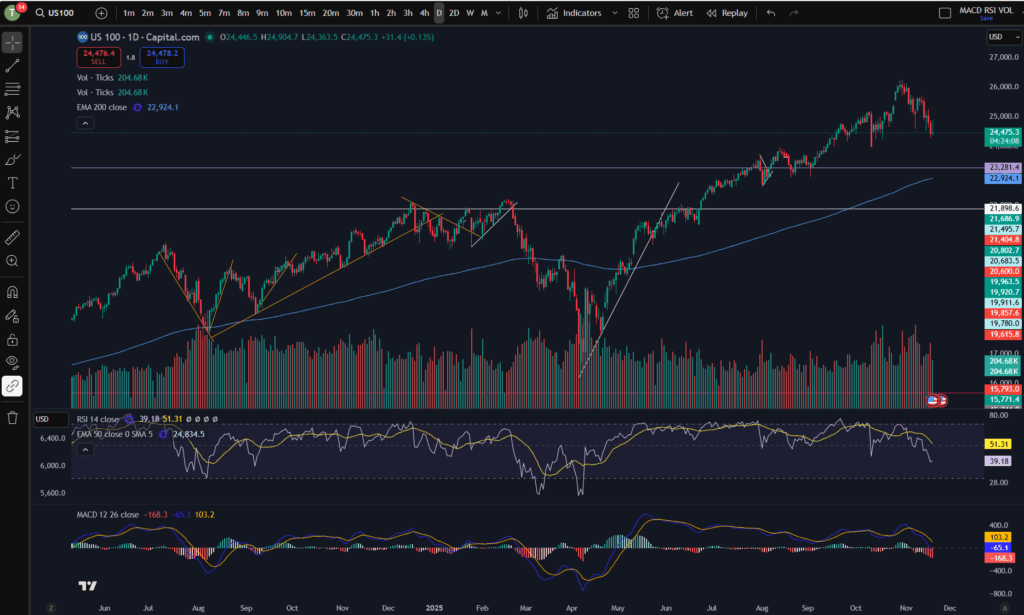
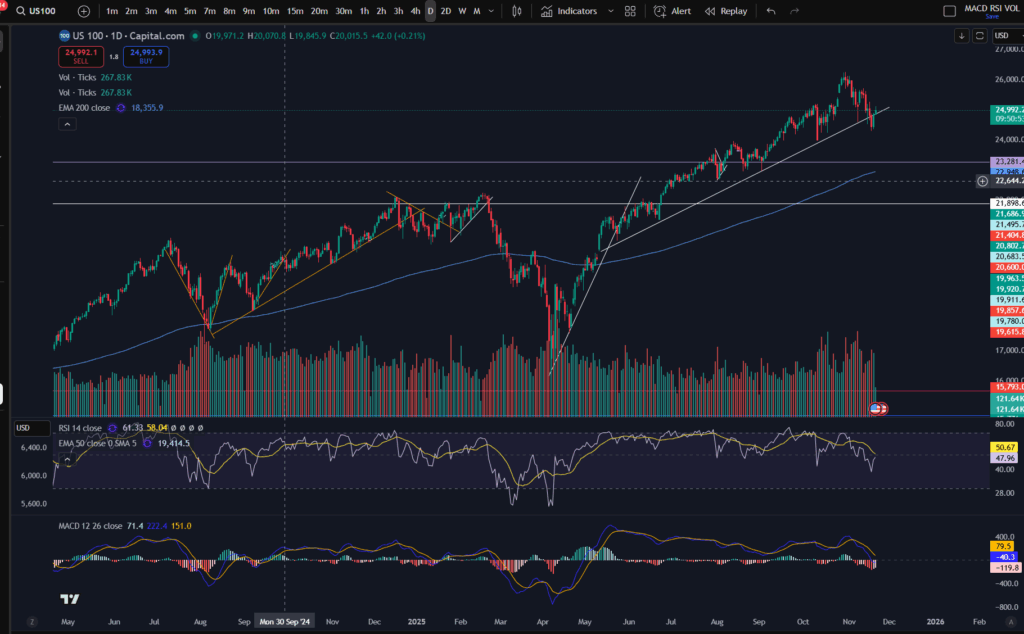
As I mentioned a day or so ago, the markets in general are in a well needed correction phase. They had pulled back quite a bit per the daily timeframe… Let’s take a look at the NASDAQ per the daily timeframe to get a reminder of where it sits currently. This will help us to decide whether the NASDAQ pull back ended…

NASDAQ pull back ended

For a discount to the chart software I use, and highly recommend, please click the link below!

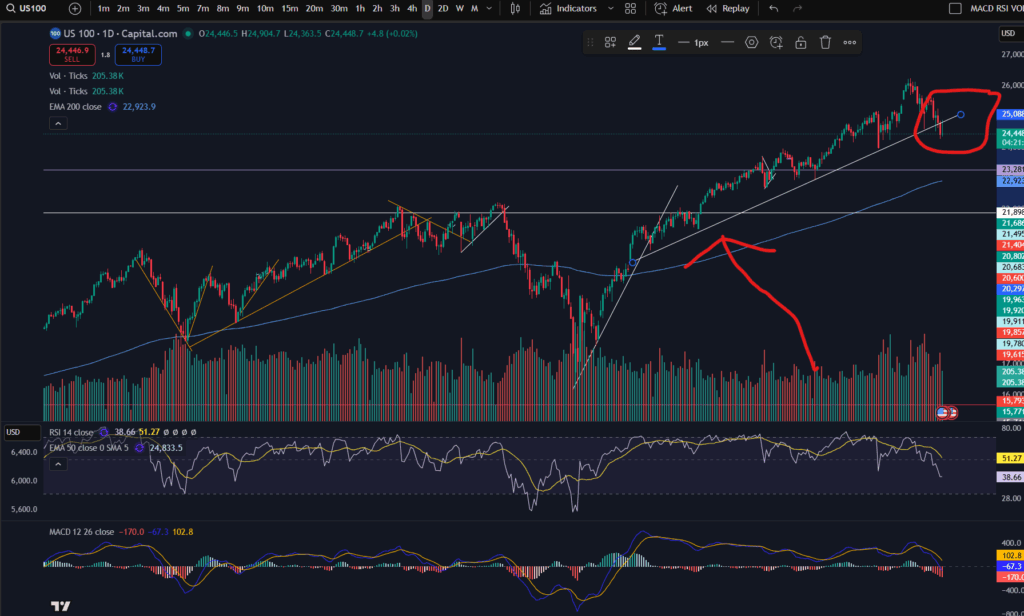
As you can see above, the NASDAQ had pulled back down to just below the diagonal trend line. It seems like it could be bouncing there… Note the MACD histogram is losing it’s pigmentation and shrinking in size, and this can indicate that the move is running out of steam.

Let’s take a look at the 30 minute timeframe.

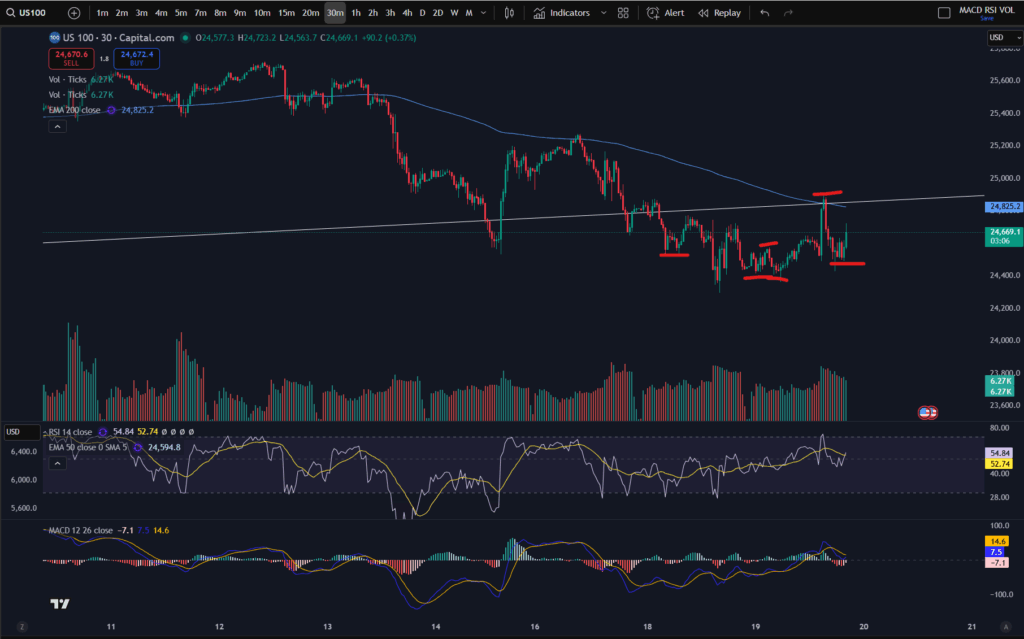
Let’s zoom in with the 30 minute timeframe!

NASDAQ pull back ended

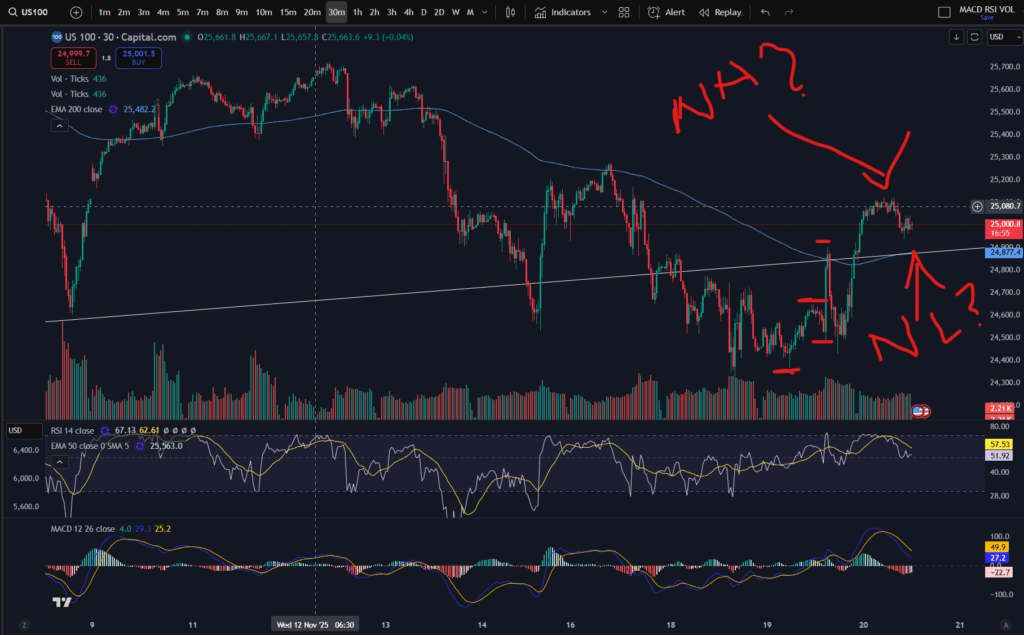
I mentioned a day or so, ago, that the market looked like it was forming new highs and lows after the downward move and this trend seems to have continued. As you can see marked above, it seems to be forming a new high and a new low, but I would want to wait to see another MACD cross over for this high/low to be confirmed. You can see my separate blow article, on how to decide where the highs and lows are, here:

Amazing secrets to help you make more money trading – spot a downtrend early! – Trader Pro

So has the market finished its pull back?

Since the markets were very overbought recently, I would want to see continued highs and lows in this way before I decide that the market has turned around. It does look for now, like it’s trying to recover and push up. I’m conscious the US market is not currently open at the time of writing this, so I will be interested to see what happens at market open today. I am also very conscious that the markets are quite choppy currently and this scenario is a repeat of what happened previously, mid-downtrend – see the section to the left of the 30 minute timeframe chart above, where, in a similar way, the price popped up over the EMA lines and started up trending temporarily, only for it to descend further, subsequently. There is a possibility that this will happen again – I will be watching and waiting.

I hope you found this article helpful.

For more great tips on trading the financial markets, please visit my blog:

https://sophiatrades.co.uk

Discount on Trading View:

https://www.tradingview.com/?aff_id=117138

My performance in the live markets:

https://sophiatrades.co.uk/category/my-performance-statistics

Finally, thank you to my existing members on Patreon, and for your likes, comments and subscribes. Happy trading!

Please note any subscriptions taken via my affiliate link with Trading View may result in me earning a small commission.

Markets are dropping – how to beat them!

Markets are dropping and in this article we take a look at the recent activity on the NASDAQ and possible technical factors which have triggered this. We hope you find this useful.

Markets are dropping – recent NASDAQ activity

The recent activity on the NASDAQ has been extremely bullish… let’s take a look at the monthly chart:

As you can see, the NASDAQ recently reached all time highs. The RSI was very over extended, and the price had been pushing up for a sustained bull run period. It was about time they pulled back! You can see the history of the RSI indicator above. When uptrending, the RSI purple line above, pulls back and forth at the top of the RSI indicator area. Each time the RSI level reaches the highs it had stretched to before, a pull back happened. This time was no different – we were waiting for it! The pull back currently happening feels large, but in reality, it is small in comparison to the amount the markets have pushed up recently.

Markets are dropping – a view from the Daily Time Frame…

Markets are dropping

As you can see from the daily timeframe above, the pull back happening was almost necessary. The price has pulled back down further than the diagonal trend you can see on the bottom of the pattern above – please see this marked below…

You can see above, that the price as bouncing on a nice diagonal support level on the daily time frame, but within the last couple of days, the price has broken this support level.

The RSI has sunk down quite low on the daily timeframe – as you can see above, but the MACD histogram is still showing dark red bars which are growing in size (meaning the downwards move is not yet running out of steam). We could see lower prices still – it remains to be seen whether the price will start recovering or commence a return back up to where it was.

This evening I can see it has started bouncing around on the 30 minute timeframe:

A view from the 30 minute timeframe:

You can see the downtrend on this 30 minute screen shot in more detail… however, note that the price is currently trying to find support… Note the ‘steps’ I have marked on the chart in terms of the highs or lows… the first three marks counting from the left, were confirming that the 30 minute timeframe was still down trending. However, note that the fourth mark created a ‘higher low’ and the next one reached a ‘higher high’… it may be that the market has started to recover – I will be watching it carefully. My next steps will be to look out for solid signs of support and a turn around on the chart. Once I feel comfortable that the price is recovering, I will be more comfortable to place some more trades… for now, I wait….

I hope you found this article and my technical analysis helpful. If you would like to reach out with any trading questions or analysis questions, I would love to hear from you.

For more great tips and advice on trading the stock market, please visit:

https://sophiatrades.co.uk

To watch me trade live please visit my patreon page here:

https://www.patreon.com/Traderpro8320

Finally, if you would like to receive a discount on the Trading View charting software I use, please click on the relevant link here:

https://www.tradingview.com/?aff_id=117138

Please note any subscriptions taken via my affiliate link with Trading View may result in me earning a small commission.  However, I provide complete transparency on me using Trading View personally – I publish my success on the financial markets via my broker reports and any profits earned were done so by using my own Trading View subscription,  so I genuinely do recommend them and have been using the Trading View charts for many years.

How President Trump is affecting the stock market

How President Trump is affecting the stock market

Hi guys! It’s been a while because my trading style has changed over the last few months and I’ve really been trying to figure out what i’m comfortable with. I want to address how President Trump is affecting the stock market. In my opinion, leading up the elections in America and beyond during his time in office, the markets have been extremely erratic. This has affected my win rate when applying my usual strategy. Therefore, I have adjusted my approach. More below!

How President Trump is affecting the stock market – how it’s affected my own trading

During the period leading up to the elections, my usual win rate was not materialising in my own trading style and strategy. I started to understand that President Trump is affecting the stock market. As my followers know, I apply a MACD entry across multiple timeframes and get in at the support per the daily timeframe. During the period leading up to the elections, what I was finding was that the charts were indicating a good buy entry for me, but then shortly after entry, the price would come crashing down. This phenomenon has not ceased during the time that President Trump has been in office, and I have heard many other traders confirming that their own strategies have been affected by him being in office. It seems whenever he opens his mouth, the markets either come crashing down, or they start to shoot upwards. This phenomenon is believed by some to be deliberate!

So what have I done about this in my own trading style?

I have adjusted my style to become more ‘loose’ and manage risk in a slightly different way, so as to avoid the chaos which was ensuing as a result of the way in which President Trump is affecting the stock market. I have stopped using a stop loss. (I do not encourage you to trade without a stop loss unless you really know what you are doing!). I enter minimal position sizes until i’m sure that the market is going in the direction I predicted and I increase my position size as it progresses in the right direction. I make use of very little leverage. I am now moving my stop loss to follow the trend upwards on the daily timeframe. Mostly I am doing this on the indices such as the NASDAQ and the S&P 500. I move my stop up below the previous low of the trend, as the position moves into profit and keep doing this. When the market reaches a peak on the daily timeframe, I am very cautious about getting into larger positions and once they start pulling back, I allow them to stop out against the stop loss which, at that point, is in a position of profit.

I have found being more flexible with my trading style is working well for me and is helping me to avoid erratic swings due to news or announcements. I do not close the small positions I enter when they go against me – I just wait for them to start coming up again.

So to summarise:

  • – I enter small positions until i’m sure of direction;
  • – I do not make use of a lot of leverage – if the markets completely go against me, I am aware that I have enough money in my account to not get a margin call in light of the position sizes i’m trading. Even if the market went down by 50% of its value, I would still not get a margin call!
  • -I enter larger positions as the markets move in my favour;
  • -I enter a stop loss on the chart in a position of profit only (or neutral) and continually move it upwards just beneath the previous low of the trend
  • – Once the price reaches the peak area on the daily timeframe in terms of the previous high, I proceed with caution, and if necesary I allow the positions to trigger my stop loss which will be in profit at that point.

I hope you found this useful – even if it’s just knowing that you are not alone in believe your trading outcomes have changed from the way President Trump is affecting the stock market, since around the time of the elections. Please comment if you have found that his term in office has affected yFor more great tips and advice on trading the stock market, please visit:

https://sophiatrades.co.uk

To watch me trade live please visit my patreon page here:

https://www.patreon.com/Traderpro8320

Finally, if you would like to receive a discount on the Trading View charting software I use, please click on the relevant link here:

https://www.tradingview.com/?aff_id=117138

Please note any subscriptions taken via my affiliate link with Trading View may result in me earning a small commission.  However, I provide complete transparency on me using Trading View personally – I publish my success on the financial markets via my broker reports and any profits earned were done so by using my own Trading View subscription,  so I genuinely do recommend them and have been using the Trading View charts for many years.our trading!