Best stocks to buy now

Best stocks to buy now

In this article i’m going to look at what position the markets are in, with a view to helping you determine the best stocks to buy now. I’m going to examine the position of the overall index and recent highs and lows, and any recent patterns forming. Let’s get straight into it!

Best stocks to buy now – the NASDAQ – recent activity

It helps when considering which are the best stocks to buy now, to look at the overall index first – to see what’s happening there. Reason? Because the overall index has an influence on the prices of its constituents and vice versa. It helps you see clearly, in one big swoop, what’s happening to the markets in general currently. The NASDAQ is the average of the top 100 stocks in America and it is heavily weighted in the Technology sector, with constituents like Apple, Google and Microsoft sitting on it.

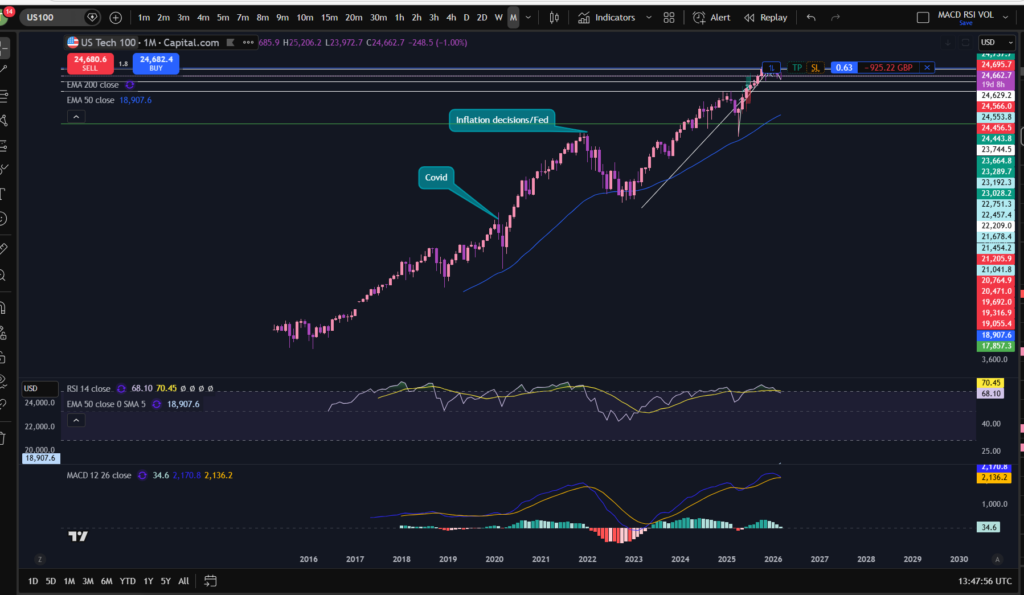
NASDAQ monthly timeframe:

Best stocks to buy now

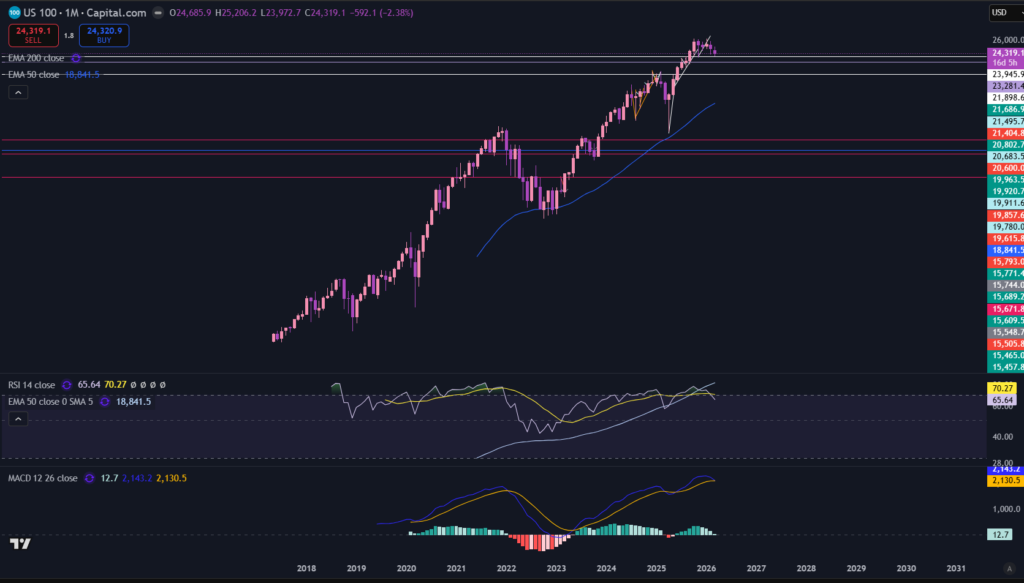
Let’s take a look at the NASDAQ per the monthly timeframe. I’m using the Trading View chart software – click below for a discount:

As you can see on the monthly timeframe, the markets had recently pushed up to new overall highs and they are now pulling back. This is paramount information and consideration before you decide on the best stocks to buy now. The MACD indicator has gone from strong upwards momentum, dark green histogram bars to smaller, reducing in size, light green bars. This pattern is typical before it turns red. You can see where the MACD indicator went red previously on this time frame and what happened to the price. A further downwards push is not guaranteed – nothing is! As traders we are trying to look at patterns on the chart to see what might be possible in the near future. The RSI has pulled back considerably on this time frame. If you would like to understand more about these indicators, please see my blog articles below:

How to use MACD – The Moving Average Convergence Divergence to make more money – Trader Pro – Learn how to Trade the Stock Market

The Relative Strength Index (RSI Indicator) – how to make money – Trader Pro – Learn how to Trade the Stock Market

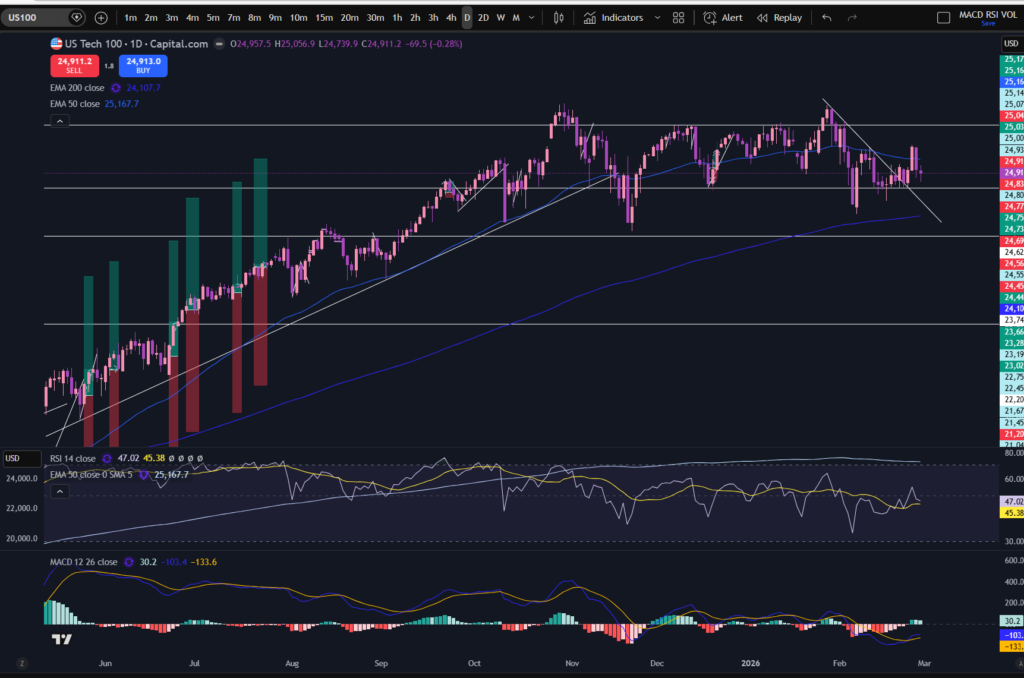
Now let’s take a look at the daily timeframe:

Best stocks to buy now

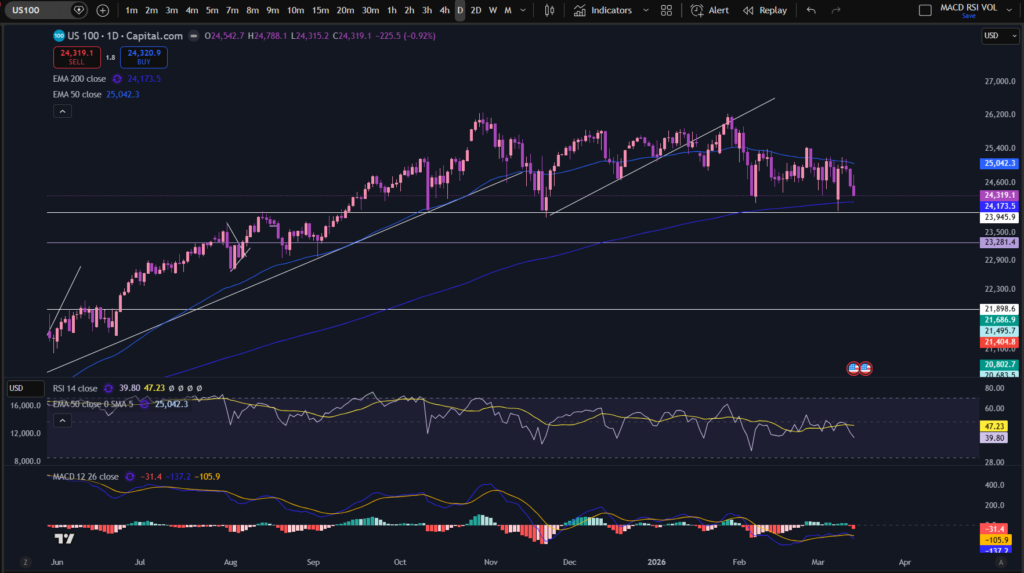
Looking at the daily timeframe, is like zooming in, on the monthly. It shows you a close up of what’s going on. To understand how to use Multiple Timeframe Analysis in your trading, please see the following blog article:

Multiple Timeframe Analysis – mind blowing knowledge that will change everything! – Trader Pro – Learn how to Trade the Stock Market

As you can see on the daily timeframe chart, the price is holding firm above the white support line at around 23,945. It has touched this line quite a few times, tried to push down through it, and then popped back up again. The market is consolidating and going sideways. Often times when a market is bouncing along sideways, it is gaining momentum to either push up strongly or pull back significantly. It is unknown which way it will go. The FEDS dropped interest rates which can help the markets push up further – historically this is what happened after interest rates were reduced. However, the markets are very overbought in general – all the stocks and commodities have reached record highs and it is not clear how long this upwards drive will last! What goes up, must come down – at least slightly!

The last candle which formed, was a large downward candle, taking the price back down close to the support level. To understand more about support and resistance levels, please see this blog article:

Support and Resistance – how to make more money trading – Trader Pro – Learn how to Trade the Stock Market

Let’s just throw in the S&P 500 for good measure!

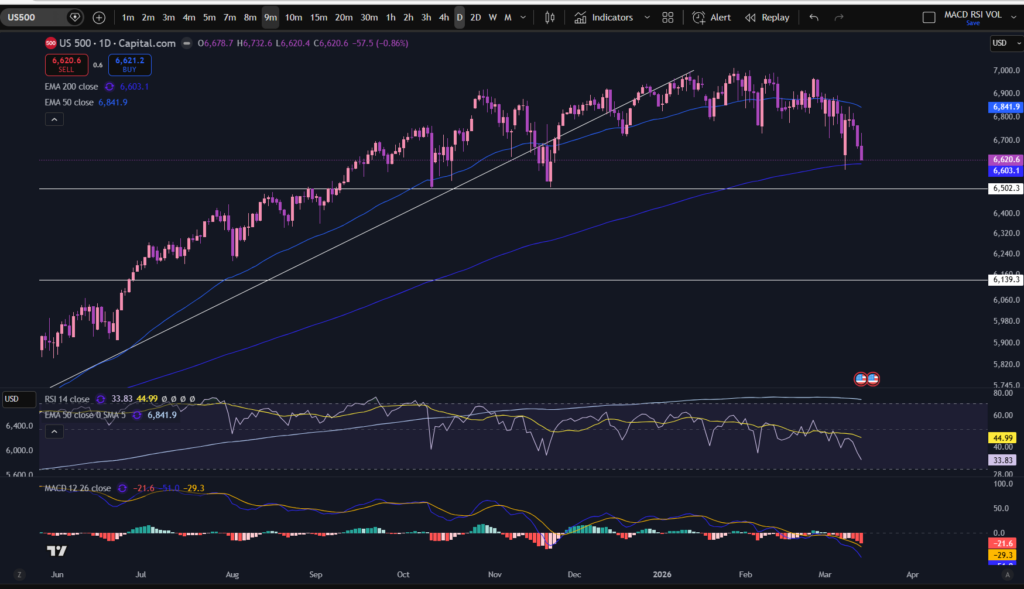
As you can see, we have a similar story on the S&P 500…

From examining these indices, my own decision is to wait before considering the best stocks to buy now. I want to see which direction the markets are headed in, in general, before jumping into anything. There may be markets/stocks sitting on these indices which are still pushing up right now and this is what’s holding it up but i’m conscious of what I stated earlier, that the index has an overall impact on the direction of the stocks, and vice versa. I want the odds to be in my favour when I open more positions. So I will wait to see what happens for a while.

What am I waiting for?

Before I can decide on the best stocks to buy now, I’m waiting for the markets to break out of the sideways channel they are in (i.e. the Index). If they break out upwards, I may consider that a new pattern is starting to form (with reference to new consistent support levels being in a diagonal push up or a new clear horizontal level being established which it is now clearly a new support), and look for good markets / stocks to get into. If they burst downwards I will be waiting even longer – until they start to push up again. For now, I just wait…

He that can have patience can have what he will.” —Benjamin Franklin

Let’s generate wealth, independently, together!

Disclaimer!

Nothing on this blog should be taken as financial advice or encouragement for you to enter a trade.  You are expected to speak to a financial adviser or carry out your own due diligence before entering any positions.  Everything on this blog is made for educational purposes and to equip you with the knowledge you need to be able to make your own financial decisions.

For more great tips and advice on trading the stock market, please visit:

https://sophiatrades.co.uk

To watch me trade live please visit my patreon page here:

https://www.patreon.com/Traderpro8320

Finally, if you would like to receive a discount on the Trading View charting software I use, please click on the relevant link here:

https://www.tradingview.com/?aff_id=117138

Please note any subscriptions taken via my affiliate link with Trading View may result in me earning a small commission.  However, I provide complete transparency on me using Trading View personally – I publish my success on the financial markets via my broker reports and any profits earned were done so by using my own Trading View subscription,  so I genuinely do recommend them and have been using the Trading View charts for many years.

How to invest in stocks – everything you need to know!

How to invest in stocks – everything you need to know!

In this article i’m going to talk about how to invest in stocks to build wealth. I will talk about the types of due diligence you can do before deciding which stocks to invest in, how long you might want to hold them for, how you can hedge your positions and keep a balanced portfolio, and the different avenues through which you can invest in stocks including as regular asset purchases or broker accounts using leverage. Let’s get straight into it!

How to invest in stocks – why invest in stocks in the first place??

Adding stocks to your asset portfolio is a great way to build wealth. They generally increase in value over time and can generate income for you via dividend distributions. Many of the wealthy people you know of, including Warren Buffett, built their wealth by investing in and and accumulating stocks. After a period of time, the stocks gain capital value and they can accumulate to an enormous amount. Most of the pensions are invested in stocks. It is generally how wealth is built. So if you have decided you want to understand how to invest in stocks, what’s the next step? Let’s take a look!

How to invest in stocks – due diligence

OK, so you have decided that you want to built wealth by investing in stocks. What sorts of due diligence should you use, to decide which stocks to invest in? There are different approaches to this. You could keep an extremely balanced portfolio by buying into an ‘index’, or a few indices!. An example of this is the S&P 500 – you can purchase a contract like a share, based on the movements of the S&P 500. If the top 500 stocks in America increase on average, you will see a gain in your trading account. You can also receive dividends from buying into these indices. If you want to remain hedged and balanced in purchasing into indices, you could buy into the indices which are present in different countries, such as the FTSE 100, in the UK, the S&P 500 in the USA, the Nikkei 225 in Japan etc.

If you want to invest in specific stocks based on careful research, you can carry out fundamental analysis based on the company’s key published information which is usually found in the company’s financial statements. If it’s a publicly traded company, you can find the financial statements online. The analysis you can do is to look at the company’s profit statement and balance sheet – to see how healthy they are. If you do not understand how to read a company’s set of financial statements, don’t worry! We have articles prepared by an ex chartered accountant (me) that will help you, below. Navigate with the link below to the Fundamental Analysis part of this blog and you will find lots of helpful articles on understanding a balance sheet, understanding a profit statement, how dividends affect a share price, and more!

Fundamental Analysis – Trader Pro – Learn how to Trade the Stock Market

I am also sharing my videos on understanding a profit statement and balance sheet, here:

Another aspect of understanding a company’s financial position, is to understand whether it is a going concern, and will be for the foreseeable future. Please see my video on things to watch out for in a set of financial statements, here:

Aside from fundamental analysis, you can also undertake technical analysis from looking at the stock charts. I offer lots of guidance on how you can carry out technical analysis on this blog, here:

Structured course – how to trade the stock market – Trader Pro – Learn how to Trade the Stock Market

and you can watch me doing this on my Youtube channel, here:

Trader-Pro – YouTube

Something that can really help you to understand stock charts, is by subscribing to the platform, Trading View. This platform is absolutely amazing for sorting your watchlists and organising your potential opportunities. I can offer a discount to the trading view software. Click the button below for the discount, while it lasts!

I’m showing you below a screen shot of my chart on the NASDAQ – it can be fully annotated with notes about significant events, just as one example of how versatile this chart software is!

How to invest in stocks

I hope this resolved any queries you have on the due diligence aspect of ‘how to invest in stocks’.

How long should you hold stocks for?

OK, so you have decided you want to invest in stocks to generate wealth and you have researched using our tools on fundamental analysis, which stocks or indices to buy. Now you are wondering how long to hold them for. There is no set rule for this, but if you want to generate significant wealth, it is helpful to hold them for ten years or more. Please see my video on the power of compounding, here:

Holding stocks for over ten years can generate significant levels of wealth as they compound in value like a snowball. The answer to how long you should hold them depends on the level of wealth you want to generate. If you want to retire early as a millionaire, which is completely doable, you should hold them for over ten years. The younger you start, the better – ATTENTION, YOUNG READERS!

So how do you actually invest in the stocks?

You can invest in stocks either outright where you own the underlying asset, or you can buy through a CFD or spread betting account. Note the latter two types of accounts will attract fees for holding the positions overnight. There are many brokers that do not charge you for holding positions overnight such as Trading 212 (I have no affiliation with them but I do use them myself for holding long term positions without leverage).

If you hold positions in a spread betting or CFD account you are able to buy more assets than you actually have the cash for! I explain this on my margin blogs and videos, linked below. You will not own the underlying assets in these scenarios, so the dividends will be lower too:

Leverage and Margin – Trader Pro – Learn how to Trade the Stock Market

I hope you found this article helpful on how to invest in stocks. Perhaps if you did, you can leave a comment below. I would love to hear from you, and answer any questions you might have.

How to buy stocks – everything you need to know!

How to buy stocks – everything you need to know!

In this article i’m going to talk about how to buy stocks to build wealth. I will talk about the types of due diligence you can do before deciding which stocks to purchase, how long you might want to hold them for, how you can hedge your positions and keep a balanced portfolio, and the different avenues through which you can buy stocks including as regular asset purchases or broker accounts using leverage. Let’s get straight into it!

How to buy stocks – why buy stocks in the first place??

Adding stocks to your asset portfolio is a great way to build wealth. They generally increase in value over time and can generate income for you via dividend distributions. Many of the wealthy people you know of, including Warren Buffett, built their wealth by buying and accumulating stocks. After a period of time, the stocks gain capital value and they can accumulate to an enormous amount. Most of the pensions are invested in stocks. It is generally how wealth is built. So if you have decided you want to understand how to buy stocks, what’s the next step? Let’s take a look!

How to buy stocks – due diligence

OK, so you have decided that you want to built wealth by purchasing stocks. What sorts of due diligence should you use, to decide which stocks to purchase? There are different approaches to this. You could keep an extremely balanced portfolio by buying into an ‘index’, or a few indices!. An example of this is the S&P 500 – you can purchase a contract like a share, based on the movements of the S&P 500. If the top 500 stocks in America increase on average, you will see a gain in your trading account. You can also receive dividends from buying into these indices. If you want to remain hedged and balanced in purchasing into indices, you could buy into the indices which are present in different countries, such as the FTSE 100, in the UK, the S&P 500 in the USA, the Nikkei 225 in Japan etc.

If you want to purchase specific stocks based on careful research, you can carry out fundamental analysis based on the company’s key published information which is usually found in the company’s financial statements. If it’s a publicly traded company, you can find the financial statements online. The analysis you can do is to look at the company’s profit statement and balance sheet – to see how healthy they are. If you do not understand how to read a company’s set of financial statements, don’t worry! We have articles prepared by an ex chartered accountant (me) that will help you, below. Navigate with the link below to the Fundamental Analysis part of this blog and you will find lots of helpful articles on understanding a balance sheet, understanding a profit statement, how dividends affect a share price, and more!

Fundamental Analysis – Trader Pro – Learn how to Trade the Stock Market

I am also sharing my videos on understanding a profit statement and balance sheet, here:

Another aspect of understanding a company’s financial position, is to understand whether it is a going concern, and will be for the foreseeable future. Please see my video on things to watch out for in a set of financial statements, here:

Aside from fundamental analysis, you can also undertake technical analysis from looking at the stock charts. I offer lots of guidance on how you can carry out technical analysis on this blog, here:

Structured course – how to trade the stock market – Trader Pro – Learn how to Trade the Stock Market

and you can watch me doing this on my Youtube channel, here:

Trader-Pro – YouTube

Something that can really help you to understand stock charts, is by subscribing to the platform, Trading View. This platform is absolutely amazing for sorting your watchlists and organising your potential opportunities. I can offer a discount to the trading view software. Click the button below for the discount, while it lasts!

I’m showing you below a screen shot of my chart on the NASDAQ – it can be fully annotated with notes about significant events, just as one example of how versatile this chart software is!

I hope this resolved any queries you have on the due diligence aspect of ‘how to buy stocks’.

How long should you hold stocks for?

OK, so you have decided you want to buy stocks to generate wealth and you have researched using our tools on fundamental analysis, which stocks or indices to buy. Now you are wondering how long to hold them for. There is no set rule for this, but if you want to generate significant wealth, it is helpful to hold them for ten years or more. Please see my video on the power of compounding, here:

Holding stocks for over ten years can generate significant levels of wealth as they compound in value like a snowball. The answer to how long you should hold them depends on the level of wealth you want to generate. If you want to retire early as a millionaire, which is completely doable, you should hold them for over ten years. The younger you start, the better – ATTENTION, YOUNG READERS!

So how do you actually buy the stocks?

You can buy stocks either outright where you own the underlying asset, or you can buy through a CFD or spread betting account. Note the latter two types of accounts will attract fees for holding the positions overnight. There are many brokers that do not charge you for holding positions overnight such as Trading 212 (I have no affiliation with them but I do use them myself for holding long term positions without leverage).

If you hold positions in a spread betting or CFD account you are able to buy more assets than you actually have the cash for! I explain this on my margin blogs and videos, linked below. You will not own the underlying assets in these scenarios, so the dividends will be lower too:

Leverage and Margin – Trader Pro – Learn how to Trade the Stock Market

I hope you found this article helpful on how to buy stocks. Perhaps if you did, you can leave a comment below. I would love to hear from you, and answer any questions you might have.

Disclaimer!

Nothing on this blog should be taken as financial advice or encouragement for you to enter a trade.  You are expected to speak to a financial adviser or carry out your own due diligence before entering any positions.  Everything on this blog is made for educational purposes and to equip you with the knowledge you need to be able to make your own financial decisions.

For more great tips and advice on trading the stock market, please visit:

https://sophiatrades.co.uk

To watch me trade live please visit my patreon page here:

https://www.patreon.com/Traderpro8320

Finally, if you would like to receive a discount on the Trading View charting software I use, please click on the relevant link here:

https://www.tradingview.com/?aff_id=117138

Please note any subscriptions taken via my affiliate link with Trading View may result in me earning a small commission.  However, I provide complete transparency on me using Trading View personally – I publish my success on the financial markets via my broker reports and any profits earned were done so by using my own Trading View subscription,  so I genuinely do recommend them and have been using the Trading View charts for many years.

How to start trading – everything you need to know!

How to start trading – everything you need to know!

In this article i’m going to explain everything you need to know about how to start trading. I will explain to you how to build a plan, understand the markets and this blog contains a lot of free information about the different tools you can use to help you in your trading. Let’s get started!

How to start trading – the best place to start!

The best place to start in understanding how to start trading, is to ensure you have a broad understanding of the financial markets, and how they work. To get you started with this, i’ve linked below a video I posted for beginner traders, explaining how the markets work and how to read a stock chart:

OK, so now that you understand how markets work and how to read the charts, the next step in understanding how to start trading, is that you must also put together a trading plan. The trading plan article i’ve linked below, is based on ‘technical analysis’ but you may wish to be a trader who focuses on fundamental analysis. I’ve linked below another article examining the difference between these methods of trading:

Fundamental or Technical Analysis – which one makes more money? – Trader Pro – Learn how to Trade the Stock Market

I’m now going to share with you, my key article on how to create a trading plan, but you can tailor this to include parameters based on ‘fundamental analysis’ instead of ‘technical analysis’ in order to suit your preferences. Here is the key article I published, on how to create a trading plan:

How to create a Trading Plan – make big wins trading – Trader Pro – Learn how to Trade the Stock Market

In the trading plan article, I outline they key steps to help you create and execute a trading plan, including risk management, a trading strategy (this is where you decide what method will determine how you will decide to enter each trade), and risk to reward ratio.

Risk management is an extremely important topic and you must understand this and how to use leverage and a margin account, before you commence trading so in light of this, I also recommend you read the articles on this section of the blog:

Risk Management – Trader Pro – Learn how to Trade the Stock Market

In particular, I recommend you read one which outlines how to manage risk, and also, explaining what leverage and margin is:

How to manage risk – make money trading – Trader Pro – Learn how to Trade the Stock Market

Edit Post “What is leverage in trading? Everything you need to know!” ‹ Trader Pro – Learn how to Trade the Stock Market — WordPress

Once you have understood the basics about how the markets work, and you now understand how to create a trading plan and manage it with proper risk management, and you understand how to avoid getting a margin call, you will be in a good place to start trading. You can also see the key technical indicators I recommend, on this blog, by reviewing my ‘chart analysis’ page. This shows you a real trader applying technical analysis to the charts and the idea of this section of the blog is to show you how you can apply this analysis in exercising your own due diligence before entering trades, and build this type of technical knowledge into your own trading plan, and journey.

I would like to wish you the best of luck on your trading journey!

I hope you found this article helpful.

Disclaimer!

Nothing on this blog should be taken as financial advice or encouragement for you to enter a trade.  You are expected to speak to a financial adviser or carry out your own due diligence before entering any positions.  Everything on this blog is made for educational purposes and to equip you with the knowledge you need to be able to make your own financial decisions.

For more great tips and advice on trading the stock market, please visit:

https://sophiatrades.co.uk

To watch me trade live please visit my patreon page here:

https://www.patreon.com/Traderpro8320

Finally, if you would like to receive a discount on the Trading View charting software I use, please click on the relevant link here:

https://www.tradingview.com/?aff_id=117138

Please note any subscriptions taken via my affiliate link with Trading View may result in me earning a small commission.  However, I provide complete transparency on me using Trading View personally – I publish my success on the financial markets via my broker reports and any profits earned were done so by using my own Trading View subscription,  so I genuinely do recommend them and have been using the Trading View charts for many years.

What is leverage in trading?  Everything you need to know!

What is leverage in trading? Everything you need to know!

In this article i’m going to answer the question, ‘what is leverage in trading?’. The answer to this question is something you absolutely must become familiar with if you are to become successful as a stock market trader. I will explain to you about the different types of leverage and how you can check the details so that you know exactly what you are dealing with in your broker account.

What is leverage in trading? Let’s start with the basics!

The best way I can describe leverage to you is for you to think about it as a loan for a large portion of a pie. Imagine that the asset you want to purchase, is divided up into pie pieces:

In a broker account with leverage, the broker will ask you to put down, as a deposit, maybe, one slice of pie – this is known as the margin. Why ‘margin’? Think of the margin as a small portion of a page – like the margin on a page. The rest of the pie will be funded by a loan (leverage). What is the point of this? It means when you use a leverage account, you can get into larger position sizes (purchase larger assets) than you would otherwise have been able to afford with your cash in the account.

To fully understand the answer to the question, ‘What is leverage’, you must also understand how much leverage is given by the broker

The amount of leverage (the proportions of the pie funded by a loan vs your own cash), will depend on the type of asset in question, and the broker account. I have set out the typical scenarios below:

Equities

Typically, equities (shares) attract leverage of 4/5 meaning 4 portions of the pie will be funded by the broker as a loan, and 1 portion of the pie will be funded by your cash. (1:5 ratio/20%).

Commodities

Commodities, such as oil, gas, coffee, orange juice etc, will typically attract leverage of 9/10ths of the position size, meaning you put down 10% as your cash deposit, and the broker funds the other 90%.

Indices

On indices you can obtain the most leverage. These instruments can typically allow you to borrow 19/20ths of the asset value with leverage and 1/20th will be funded by your cash.

How can you tell or check what the leverage is, on an asset, before you trade it? If you click on the asset ‘details’ within your broker account, it will say something like 20:1 (for an index) or 5:1 for an equity. Meaning, for every 1 you put in yourself on an equity trade, the broker will fund the other ‘4’.

What are the benefits and drawbacks of using leverage?

The basic benefit is that you can open larger positions so if you are a profitable trader you will make more profit. The downside is that the broker will charge you fees, like interest, for taking the loan in the form of leverage. These are seen in your account as overnight funding adjustments. The broker often charges you if you hold the leveraged positions overnight.

What is leverage in trading: How the leverage is managed in a broker account

On entry into a buy position, the broker will check that you have enough money to cover your deposit (margin). This deposit money will be ring fenced while you are in the trade. The broker typically shows you the amount of margin being used on open positions, and the amount of buying power you have (which is equal to the cash in the account, plus the profit or loss on any open positions, less the margin being used). The rest of the position you purchase will be on a loan.

Important information you MUST KNOW to complete your understanding of ‘what is leverage in trading’

NOTE! – AND THIS IS VERY IMPORTANT! Before you complete your understanding of what is leverage in trading, you must know this. The amount of loss you can take, when trading with a margin/leverage account, can be more than the cash in your account. HOW? I will explain below with an extreme scenario so you get the point.

Imagine you enter a position where the price of the asset is £5,000 for one share, and it’s a share/equity.

ENTRY: £5000 X 2 portions = £10,000 value of trade.

Margin/deposit required: £2,000 – the instrument is an equity so as above, 1/5th of the value of the trade is set aside for margin/deposit.

Cash in account at entry: £2,100.

Price movement: The price goes against you, and each share is now worth £1,000.

Now your open position is worth £2,000. £1,000 x two shares = £2,000.

You have lost on the trade, £10,000 (value at entry) – £2,000 (current value) = £8,000 LOSS.

Your cash level at entry, was only £2,100 – so you have now lost more money than the level of cash you had in the account at the outset.

This is why trading with margin is very dangerous unless you know and fully understand how it works. Don’t worry – this article will help you!

The reality is that you would have got a ‘margin call’, from the broker, asking you to fund the account at the point where you are going into a position where you do not have enough funds to cover the margin. (The broker will deduct/ringfence your loss from the available funds so in the scenario above, the cash in the account was depleted by the loss on the trade). You see, while the position is open, the margin and leverage is moving around, in accordance with the latest share price, compared to your entry point.

If you find it easier to hear and see a video on this, I also published a video on my YouTube channel, here:

I hope you found this article helpful, in understanding the answer to the question, what is leverage in trading. Perhaps if you did, you can leave a comment below?

Disclaimer!

Nothing on this blog should be taken as financial advice or encouragement for you to enter a trade.  You are expected to speak to a financial adviser or carry out your own due diligence before entering any positions.  Everything on this blog is made for educational purposes and to equip you with the knowledge you need to be able to make your own financial decisions.

For more great tips and advice on trading the stock market, please visit:

https://sophiatrades.co.uk

To watch me trade live please visit my patreon page here:

https://www.patreon.com/Traderpro8320

Finally, if you would like to receive a discount on the Trading View charting software I use, please click on the relevant link here:

https://www.tradingview.com/?aff_id=117138

Please note any subscriptions taken via my affiliate link with Trading View may result in me earning a small commission.  However, I provide complete transparency on me using Trading View personally – I publish my success on the financial markets via my broker reports and any profits earned were done so by using my own Trading View subscription,  so I genuinely do recommend them and have been using the Trading View charts for many years.

What is trading?  Everything you need to know…

What is trading? Everything you need to know…

I want to help beginner traders understand and answer the question, ‘what is trading’. I’m going to explain what trading is in this article, the difference between trading and investing, what types of returns you should expect from trading and how you can get started. Let’s get straight into it.

What is trading? Some basics…

Trading is the buying and selling of equities (shares), commodities, metals, contracts or other types of assets on an exchange. For every buyer, there is a corresponding seller and these buy and sell actions, drive the price and volume in any market. The idea with trading, is that you buy and sell at favorable points on a chart (or based on fundamental data), and the buy and sell happens more quickly typically, when compared to what an investor does. An investor typically buys assets over and over and holds them until they increase in value by a large amount, over a long period of time. Traders can be day traders – people who get in and out of trades within one day, or swing traders – where trades can span over the course of a couple of days or more. I’ve provided a link below to help you understand ‘fundamentals’. Fundamental analysis is the method of inspecting financial statements to try and ascertain the value of a share with a view to buying it low and selling it high!

Fundamental Analysis – Trader Pro – Learn how to Trade the Stock Market

I am also providing you with a link to a structured course which can help you understand how traders decide where to buy or sell based on ‘technical analysis’. Technical analysis is purely based on the patterns forming on a chart (which stem from events and real world scenarios – the patterns can form based on what real people think a share is worth for example):

Learn to trade – Trader Pro – Learn how to Trade the Stock Market

See also the chart analysis section of this blog, here, where you can see me doing this analysis and explaining my thoughts:

Chart analysis – Trader Pro – Learn how to Trade the Stock Market

What types of returns can you make from trading the stock market?

Traders can make 100% return on their capital, in a year. The reality is that different traders make different amounts – but if you are trading, rather than investing, you definitely want to be making more than a regular investment return. You are taking more risk than what you take with investing money in a more straight forward way as an investor, so risk normally goes hand in hand with return (or it should).

So how do these transactions take place?

We cannot answer the question ‘what is trading’ without considering how these transactions come about. Most transactions take place online these days. You can open a broker account to either buy shares and own the shares or you can open a position based on the movement in the price and enter into a ‘contract for difference’. This is where you enter into a contract with the other party, to agree that if the price goes the way you think it will, the other party will pay you xzy amount of money and vice versa. If the price goes against you, you will need to pay them. The other way of trading is via a ‘spread betting’ account. This is like placing a bet on the price movements of the underlying asset and for most intents and purposes, it is treated and seen, as gambling. There are different tax implications for these three different methods of trading, and broker accounts can be opened online to go with any method you believe is right for you.

What else do you need to know when understanding the answer to the question, ‘what is trading’

Some of the types of broker accounts which can be opened (contracts for difference (“CFD”) accounts, and spread betting accounts) include leverage. Leverage is a loan which is offered by the broker to allow you to get into a larger position size than you may otherwise have been able to do. You put a deposit down on the open position, and these accounts are dangerous for a new trader because you can lose more than you put into your account! You should not trade with a margin/leverage account until you have a good understanding of this and how leverage and margin work. There are other articles on this blog explaining how you can manage your risk as a trader, which you may find helpful, as well as explaining margin and leverage:

Risk Management – Trader Pro – Learn how to Trade the Stock Market

I also published a video on YouTube which you may find helpful, on understanding how you can manage risk as a stock market trader:

I’ve also posted a video on YouTube explaining what margin is:

This introductory video on understanding the stock market, may be helpful for people who are new to the markets:

So now you understand the answer to the question, ‘what is trading’, how can you get started?

The best place to start would be by viewing my ‘Structured Course’ playlist on YouTube – which gives you some of the key lessons on how to become a stock market trader (below), and also refer to my blog article here, on how to create a trading plan:

Edit Post “How to create a Trading Plan – make big wins trading” ‹ Trader Pro – Learn how to Trade the Stock Market — WordPress

I also recommend you browse the other ‘structured course’ articles on this blog which take you through technical indicators, risk management, understanding the spread and many other things, here:

Structured course – how to trade the stock market – Trader Pro – Learn how to Trade the Stock Market – Page 3

Trader-Pro – YouTube

what is trading

I hope you found this article on ‘what is trading’ helpful. Perhaps if you did, you can leave a comment below.

Disclaimer!

Nothing on this blog should be taken as financial advice or encouragement for you to enter a trade.  You are expected to speak to a financial adviser or carry out your own due diligence before entering any positions.  Everything on this blog is made for educational purposes and to equip you with the knowledge you need to be able to make your own financial decisions.

For more great tips and advice on trading the stock market, please visit:

https://sophiatrades.co.uk

To watch me trade live please visit my patreon page here:

https://www.patreon.com/Traderpro8320

Finally, if you would like to receive a discount on the Trading View charting software I use, please click on the relevant link here:

https://www.tradingview.com/?aff_id=117138

Please note any subscriptions taken via my affiliate link with Trading View may result in me earning a small commission.  However, I provide complete transparency on me using Trading View personally – I publish my success on the financial markets via my broker reports and any profits earned were done so by using my own Trading View subscription,  so I genuinely do recommend them and have been using the Trading View charts for many years.

How to avoid pitfalls in trading with young children around

How to avoid pitfalls in trading with young children around

In this article i’m going to talk about how you can avoid pitfalls in trading with young children around you as a woman, when trading the stock market. I’m going to talk about practical tips you can apply in your trading right now, to avoid some of the things which can go wrong and cause stress. Let’s get straight into it!

First of all, let’s talk about what can go wrong in trading with young children around you

Wow – where do I begin? Here are a few examples:

Example 1 – You miss your target: you are in a trade and it’s going to go up to your target area, so you are keeping a bit of an eye on it while your toddler is eating their lunch. Sometimes trading with young children around you is unavoidable depending on the needs of the child and what’s happening with your trade set up and the market. Toddler drops lunch on the floor (along with the beaker, the rattle, the baby wipe and anything else within reach which has ended up on the floor in the preceding ten minutes). Crying ensues, stress in mommy ensues – “what am I going to feed them now – i’ve just made that lunch and it’s gone”. Trade goes near the target but mommy is focused on clearing up the spaghetti on the floor. Trade failed – it went back down to below target level and then into loss position by the time mommy realised what’s happened.

Example 2 – You forget to add a stop loss: You’re baby is asleep while you are planning and trying to execute your trade set up and entry point. You enter a buy position and just before you can set your take profit and stop loss, baby wakes up and is screaming for milk – it needs it NOW. You rush over to bubba to console them while you try and get a bottle ready and in the meantime, you have forgotten about adding your stop loss. Trade goes against you while you are heating up the baby’s milk and you end up in the red, to a level which is two times the size of the loss which would have happened, had you set your stop.

These are two examples of a multitude of things which could happen while you are keeping an eye on trades, while simultaneously looking after your baby or toddler. If you are a man or non caregiver of young children, I do not expect you to understand this. This is something which mothers contend with every day – it maybe that they are trying to do something else besides trade, quickly before their baby wakes up – there are many things which a woman could need to deal with while looking after small children, and the children are not interested in anyone else’s schedule, but their own. This is the biological reason why women ended up better at multi tasking.

OK, so we know these things can go wrong. What can you do about it as a trader to protect your account and your confidence?

The first recommendation I can make is for you to trade higher timeframes. The timeframes which should be avoided are the 5, 10, 15 minute time frames. Maybe even the 30 minute time frame. Why? The higher the timeframe you use, the more time you will have to execute your entries and exits and plan your trades. The price moves more slowly on the higher timeframe. It will give you time to sort your baby out, give him/her a bottle, adjust your target or add one automatically.

Another suggestion is to do your research at times when you know baby will be sleeping – the tasks which could have an interruption and not go wrong – like choosing which market to enter from the really high time frames like the daily, the weekly, and you can do this while your baby is sleeping in the evening but tend to him/her if he/she wakes up.

My recommendation would be to not trade without a stop loss or take profit being automatically set on your trades. You can do some analysis of what actually happened with the price movements (whether you made an error, why it went down instead of going up as you had planned etc) at a convenient time, as long as your position is automatically protected from going wrong.

I hope you found this article helpful in deciding how you can avoid pitfalls when trading with young children around you. I also published a video on my YouTube channel, on avoiding pitfalls when trading with young children- which you may find helpful:

Disclaimer!

Nothing on this blog should be taken as financial advice or encouragement for you to enter a trade.  You are expected to speak to a financial adviser or carry out your own due diligence before entering any positions.  Everything on this blog is made for educational purposes and to equip you with the knowledge you need to be able to make your own financial decisions.

For more great tips and advice on trading the stock market, please visit:

https://sophiatrades.co.uk

To watch me trade live please visit my patreon page here:

https://www.patreon.com/Traderpro8320

Finally, if you would like to receive a discount on the Trading View charting software I use, please click on the relevant link here:

https://www.tradingview.com/?aff_id=117138

Please note any subscriptions taken via my affiliate link with Trading View may result in me earning a small commission.  However, I provide complete transparency on me using Trading View personally – I publish my success on the financial markets via my broker reports and any profits earned were done so by using my own Trading View subscription,  so I genuinely do recommend them and have been using the Trading View charts for many years.

Can you make money on the NASDAQ right now?

Can you make money on the NASDAQ right now?

In this article i’m going to talk about the current and recent positions of the NASDAQ with a view to answering the question ‘can you make money on the NASDAQ right now?’. I’m going to examine the recent highs and lows and what’s happening with some of my preferred indicators. Let’s jump straight into it!

Can you make money on the NASDAQ right now – recent activity

The NASDAQ is currently going sideways. It has been doing this for a long time. What does this mean? Markets can either go up, down or sideways, and sometimes they go sideways to consolidate – to allow breathing before pushing higher, or to test limits and supports before they lose strength and pull right back. You should think of a sideways market as a battery charging…. it’s building momentum to either go up, or down. When they go sideways for a long while, it can give the market a breathing space which is equivalent to the market pulling down/back – because time is passing by and the market is not reaching high prices. It allows the momentum to reset itself and you can see this on some of the indicators I like to use, like the RSI and the MACD. To help us answer the question about whether we can make money on the NASDAQ right now, let’s take a look at the daily time frame chart:

money on the nasdaq

As you can see, the market reached an all time high in mid October and since then it’s been drifting through a channel sideways. It did touch the previous high in February but since then it descended further. You can see the diagonal down trend line I had recently applied to the chart, which the price has now bust through! The price is now back at the horizontal support again and it’s bounced away from it with a hammer candlestick pattern. If you would like to understand more about candlestick patterns, please see the relevant section of my blog, below:

Japanese Candlesticks – Trader Pro – Learn how to Trade the Stock Market

The MACD made a cross over to the upside, below the zero level of the histogram and this can be recognised as an upward push momentum but it remains to be seen how long it will last. This is the zone where the price bust through the diagonal resistance line above. In order to answer the question more fully, ‘can you make money on the NASDAQ right now’ we need to also consider the higher time frame for a birds eye view. Note: I am not in the habit of always considering the monthly timeframe – it depends. On this occasion I consider it is necessary, since the price has gone sky high recently so it may be coming to the end of a long term upwards push.

Let’s also take a look at the bigger picture – the monthly timeframe

As you can see on the monthly time frame, the MACD indicator is losing momentum for upwards push – the histogram bars have gone from dark to light green and they are becoming smaller and smaller. The MACD and signal lines look like they are in a position where they could cross over to the downside. However, note that in the time the market has been going sideways, the RSI indicator has pulled back slightly meaning the price is not as expensive as it was at the peak and this is what I meant by a sideways movement allowing the price to recharge and gain energy. You can see from historical RSI movements on this chart, that the little dip which has happened recently on the RSI indicator, can sometimes be enough of a pull back for it to go up again. It is not clear what will happen next – I am simply waiting for confirmation. What do I mean by this? I’m waiting for the market to make higher highs and higher lows again. Going back to the daily timeframe, I have marked in red the recent highs and lows. At the moment the market is in a position where it is moving away from a ‘lower low’ so definitely not pushing up enough for me yet… and so I wait!

I hope you found this article helpful in answering your question, can you make money on the NASDAQ right now?

Disclaimer!

Nothing on this blog should be taken as financial advice or encouragement for you to enter a trade.  You are expected to speak to a financial adviser or carry out your own due diligence before entering any positions.  Everything on this blog is made for educational purposes and to equip you with the knowledge you need to be able to make your own financial decisions.

For more great tips and advice on trading the stock market, please visit:

https://sophiatrades.co.uk

To watch me trade live please visit my patreon page here:

https://www.patreon.com/Traderpro8320

Finally, if you would like to receive a discount on the Trading View charting software I use, please click on the relevant link here:

https://www.tradingview.com/?aff_id=117138

Please note any subscriptions taken via my affiliate link with Trading View may result in me earning a small commission.  However, I provide complete transparency on me using Trading View personally – I publish my success on the financial markets via my broker reports and any profits earned were done so by using my own Trading View subscription,  so I genuinely do recommend them and have been using the Trading View charts for many years.

What makes more money – paying off debt or investing?

What makes more money – paying off debt or investing?

This is a really interesting question and it’s one people can get wrong and end up wasting precious time with unless they know how to answer it for their own situation. Mostly the answer re whether you should be paying off debt or investing, comes down to the interest or earnings rates in question but there are some important other considerations, and I would like to demonstrate to you, how profound the impact of this decision can be – either in a good, or bad way!! Perhaps you want to create your dream life with supercars and a peacefulness of knowing that everything is taken care of… I hope this article will be a help in you getting there…Let’s jump straight into it…

So should you be paying off debt or investing? It’s all about the rate… – well… mostly!

Let’s say you have a loan worth £10k and the interest rate on this loan is about 6%. If you are considering paying off this loan instead of investing your money in the stock market, my suggestion is that you don’t! There are a couple of caveats which I will go into below, but on the face of it, it would not be wise to clear down the loan. I started my career as a chartered accountant and many thinks make sense to me in terms of what the numbers are saying… so let’s take a look…

Imagine the scenario where the loan is not getting cleared in terms of capital repayment (so the worst scenario for the loan) and it’s at a rate of 6% interest. Let’s also suppose that this loan will continue to incur interest for the next 20 years. I’ve put these details into the Compound Interest Calculator – here’s a link:

Compound Interest Calculator – Daily, Monthly, Yearly Compounding

I absolutely love playing around with this calculator because it’s like a crystal ball which tells me how rich I will be in the next 10 to 20 years.

paying off debt or investing

OK, so we said a loan of £8k at a rate of 6% with no capital repayments. As you can see above, after a 20 year period, the amount of interest paid relative to the loan appears to be colossal… this is not insignificant in your decision about whether you should be paying off debt or investing, but I wonder whether it will look so big when we compare it to the scenario where instead of clearing down the capital of this loan, the £8k is instead, used to invest in the stock market…

Let’s run the calculator again:

OK, so as you can see I added exactly the same details but just changed the rate. The rate of 15% is not unreasonable in terms of the rate which can be achieved on the stock market, especially when investing in something like the NASDAQ or the S&P 500 – I put the question into Google for you and this is what it answered:

So if you chose instead to invest your money in the stock market as opposed to clearing the loan, you would end up £157,723 – £26,481 = £131,242 better off. You could use some of the investment to clear the loan at that stage but even then!! My suggestion would be to let the investments earn money to ‘slowly pay off’ the loan in instalments! While it’s doing that, the investments are growing still! The answer is infinite when there is a difference in rate, in your favor! I hope this has given you some more clarity on the question of whether you should be paying off debts or investing.

Now, we must acknowledge here, that if you have high interest debts it is better to clear them – because the rate on the debt will be higher.

If you have very low interest debts they lend more weight to the idea of not clearing them and instead, investing the money.

Caveat: I am not a financial adviser – you should consult one before doing anything if you are unsure.

A caveat for you!

OK, so I said there would be a caveat and it’s this: if you are paying off debts, even where they are on a lower rate of interest and you would get a better return on the stock market, it may still be necessary to clear them a bit first – in the scenario where our outgoings are far too high and you are struggling to make ends meet. If finances are a struggle in general and the loan feels like a noose around your neck, it may be good to clear it first. However, just know, once you get to the comfortable stage, if the loan rate of interest is lower than what you can get on the stock market, you would do well to think ‘long term’ and invest the money.

Some inspiration for you- what can you achieve by investing more?

I wanted to share with you some more examples of how much your money could grow over a 10 to 20 year period, especially for someone who is young, but for older people, it’s never too late, and I did write another article on this which is linked below.

OK, so same calculation again but this time with a higher starting balance and a monthly contribution of £600. This would literally make you a millionaire after 20 years. I know £600 per month is very difficult for some families – especially in the UK but it would still be best to invest as much as you are able. Perhaps you are younger – 18? You could take slightly longer and just put money away more slowly! This is why I like to play around with the calculator.

As promised, here is the video I published about becoming a guaranteed millionaire:

Disclaimer!

Nothing on this blog should be taken as financial advice or encouragement for you to enter a trade.  You are expected to speak to a financial adviser or carry out your own due diligence before entering any positions.  Everything on this blog is made for educational purposes and to equip you with the knowledge you need to be able to make your own financial decisions.

For more great tips and advice on trading the stock market, please visit:

https://sophiatrades.co.uk

To watch me trade live please visit my patreon page here:

https://www.patreon.com/Traderpro8320

Finally, if you would like to receive a discount on the Trading View charting software I use, please click on the relevant link here:

https://www.tradingview.com/?aff_id=117138

Please note any subscriptions taken via my affiliate link with Trading View may result in me earning a small commission.  However, I provide complete transparency on me using Trading View personally – I publish my success on the financial markets via my broker reports and any profits earned were done so by using my own Trading View subscription,  so I genuinely do recommend them and have been using the Trading View charts for many years.

How does a dividend affect a share price?  Everything you need to know!

How does a dividend affect a share price? Everything you need to know!

How does a dividend affect a share price? This is an important topic for any trader and definitely something you should be considering before placing any trade – both in general and in relation to the timing of the specific stock you are interested in trading. I’m going to talk about what a dividend is, how this affects the price of a stock and how you can prepare for these fluctuations as a trader.

We want to answer, “How can a dividend affect a share price”, but first of all, what is a ‘dividend’?

So…. back to companies 101…. we know that a company is a business (or it can be an investment vehicle) in a legal entity ‘wrapper’. It is treated as a separate person entirely, from the business owner(s). The business is split into portions like dividing up a pie and these portions are the ‘shareholdings’ of the company. So the people who own the business are the ‘shareholders’ and they each own a piece of the company in accordance with their share holding and certificate, like a slice of pie. A dividend is a mechanism by which, the business pays out some profit to its shareholders.

So how do dividends come about?

In order to determine an answer to the question, how does a dividend affect a share price, we must first also understand how dividends come about! Any assets or income belongs to the legal entity of the business and is received within the legal entity. In order to distribute some of this income to the owners of the business (the shareholders), a ‘dividend’ must be declared and paid. The business will declare a dividend from ‘distributable profits’ only. If they do not ensure the dividend is made from ‘distributable profits’ it is possible the dividend will be made illegally. This is a slightly different topic but the directors basically need to ensure that the business has got enough cash and spare money before paying the shareholders a dividend, to make sure it is being fair to its creditors. The worst case scenario which could occur is that the company could pay a dividend and it depletes funds needed to pay creditor liabilities – this is why they must be paid from ‘distributable’ reserves. This is a slight digression, but it was worth noting here for anyone who does not know much about companies and how they work.

OK, so back to where we were… the directors of the company will assess whether the company is in a position to pay a dividend, and they will ‘declare’ it / in other words, they will announce to the market, that they have decided a dividend will be paid. This is the ‘ex dividend’ date – which is important. The cash payment of the dividend will follow a little while later and will be paid to the share holders in accordance with their slice of pie share holding. So if the company is divided up into 10 slices of pie (shareholdings) and they are all equal shareholdings, and the company declares a dividend of £800, what this means is that each slice of the pie shareholding will receive £80 as a dividend.

Are dividends mandatory?

No – dividends are not a mandatory thing on the part of the directors. They need the freedom and discretion to be able to examine the company’s financial position, prior to making any dividend declaration, and consider whether the company can afford to make a dividend from its distributable reserves.

Not only this, but some companies do not usually pay dividends and other ones do. It is entirely in the discretion of the directors and they are usually following the particular customs of the company in question. If a company usually pays a 1% dividend to shareholders, the shareholders would be in a position where they are accustomed to receiving this, and they would expect it. Indeed, it may be the reason they purchased those shares – some shareholders just purchase shares for the purposes of receiving dividends, and some shares pay more dividends, and pay more ‘often’ than others – so if the investor is someone who is interested in receiving dividends as income rather than more capital growth from his/her shareholdings, they may tailor their investment portfolio to the companies which pay dividends regularly and at a good rate. Notwithstanding this, the discretion of the directors must always be applied to ensure the dividends are not made illegally (from non distributable reserves – depleting funds for the creditors).

So how does a dividend affect a share price then?

So when a company makes a dividend, this dividend is in effect, the company paying out some of it’s earned profits to the shareholders. The company’s worth (share price) is based on it’s assets and earnings potential – it’s an estimate by the market based on supply and demand, of what people think that is worth! So when the company pays out some of it’s worth as a dividend, it is literally depleting the balance sheet of reserves and profit/cash – which could be used to buffer the company from any troubles, buy more assets, grow the business etc. I’m not saying paying a dividend is a bad thing but it ‘must’ affect the share price – logically, it will.

So when the stock goes ‘ex dividend’ (when the dividend announcement has been made), you can expect the stock to take a temporary nose dive in terms of the share price.

How can you plan your trades around this?

Make sure before you open a position on an equity, that you know what the next ex dividend date is, and be prepared in the plan of where to enter and exit, for the drop in share price when the stock goes ex dividend. If you are confident that there will be no significant impact from the question, how does a dividend affect a share price that’s fine… but it could affect your win rate if you ignore this and get in anyway!

I hope you found this article informative on resolving the question, how does a dividend affect a share price. Perhaps if you did, you can leave a comment below!

Disclaimer!

Nothing on this blog should be taken as financial advice or encouragement for you to enter a trade.  You are expected to speak to a financial adviser or carry out your own due diligence before entering any positions.  Everything on this blog is made for educational purposes and to equip you with the knowledge you need to be able to make your own financial decisions.

For more great tips and advice on trading the stock market, please visit:

https://sophiatrades.co.uk

To watch me trade live please visit my patreon page here:

https://www.patreon.com/Traderpro8320

Finally, if you would like to receive a discount on the Trading View charting software I use, please click on the relevant link here:

https://www.tradingview.com/?aff_id=117138

Please note any subscriptions taken via my affiliate link with Trading View may result in me earning a small commission.  However, I provide complete transparency on me using Trading View personally – I publish my success on the financial markets via my broker reports and any profits earned were done so by using my own Trading View subscription,  so I genuinely do recommend them and have been using the Trading View charts for many years.