In this article i’m going to talk about stocks today – what’s happening on the S&P 500 and the NASDAQ. I just made over £1,000 trading the NASDAQ over the course of the last couple of days. Let’s take a look at how I did it and what the markets are doing now…
OK, so in terms of stocks today, let’s consider the trade I just hopped out of!
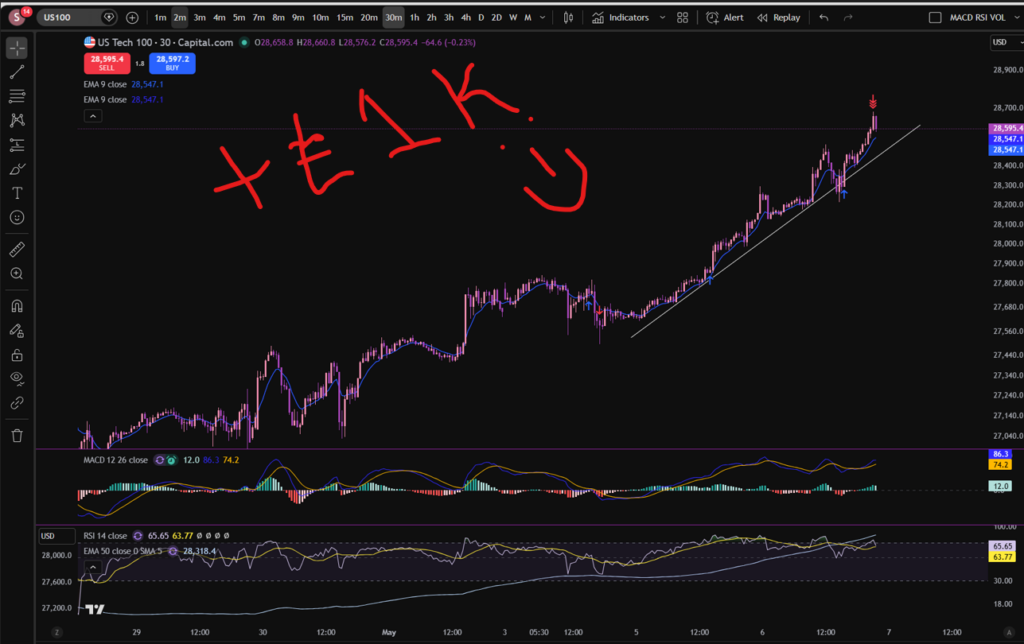
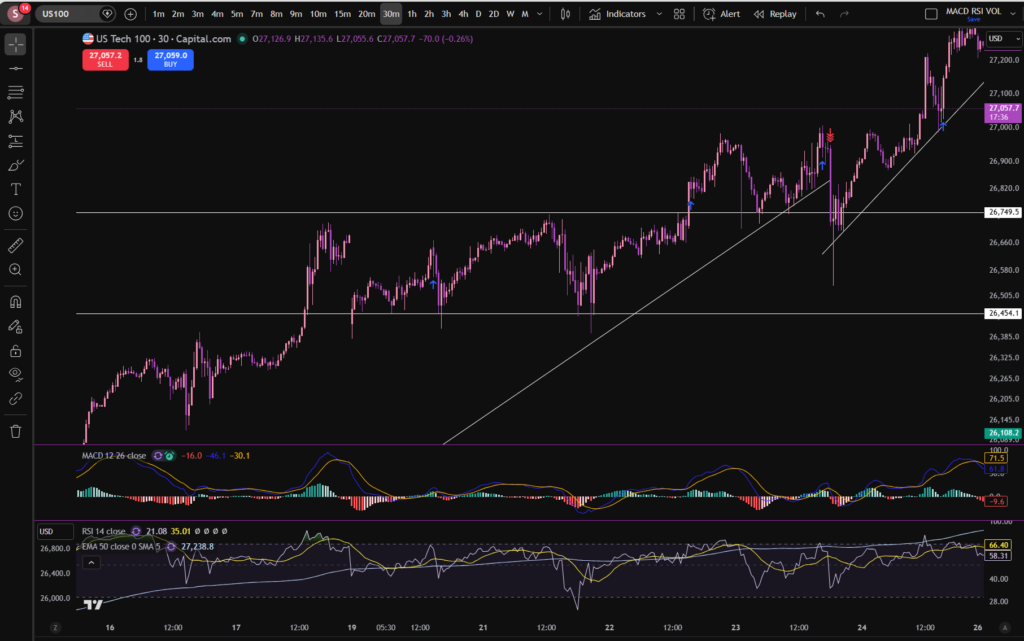
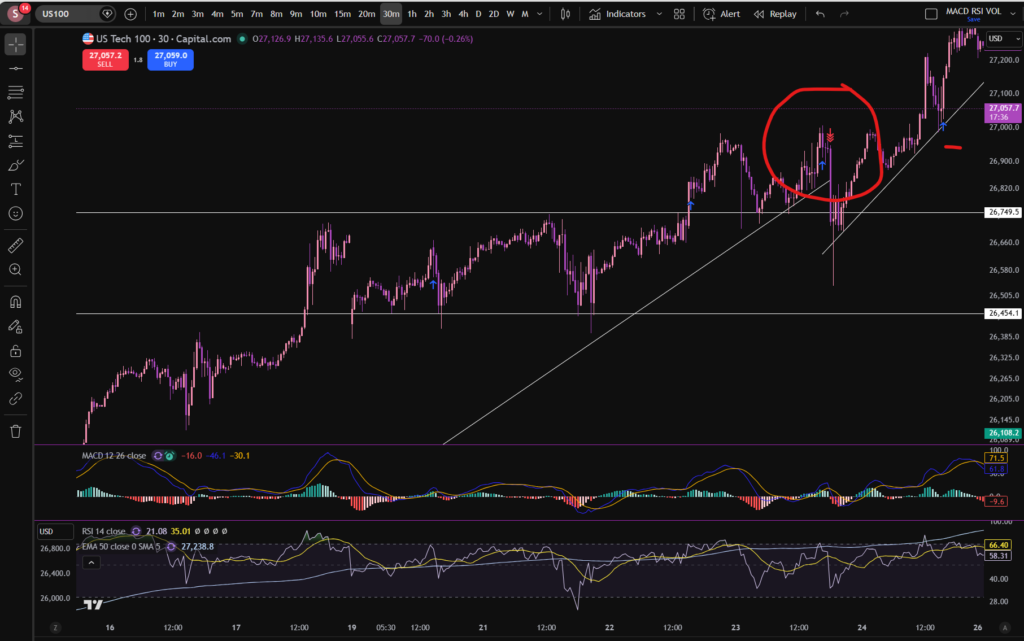
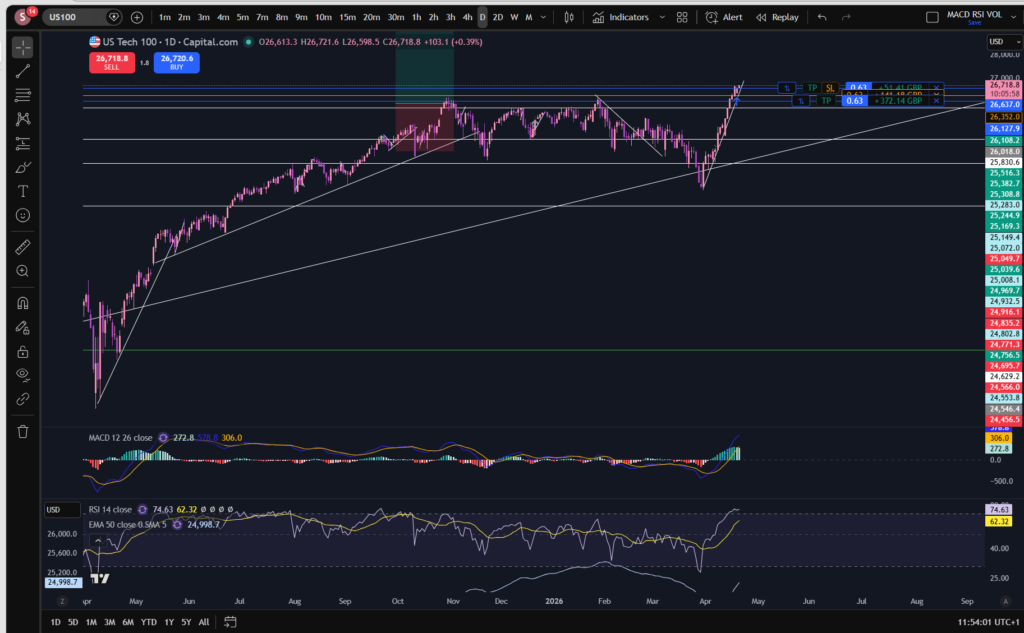
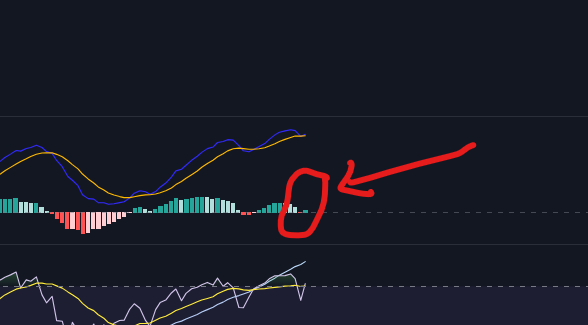
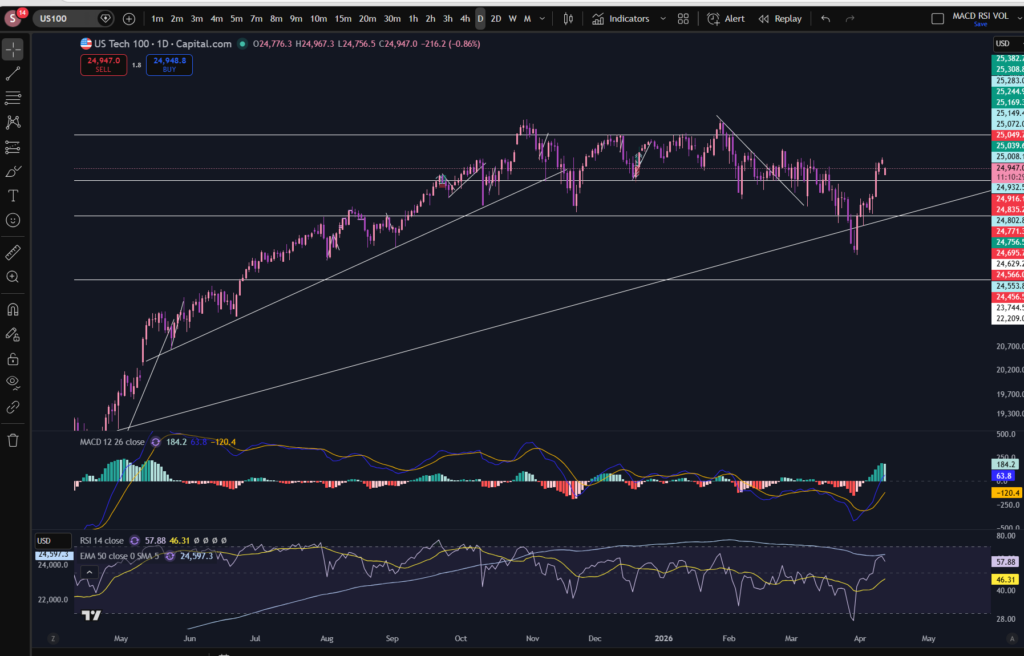
In this trade I entered into several positions as the price increased. You can see where I entered the market. In the end I had averaged up a total of three times before taking all profit off the table. I ended up with over £1,000 from these positions. You can see when I got into the first position on the chart with the blue arrows. This was around the 3rd or 4th of May. I exited them yesterday – see the collection of red arrows at the top of the upwards push. How did I know that the market may start pulling back there? It had sailed away from the diagonal support level I had placed on the chart, and the MACD was starting to lose it’s pigmentation on the histogram. The RSI was quite over extended and I was expecting it to pull back, at least to the diagonal support, but my thoughts were, it could pull back even further as it may have exhausted itself and I had a good chunk of profit sitting on the table which I didn’t want to give back 🙂
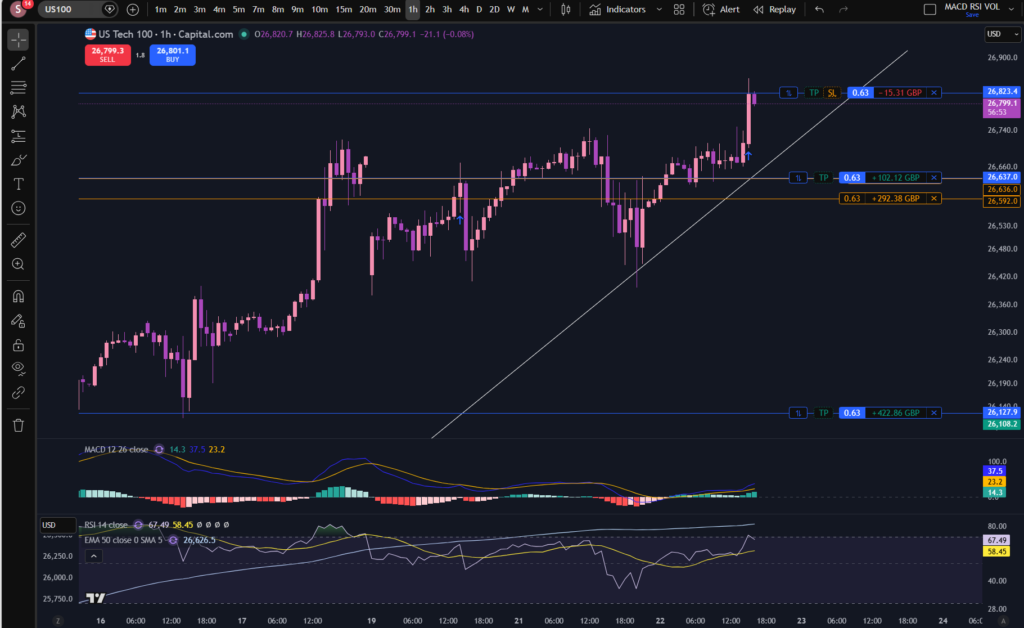
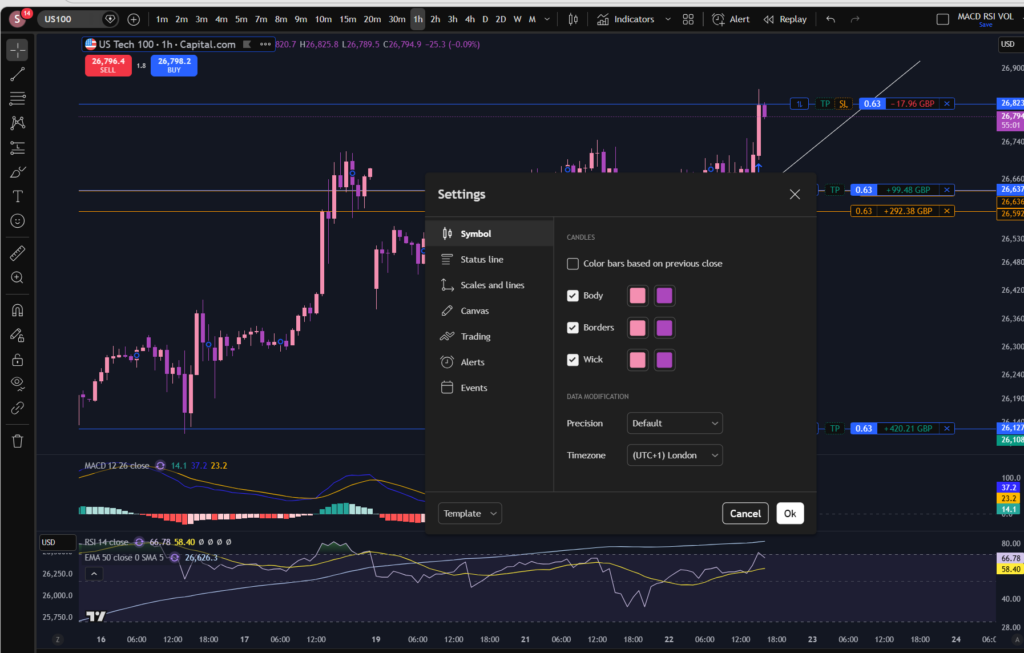
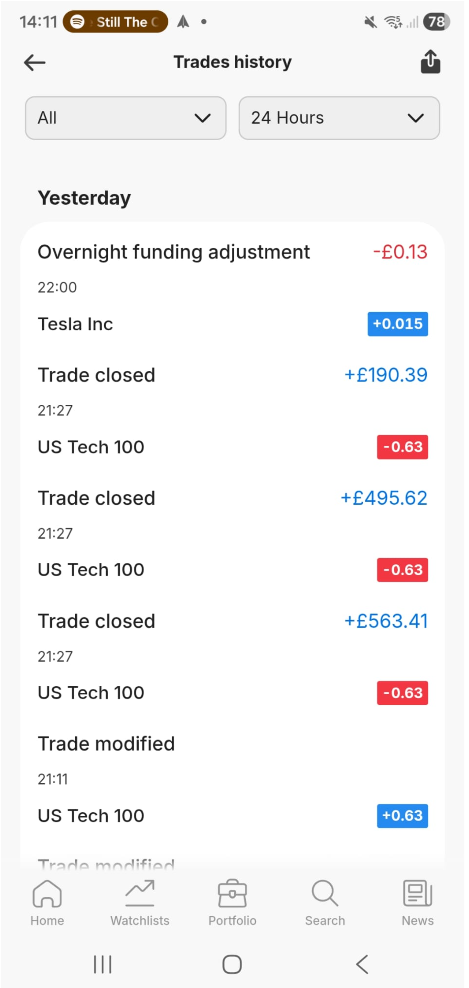
Here are my closed positions per my Capital.com app:
So what is next for the NASDAQ?
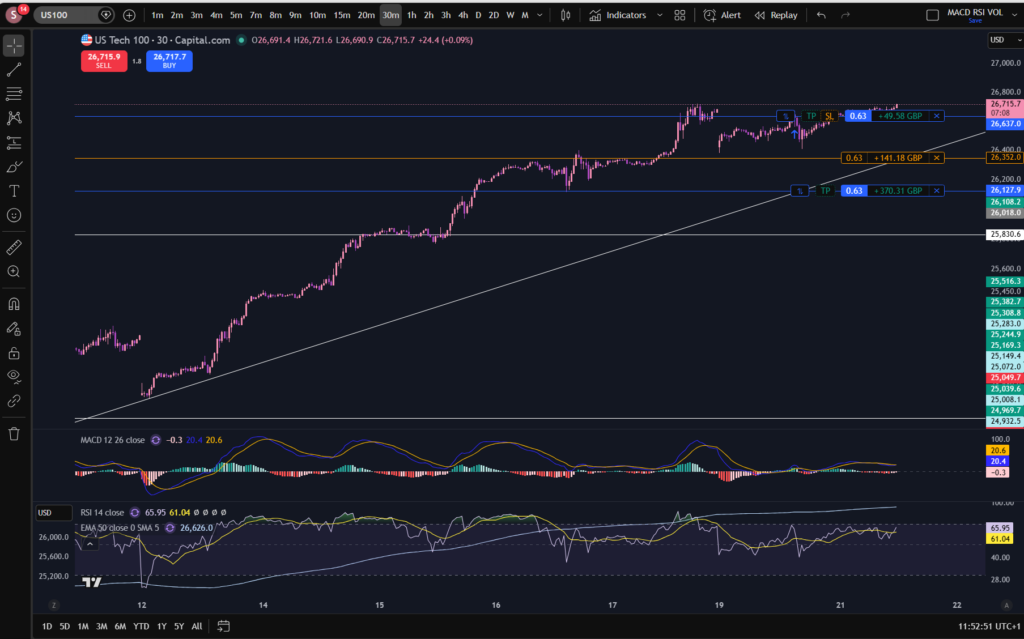
In terms of stocks today and the NASDAQ in particular, I can see the market has started chopping sideways through the diagonal support I drew on the chart, which is not a great sign! It’s possible it could still come up further, but right now, i’m waiting.
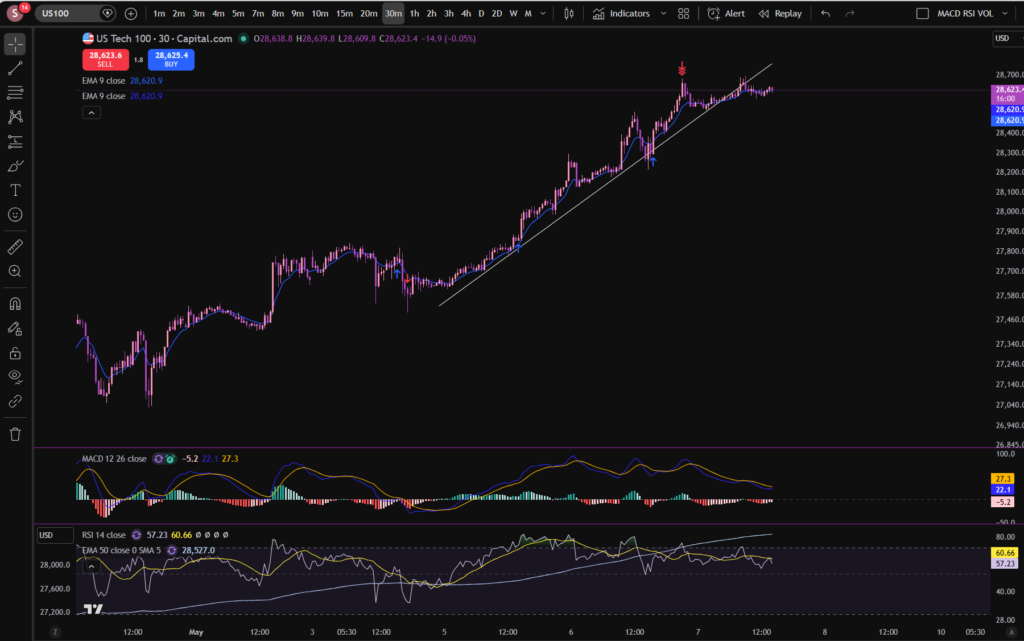
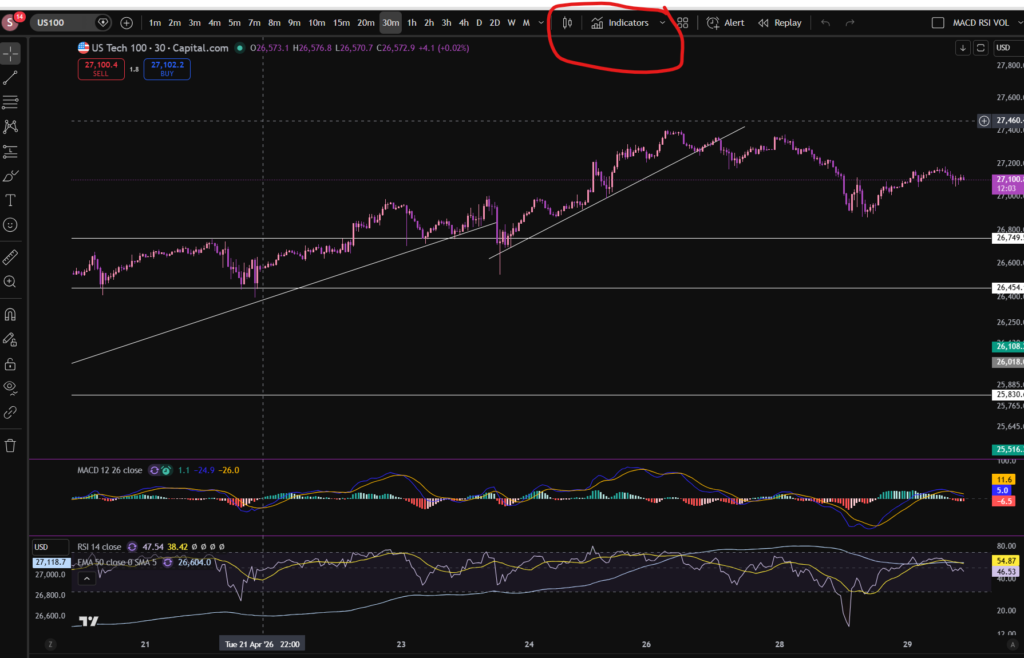
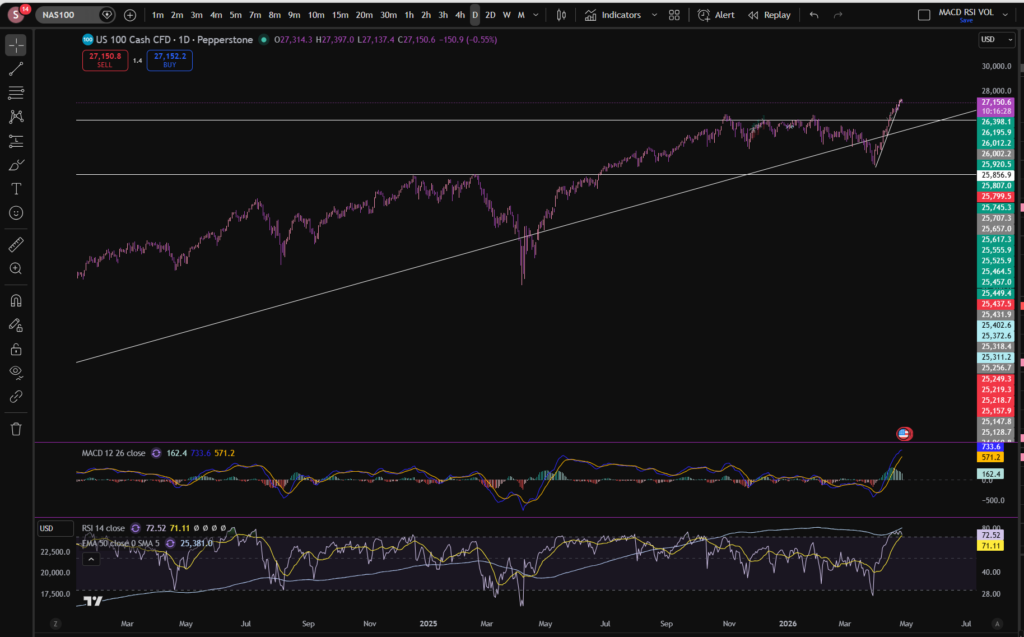
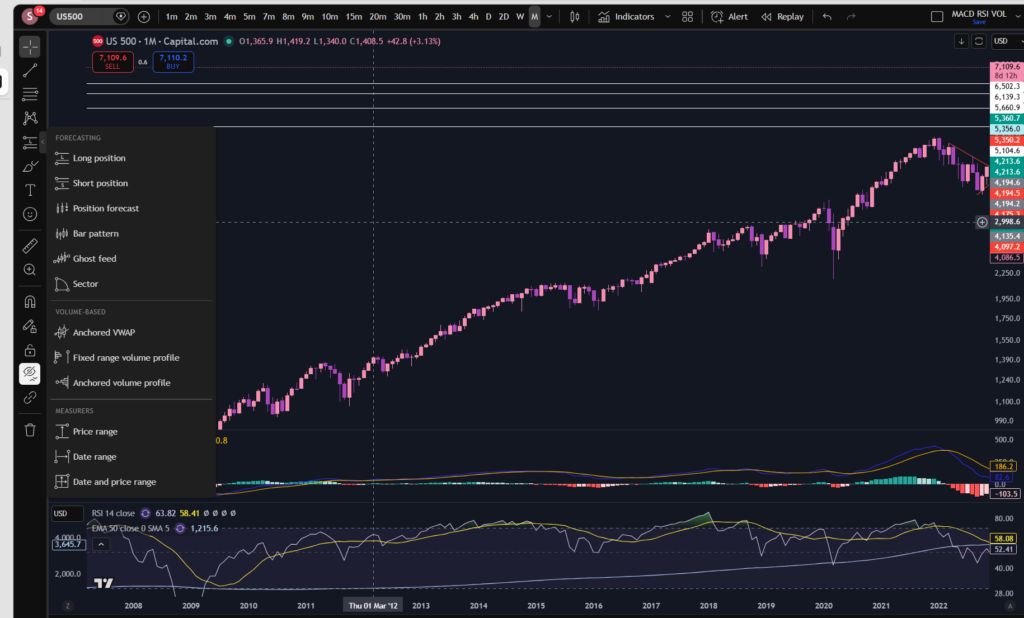
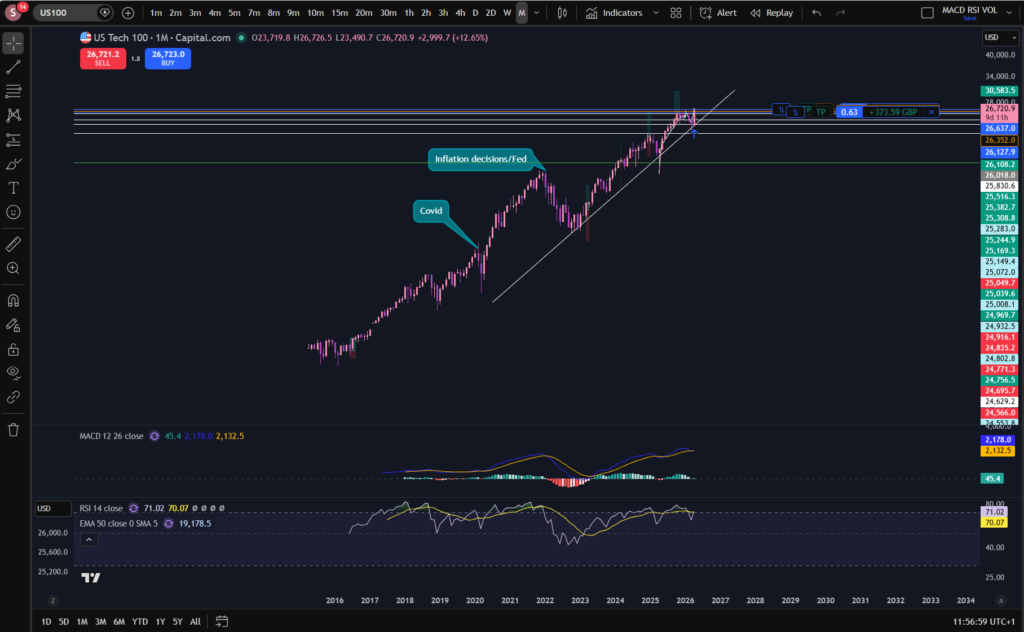
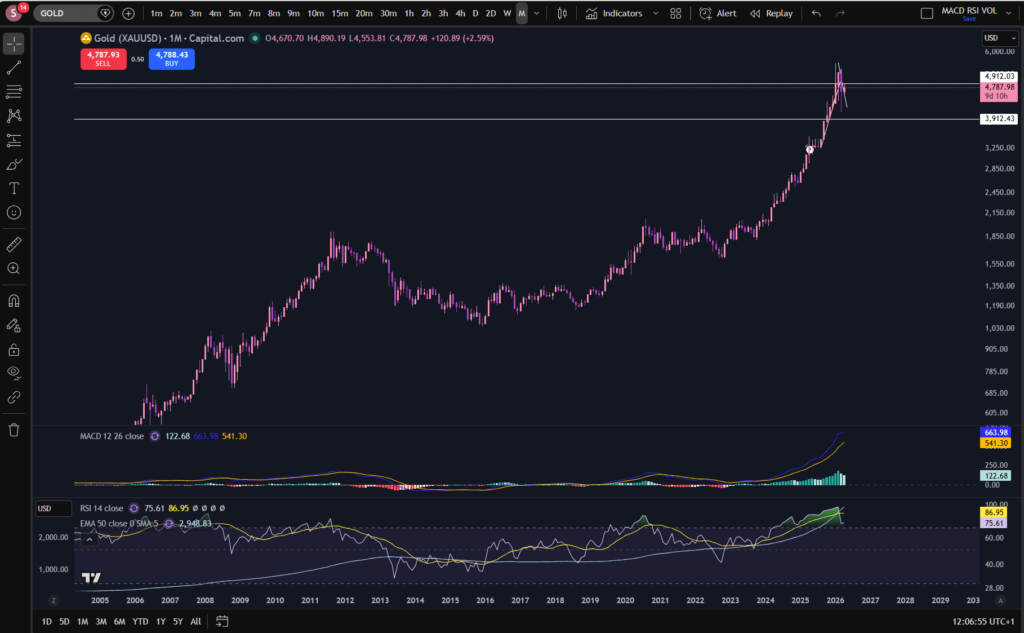
When you become an experienced trader, you sometimes get a ‘smell’ for when the market is peaking… it’s a combination of observations which give you a feeling that you need to jump out of the trades. The indicators, yes, but also your past experience of what they all collectively look like when the market is about to lose some momentum. Let’s take a look at the birds eye view to see if we can see what’s going on, from a higher level:
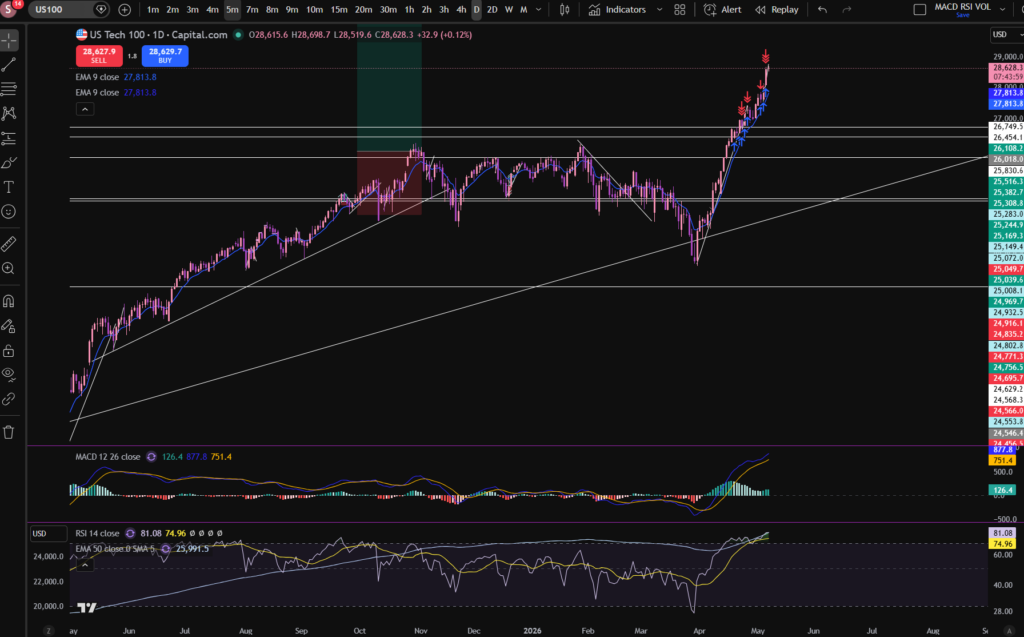
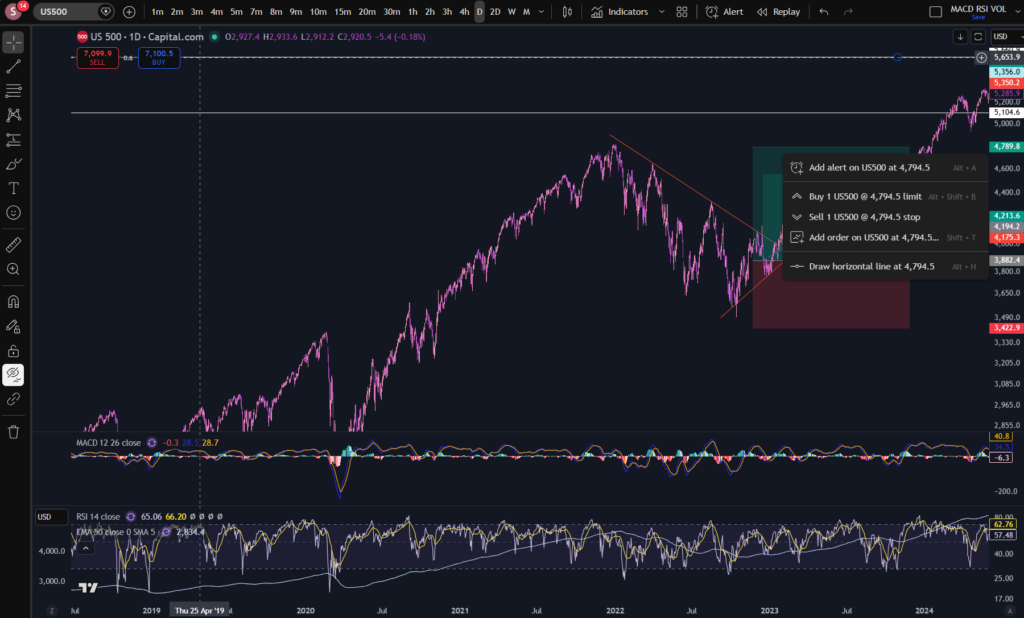
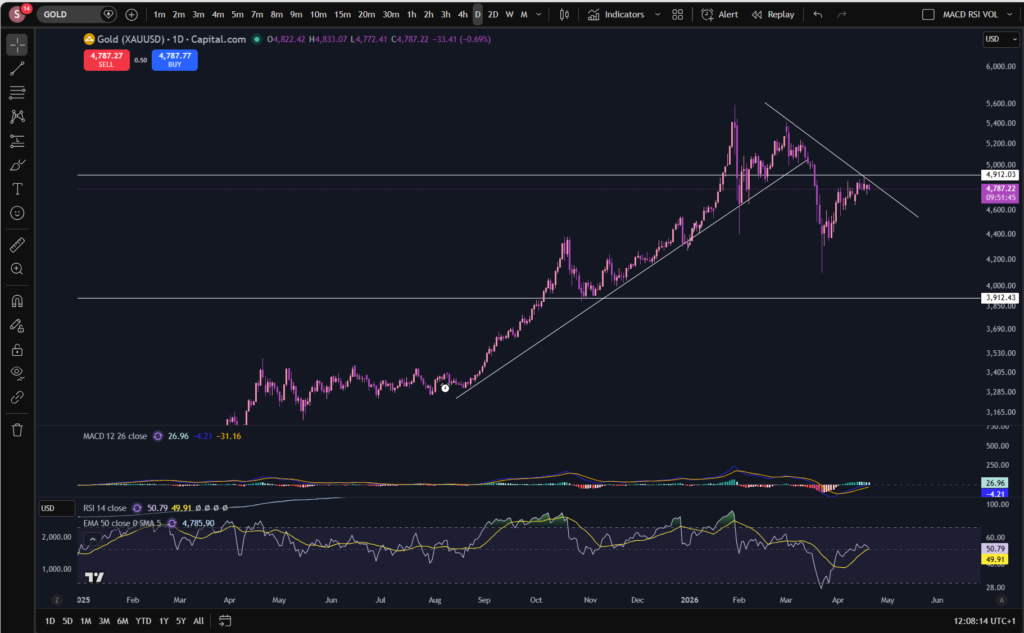
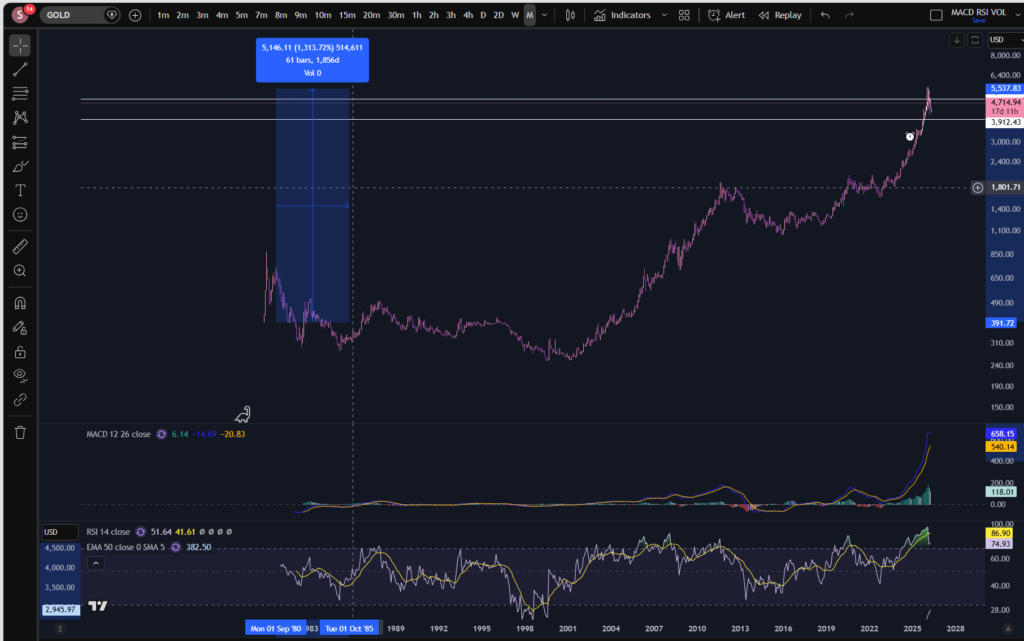
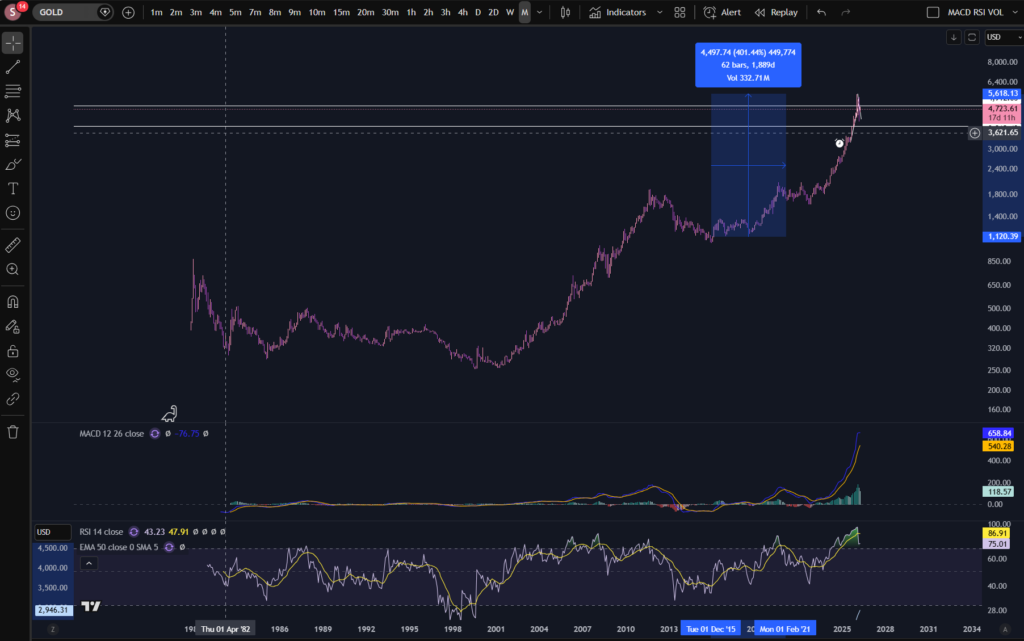
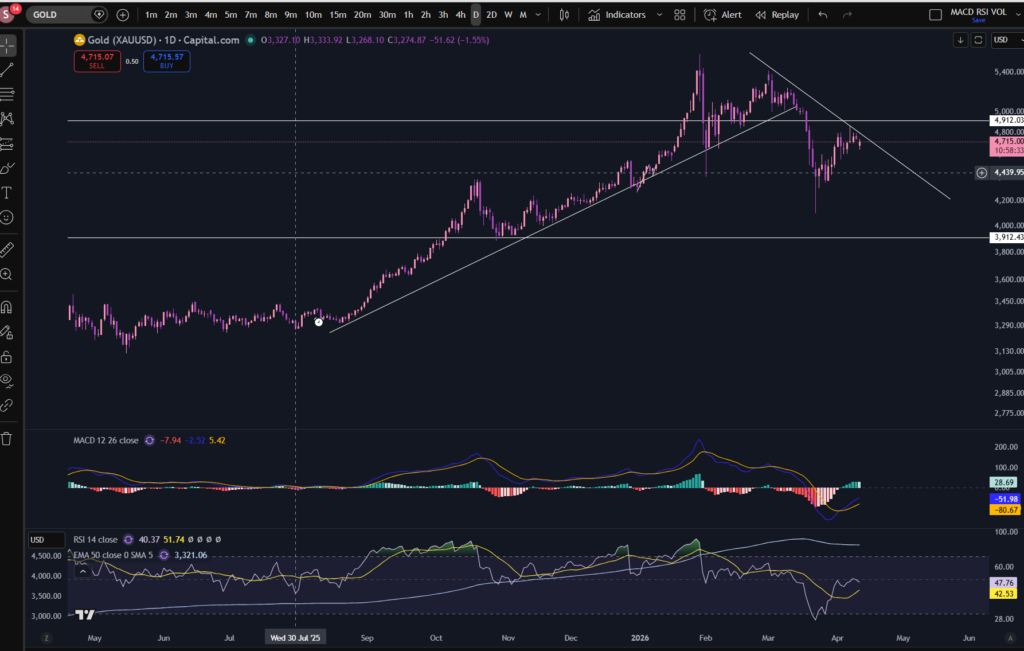
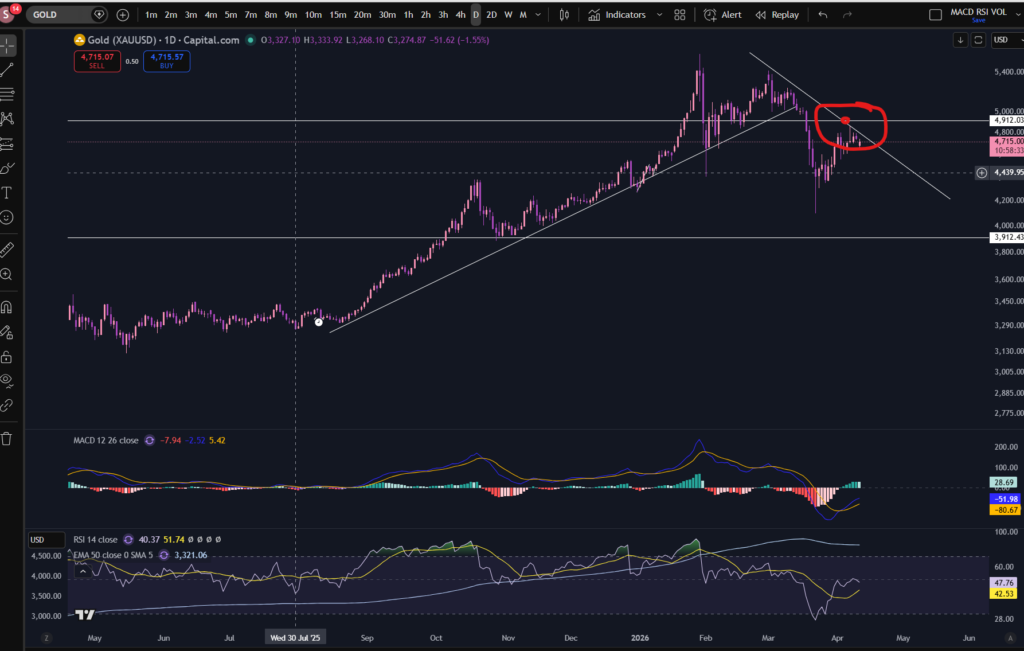
So, as you can see from the daily timeframe, the market has pushed off strongly from a strong long term diagonal support. The RSI is VERY high on this timeframe. Its a possibility that the market may be due a bit of a pull back – take a look at the shape of the previous upwards swing from this trend line. It tends to push up and then bump over in a ‘cloud’ shape rather than sky rocketing to the moon without any let up! So I have this in mind, while i’m waiting and also the fact that it’s chopping through the diagonal trend, now, on the 30 minute timeframe so it’s broken that support as of now.
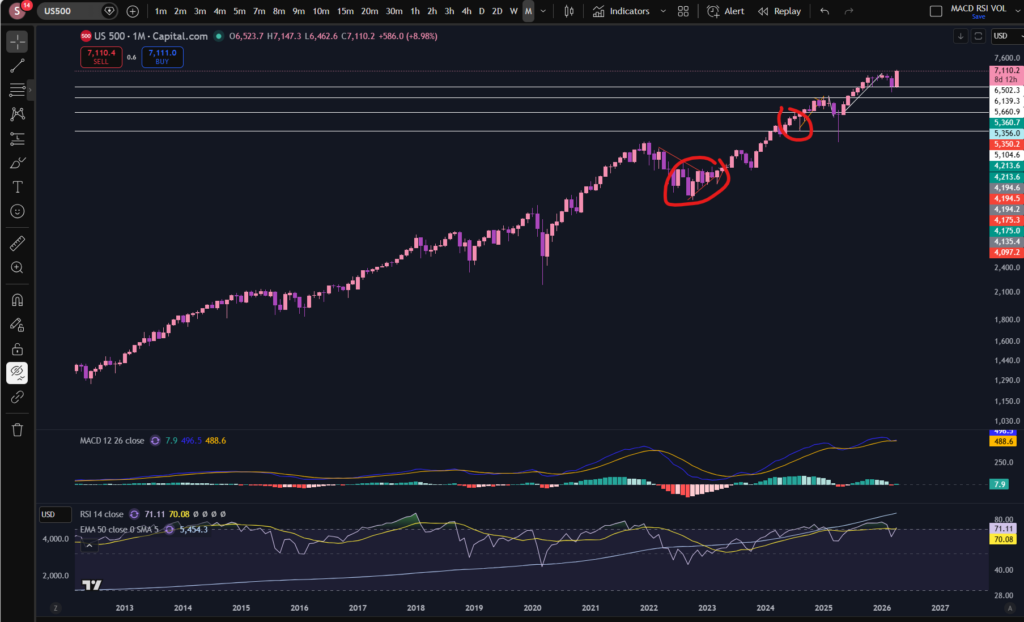
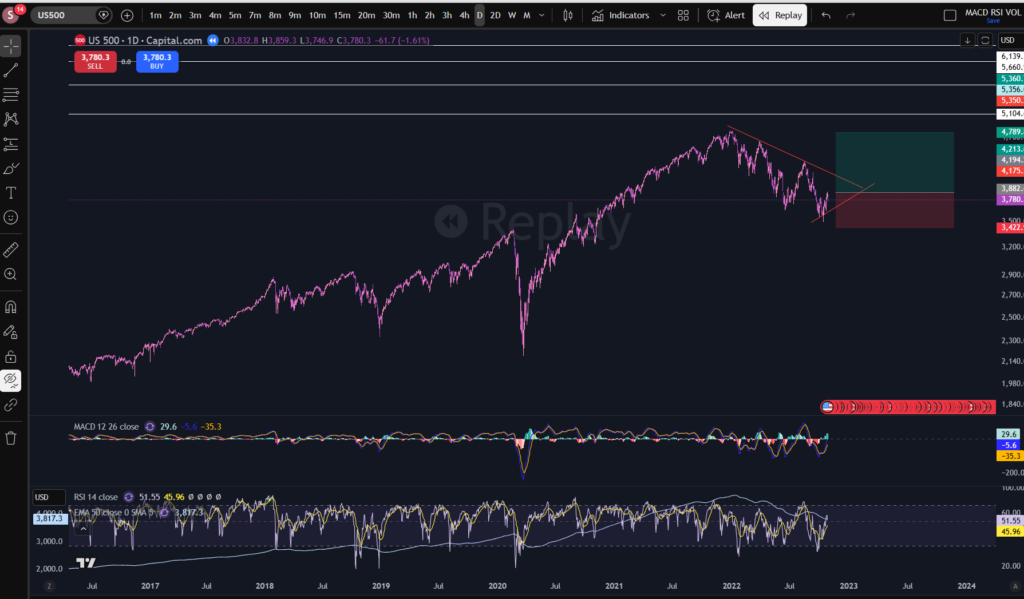
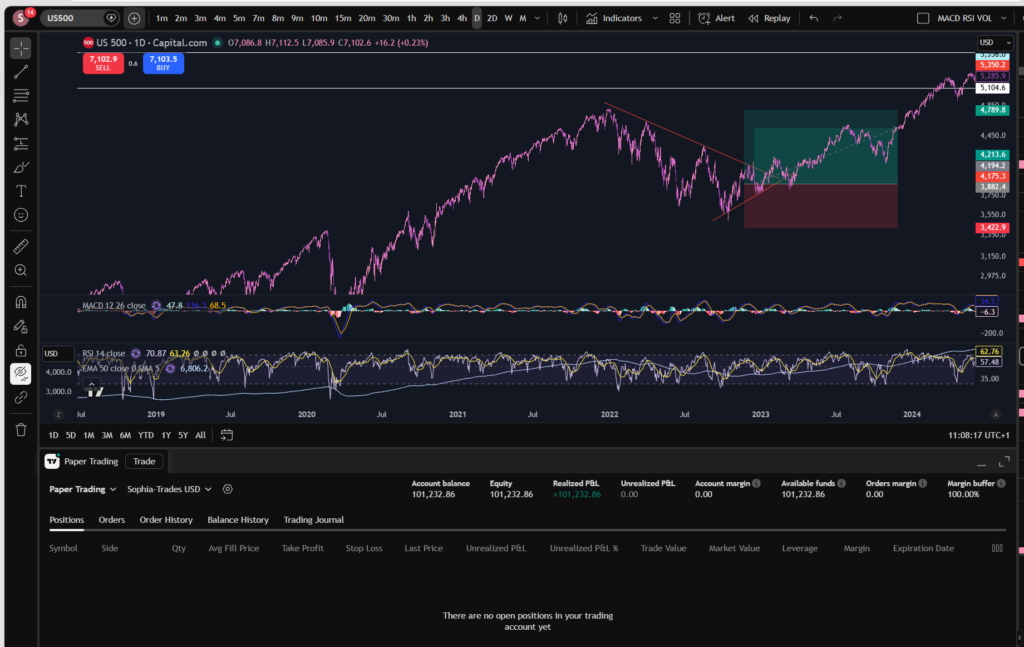
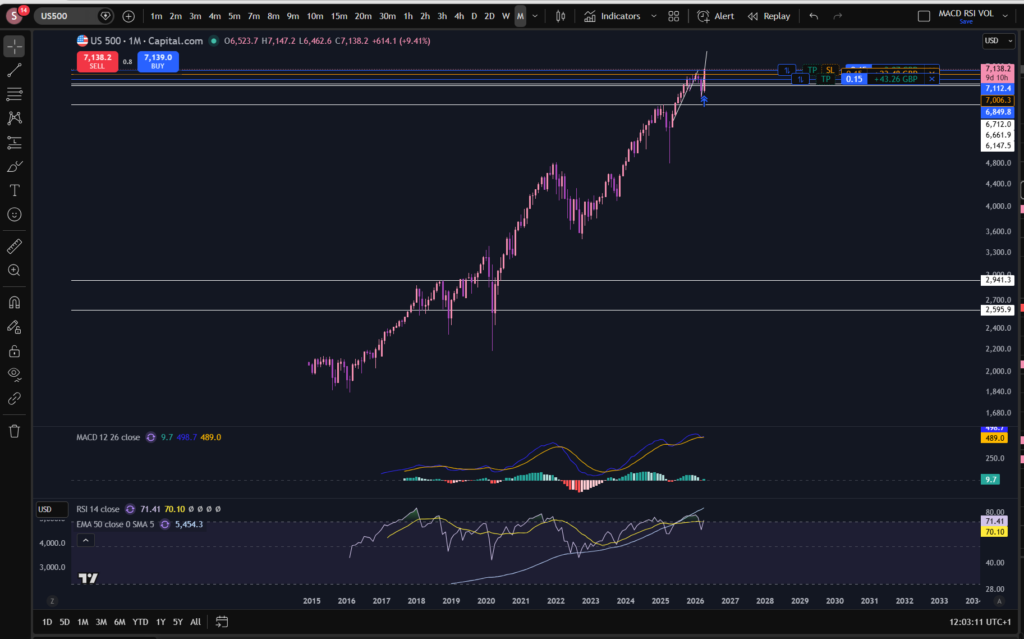
Let’s take a look at the S&P 500 for good measure – we can’t really consider stocks today without looking at this. This is heavily influenced by the NASDAQ so likely it will follow a similar story:
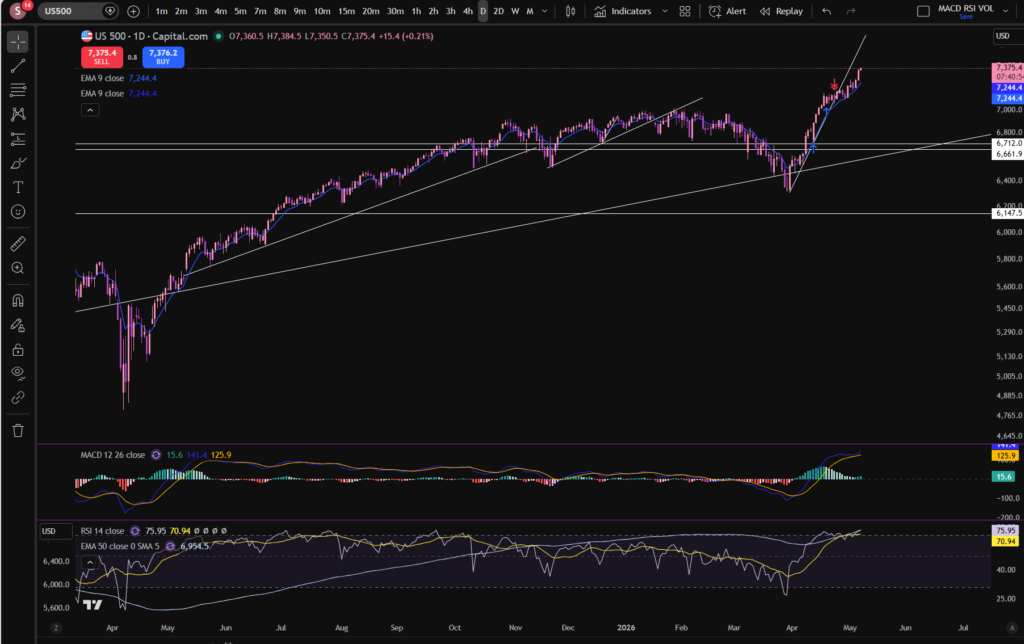
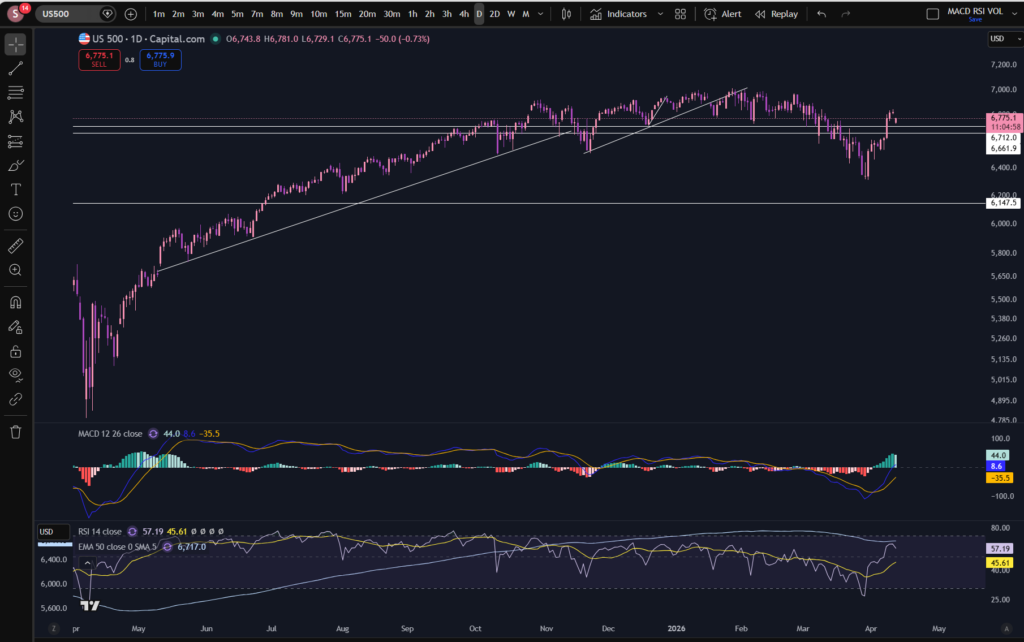
As you can see, a similar story has occurred on the S&P 500… This one looks like it broke through a previous diagonal support. It could be that this support can now be adjusted for a better fit – see below. (Don’t be afraid to readjust your trend lines as the markets play out):
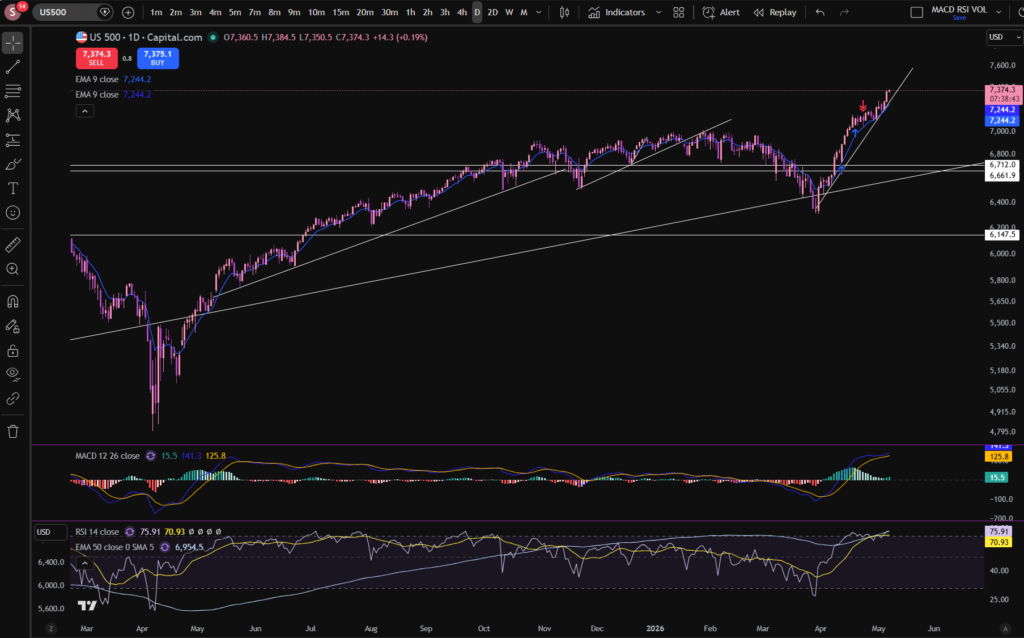
There – that’s better!
This one actually looks more strong than the NASDAQ to me, but obviously you need to decide for yourself before entering any market. Why do I say it looks stronger? The histogram has turned dark green again on the MACD indicator, and it’s just bounced on the readjusted trend line!
I hope you found this article on stocks today helpful!
Disclaimer!
Nothing on this blog should be taken as financial advice or encouragement for you to enter a trade. You are expected to speak to a financial adviser or carry out your own due diligence before entering any positions. Everything on this blog is made for educational purposes and to equip you with the knowledge you need to be able to make your own financial decisions.
For more great tips and advice on trading the stock market, please visit:
https://www.sophiatrades.co.uk
To watch me trade live please visit my patreon page here:
https://www.patreon.com/sophiatrades
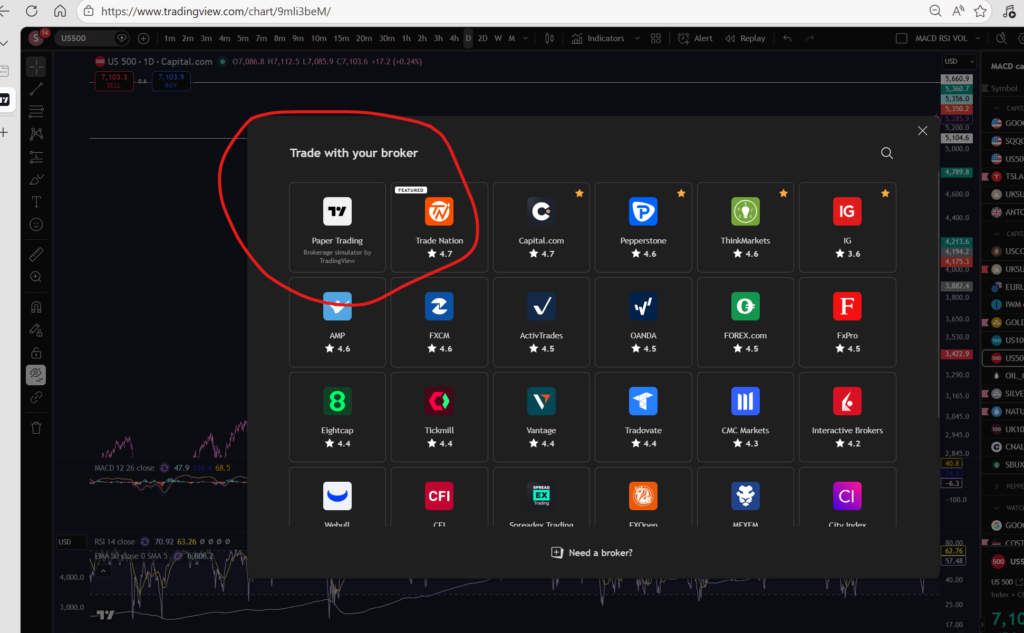
Finally, if you would like to receive a discount on the Trading View charting software I use, please click on the relevant link here:
https://www.tradingview.com/?aff_id=117138
Please note any subscriptions taken via my affiliate link with Trading View may result in me earning a small commission. However, I provide complete transparency on me using Trading View personally – I publish my success on the financial markets via my broker reports and any profits earned were done so by using my own Trading View subscription, so I genuinely do recommend them and have been using the Trading View charts for many years.