In this article i’m going to talk about how to buy stocks using a Fibonacci Retracement as a day trader. Fibonacci is a magical mathematical proportion which exists in everything in the universe. It’s no surprise that it exists as significant levels for buying and selling demand in the stock market. Price movements are driven, after all, by human beings – biological organisms. Let’s take a look at how you can use this as a day trader to make more money trading.
What is Fibonacci?
Before we can understand how to buy stocks using Fibonacci Retracement, we first need to understand what it is. Fibonacci is an almost ‘magical’ pattern which exists in the universe. It represents a sequence where every number in the sequence is the sum of the two preceding numbers. It was discovered by the mathematician, Leonardo of Pisa. These ratios and patterns can be found in the human body, leaves, flowers, other animals – the list is endless. Mother nature uses it to build organisms on the Earth and it also exists in ancient archaeological structures too! The sequence is identified by the formula Fn = Fn-1 + Fn-2, starting with F0=0 and F1 = 1.
As the sequence progresses, the results tend to a special value – 1.618. This is known as the Golden Ratio.
How to buy stocks using the Fibonacci Retracement as a Day Trader then?
The special Fibonacci proportions can indicate areas of buying and selling pressure on a stock chart. It can help traders to identify areas for entry points and pull backs. You can use the Fibonacci tool in Trading View, by accessing it on the menu in the left, as shown below:
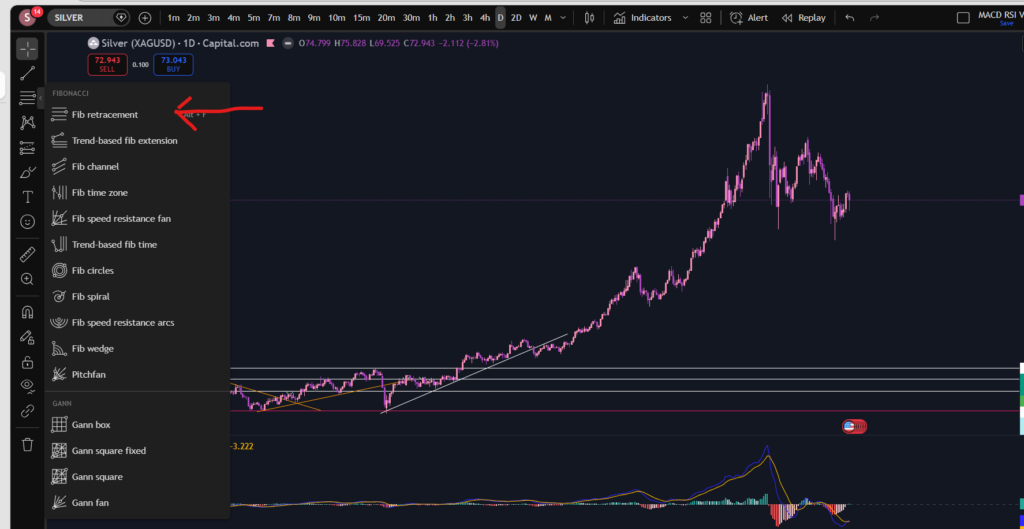
Once selected you can click the chart and drag the indicator down over the price movements, to show the various levels of the Fibonacci Retracement tool- you line the tool up with the lowest or the highest point, and then pull/extend it over the price movements, to the highest if you started at the lowest, or vice versa.
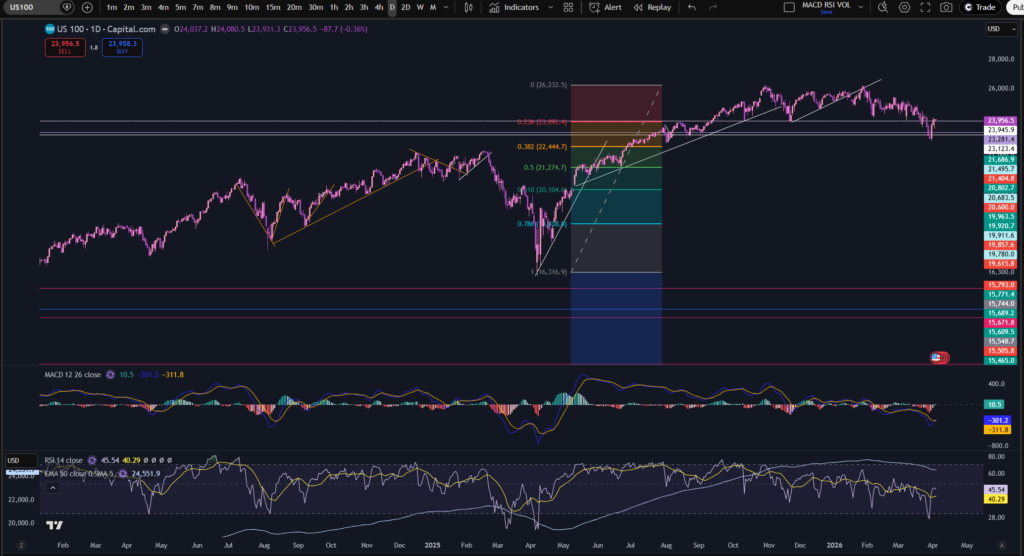
Let’s take a look at where this indicator ended up being accurate, in terms of support and resistance levels:
As you can see, i’ve added support and resistance lines everywhere where you can see significant levels of buying or selling pressure. I also stretched the Fibonacci indicator vertically, to line it up with the pull back/resistance and support areas.
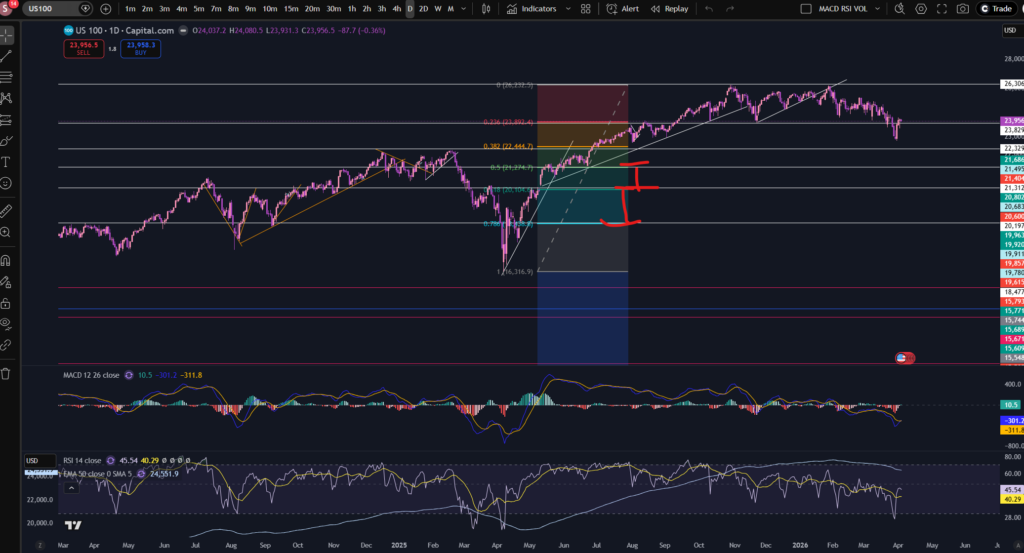
As an example, the next level up is half the height of the previous one, as shown below:
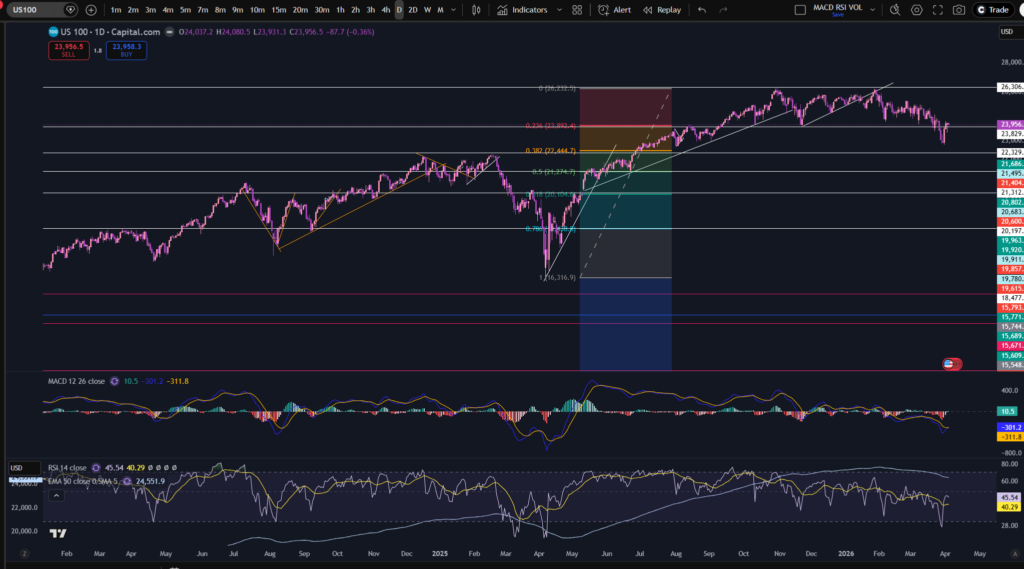
Amazingly, these line up perfectly with the Fibonacci retracement levels?! How is this possible? It’s amazing but it’s real, and you can probably now imagine how you will be able to use this in your trading… let’s take a look at this next…
Where to buy or sell with Fibonacci Retracement
So as you can see the Fibonacci Retracement tool can be very useful in understanding how to buy stocks. The idea is to buy at the level where the market pulls back to. You can see these types of levels at, for example, 21.686, 21.495, 22.329…You can see the price pulled back to these levels and then went on higher. You could add a stop loss underneath the level, and then set a take profit at the next level up! Or continue to ride the trend, by moving your stop loss up to the next successive levels, as the price moves.
I hope you found this article helpful.
Disclaimer!
Nothing on this blog should be taken as financial advice or encouragement for you to enter a trade. You are expected to speak to a financial adviser or carry out your own due diligence before entering any positions. Everything on this blog is made for educational purposes and to equip you with the knowledge you need to be able to make your own financial decisions.
For more great tips and advice on trading the stock market, please visit:
https://www.sophiatrades.co.uk
To watch me trade live please visit my patreon page here:
https://www.patreon.com/sophiatrades
Finally, if you would like to receive a discount on the Trading View charting software I use, please click on the relevant link here:
https://www.tradingview.com/?aff_id=117138
Please note any subscriptions taken via my affiliate link with Trading View may result in me earning a small commission. However, I provide complete transparency on me using Trading View personally – I publish my success on the financial markets via my broker reports and any profits earned were done so by using my own Trading View subscription, so I genuinely do recommend them and have been using the Trading View charts for many years.