In this article i’m going to take a look at what’s happening with the stocks today. I’m going to consider the major indices and give my thoughts on their recent activity. I will also try to identify whether the markets have started recovering. Let’s take a look!
Stocks today – the NASDAQ
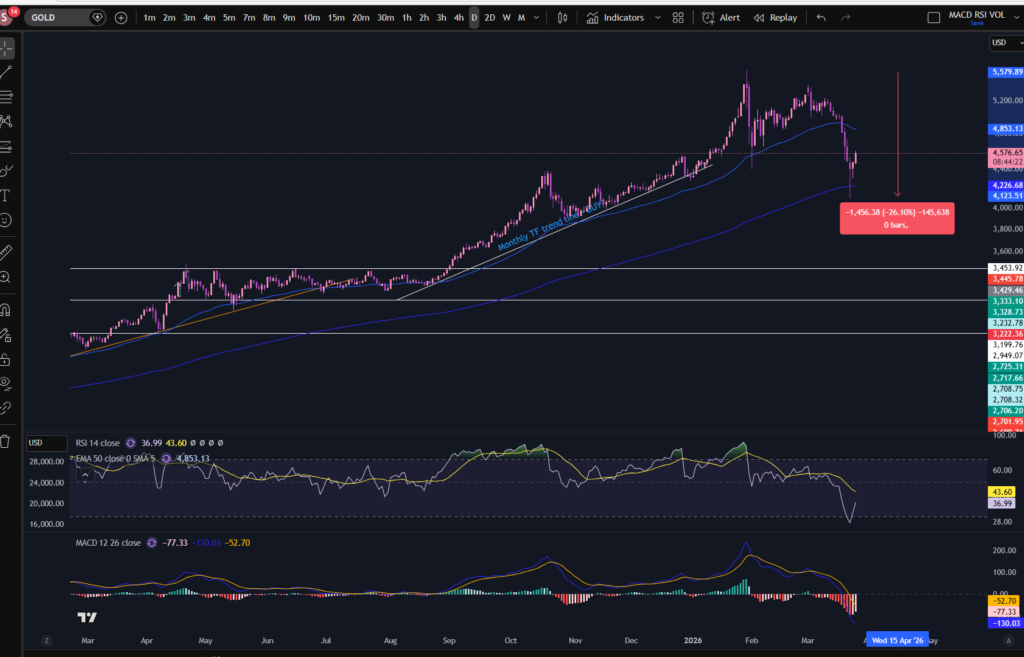
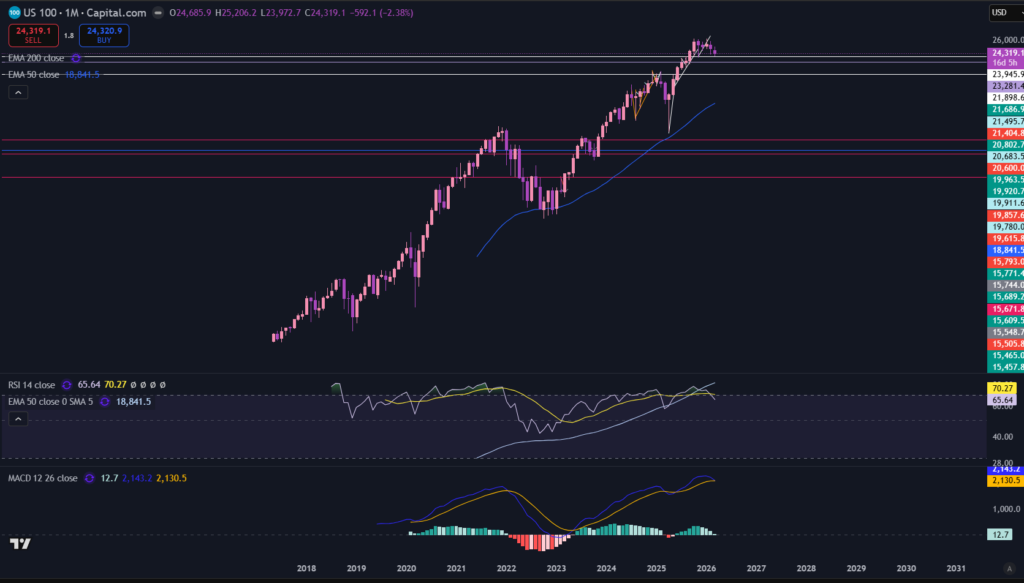
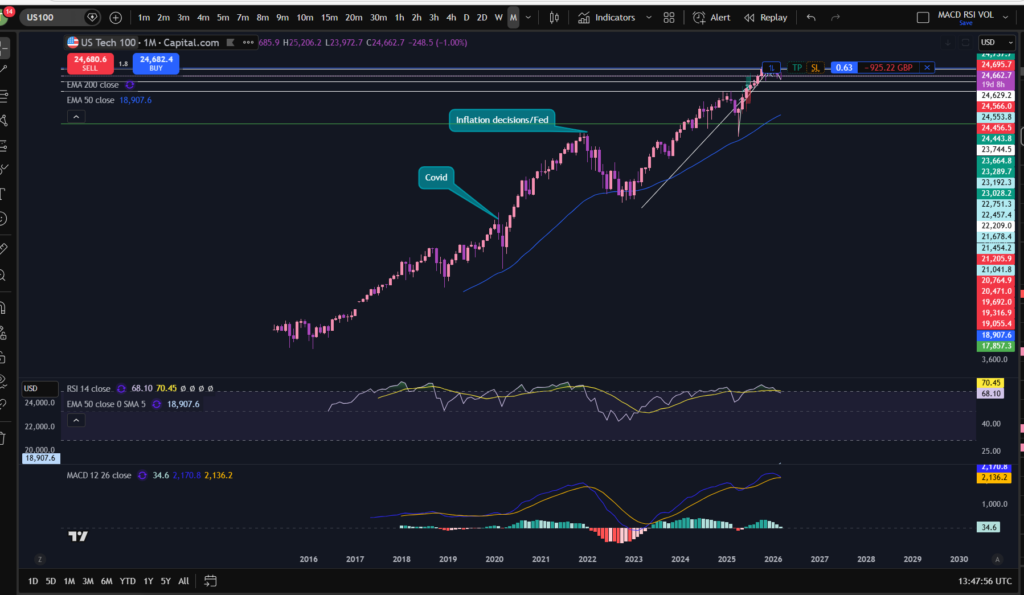
A great way of establishing quite quickly, what’s happening with stocks today, is by considering the major indices. This will give a quick overview/average idea of the direction they are headed in. Let’s take a look at what’s happening on the NASDAQ, monthly timeframe. The monthly timeframe gives a great birds eye view of the position of the markets. It’s great for long term planning:
As you can see on this monthly timeframe chart, the position recently, from a long term perspective is still very much that the market is pulling back. The latest monthly timeframe candle is a big downwards one, (meaning the price closed lower than where it opened at the start of the month). To understand more about how to read Japanese candlestick patterns, please see the relevant section of this blog, here:
Japanese Candlesticks – Sophia Trades – Learn how to Trade the Stock Market
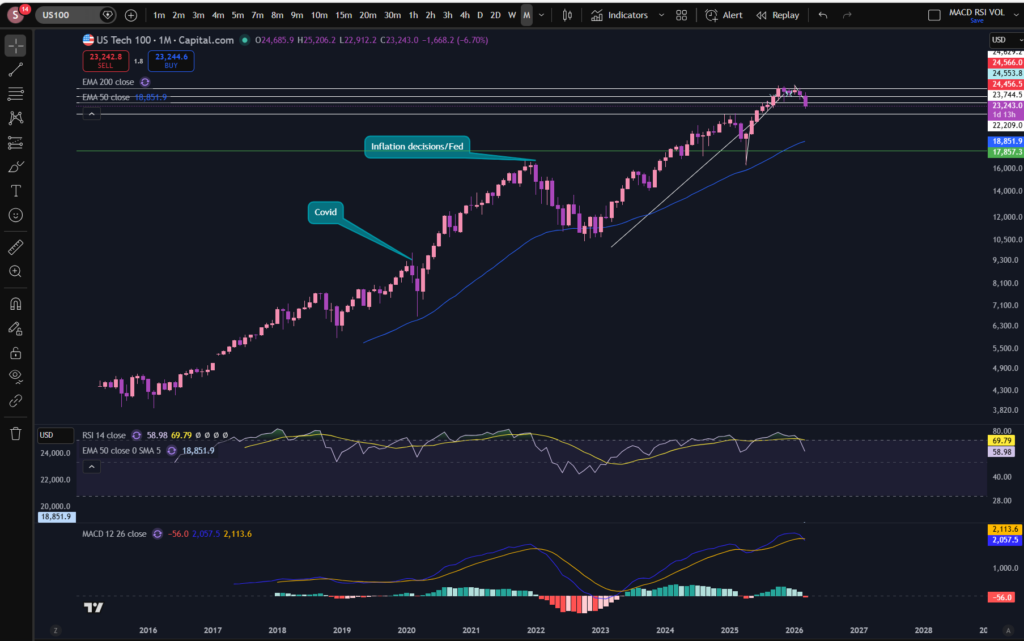
You can also see on the above chart that the MACD has crossed over the signal line and the MACD histogram has made its first red bar. It’s not clear whether this new downwards move will continue. You can see at the previous occasion this happened, it only lasted for two red histogram bars, and then recovered.
It’s also worth noting the position of the RSI indicator. The RSI has pulled back to the ‘pull back’ level it usually reaches, while it’s still uptrending. Note the position of where it pulled back to, previously, marked with the red line, here:
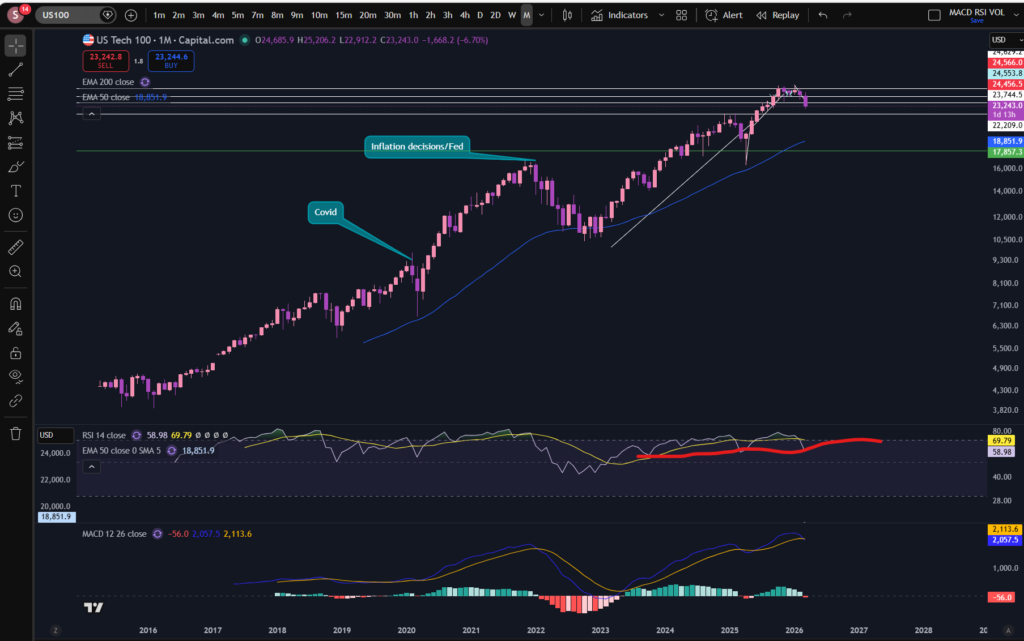
The RSI is at a critical point. If the RSI dips below this sort of level and stays there, it can indicate the markets are downtreding long term, rather than them just pulling back.
Let’s zoom in, next, and take a look at the daily timeframe:
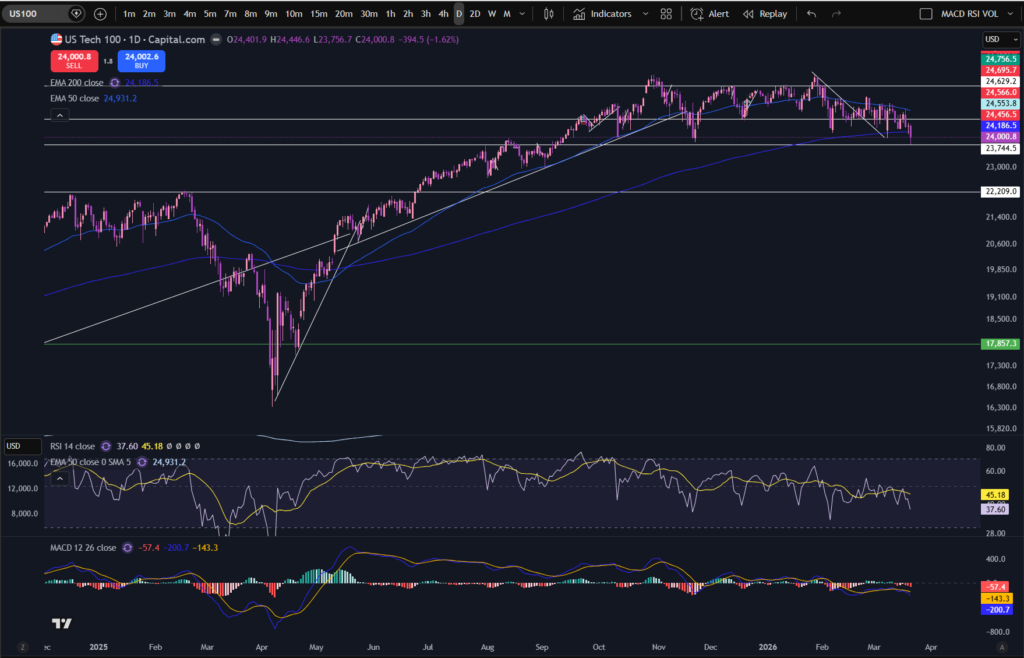
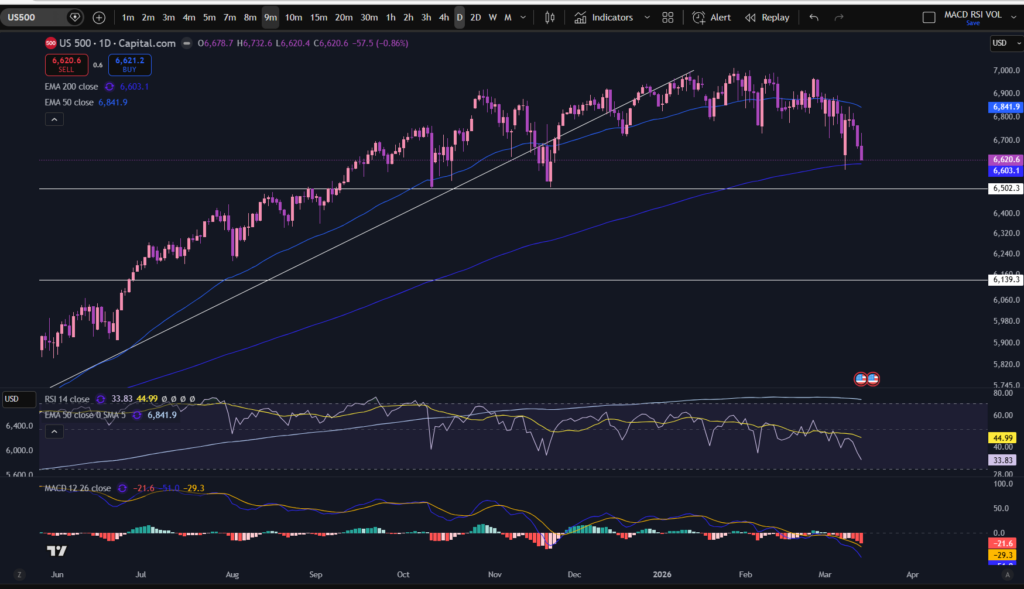
Stocks today – the NASDAQ daily timeframe chart
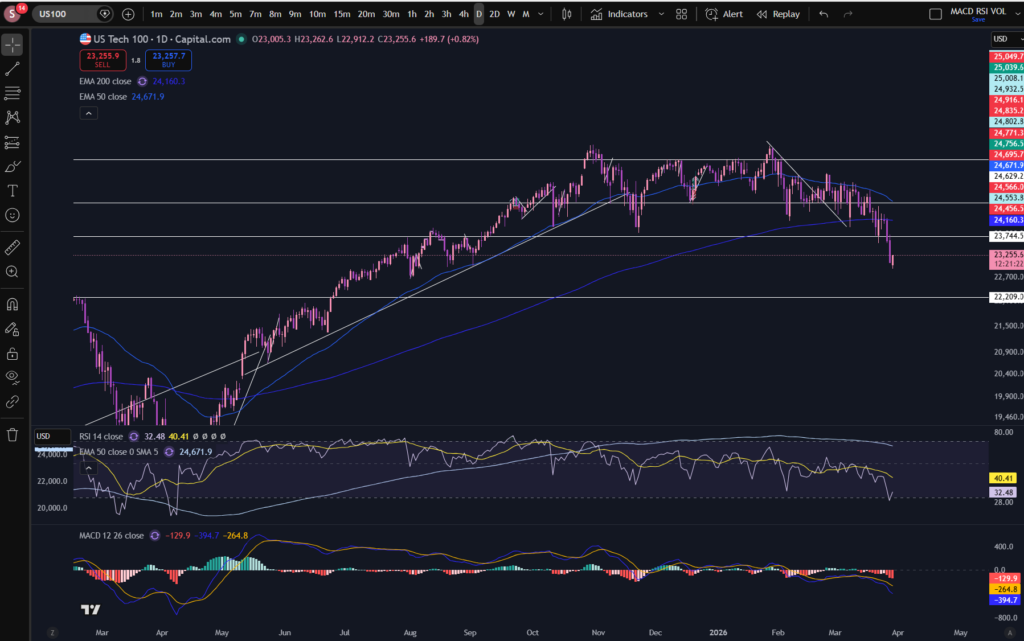
As you can see, the picture is quite gloomy for buyers on the daily timeframe. The price has broken below the firm support level at around 23.744. Once a price breaks through a major support or resistance level it can then act as the opposite so in this case it could end up being a level of resistance. However, the RSI indicator has pulled back significantly and the MACD indicator has dropped significantly to the downside. It is still making large red histogram bars so currently it appears as though the downward move has still got a lot of momentum.
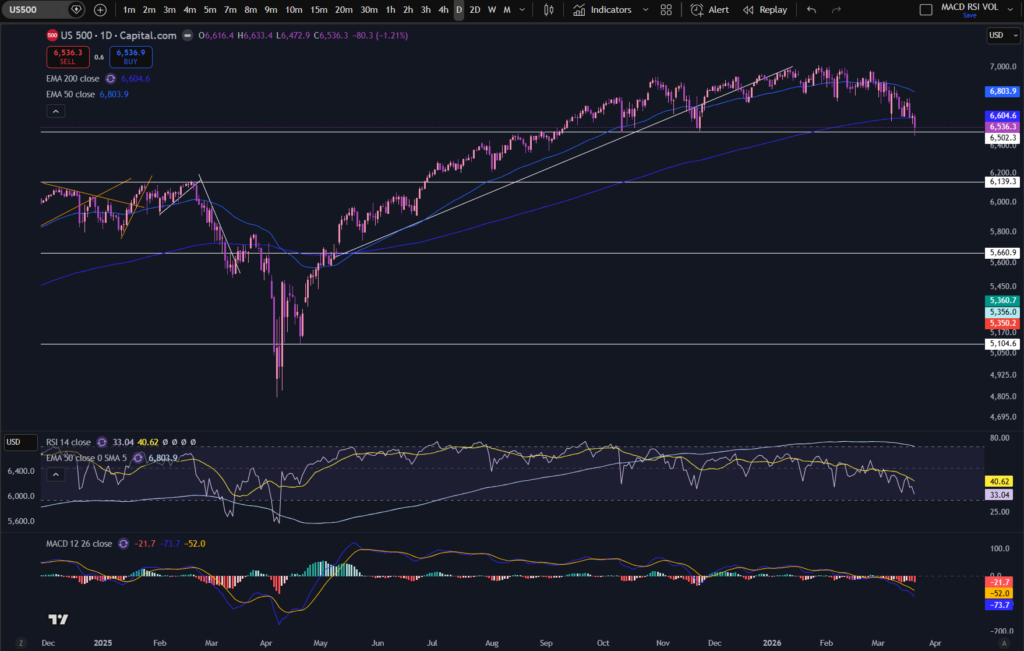
S&P 500
I like to consider the S&P 500 chart for a wider, overall view, of what is happening with the markets, although it can often follow the same sort of shape or pattern, as the NASDAQ, so i’m not anticipating good news for buyers with this either. Let’s take a look:
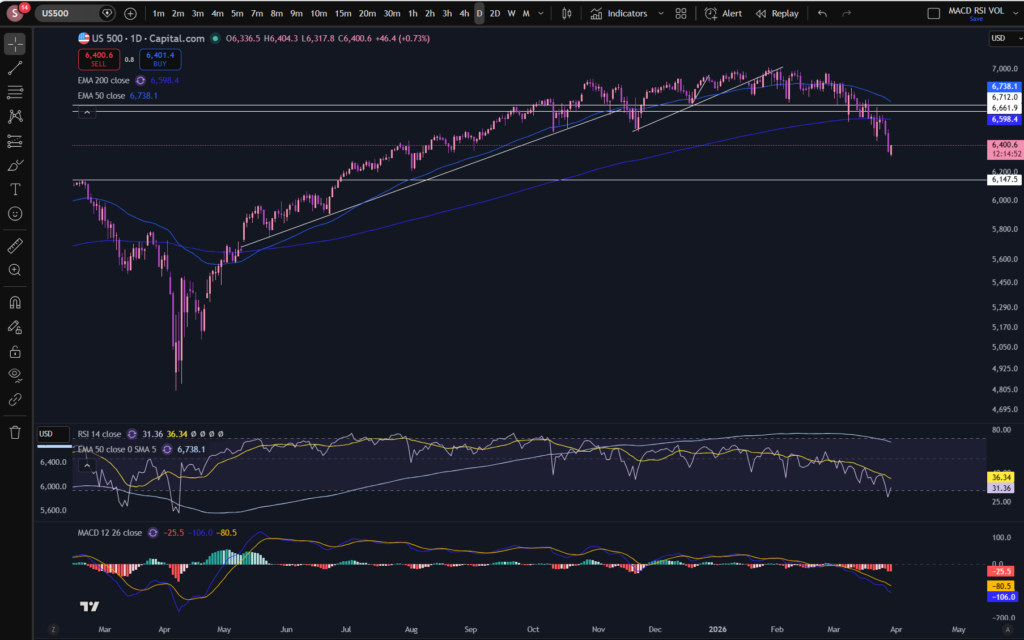
As you can see on the daily timeframe for the S&P 500, it’s showing a similar sort of story as the NASDAQ.
Conclusion – stocks today
The markets are not yet recovering so I, personally, will be avoiding entering any more ‘buy’ positions, for the time being.
I hope you found this article helpful.
Disclaimer!
Nothing on this blog should be taken as financial advice or encouragement for you to enter a trade. You are expected to speak to a financial adviser or carry out your own due diligence before entering any positions. Everything on this blog is made for educational purposes and to equip you with the knowledge you need to be able to make your own financial decisions.
For more great tips and advice on trading the stock market, please visit:
https://www.sophiatrades.co.uk
To watch me trade live please visit my patreon page here:
https://www.patreon.com/sophiatrades
Finally, if you would like to receive a discount on the Trading View charting software I use, please click on the relevant link here:
https://www.tradingview.com/?aff_id=117138
Please note any subscriptions taken via my affiliate link with Trading View may result in me earning a small commission. However, I provide complete transparency on me using Trading View personally – I publish my success on the financial markets via my broker reports and any profits earned were done so by using my own Trading View subscription, so I genuinely do recommend them and have been using the Trading View charts for many years.