In this article i’m going to talk about what’s happening with stocks today. I’m going to look at recent activity, the highs and lows and the current state of price movements. Let’s get straight into it!
Stocks today – Google Class C
To form a view about stocks today in respect of Google Class C (Alphabet) let’s take a look at the monthly and daily timeframes on the Trading View chart software, to get a birds eye view of what has been happening with this stock:
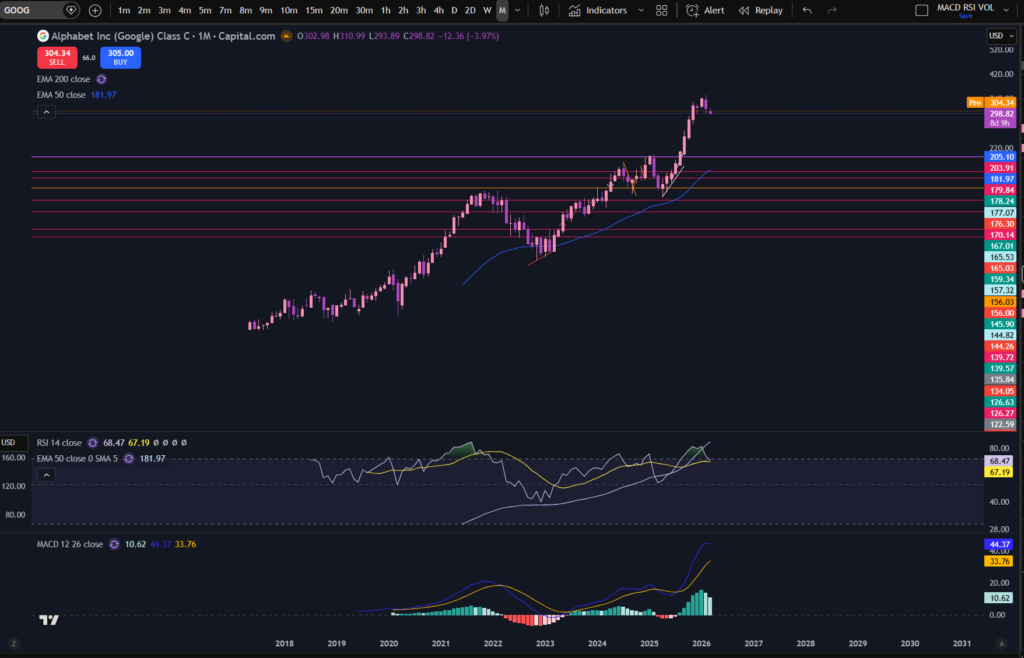
As you can see on the monthly timeframe, this stock reached all time highs recently. A lot of this push upwards is to do with the AI market and expectation that this will generate a lot of revenue for the Tech sector and companies. It reached highs of $350.04 on 2nd February 2026 and has been pulling back since then. The MACD indicator is still green but slowly losing its strength. The RSI, however, has pulled down quite significantly from having been in a very overbought position. It had extended up into the 83.21 position at the highest price reached. Now the RSI is showing 69.03. It’s worth nothing that the previous time this happened back between 2021 and 2022, as you can see on the chart, the prices did descent quite significantly from the highs reached. This dip coincided, however, with increased interest rates as dictated by the FEDS. On this occasion, the FEDS have reduced rates. It remains to be seen, whether the market has finished pulling back or whether it will descent further.
Let’s look at the daily timeframe next:
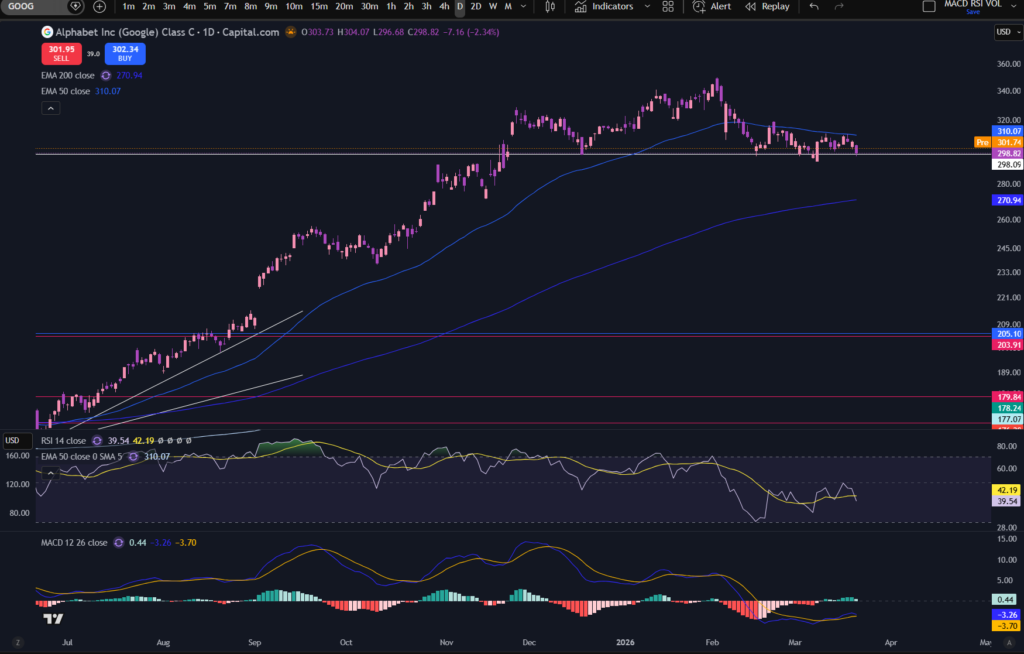
You can see a more zoomed in view of the long term picture, from the daily timeframe, above. The price is currently at a major level of support. It touched it last Friday and remains there currently. I cannot see any sign of recovery from this, yet. The price is still making lower highs and the lows are dotted along the support level. This could be seen as a descending triangle pattern but it is not clear whether the price will break down through the support level. It has touched it at least four or five times – note that the support level became one after a slight resistance previously, in around November time.
Tesla
Let’s take a look at stocks today (Tesla) to see what’s happening. I’ve copied the monthly timeframe chart, below:
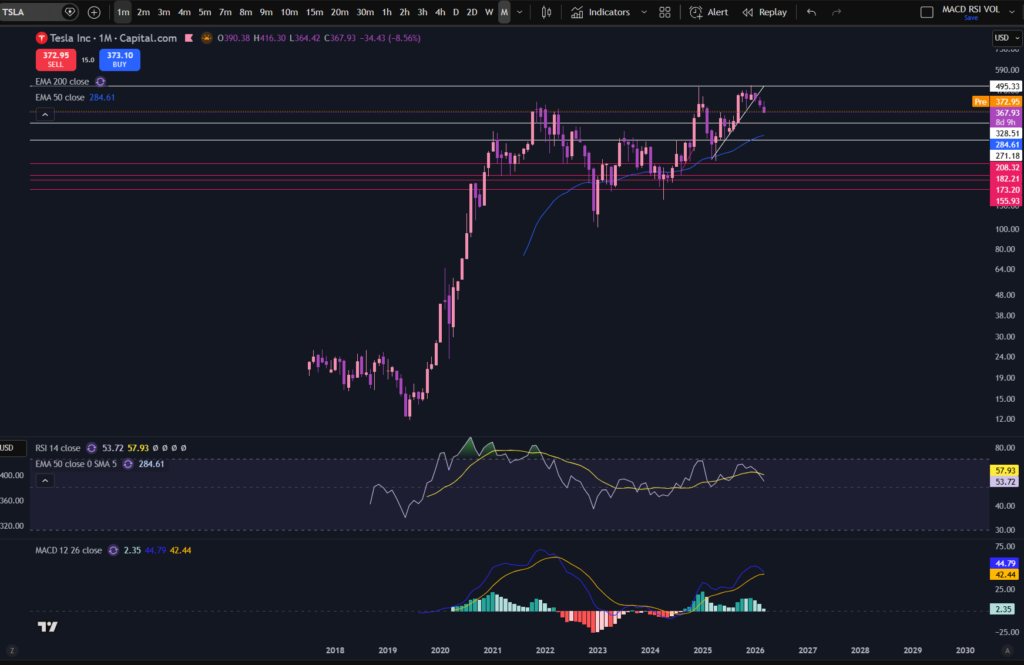
The pattern on Tesla is not very clear to me. It too reached all time highs recently. It’s touched a resistance area a couple of times, at around 495.33. It has pulled back quite significantly on the RSI indicator but note that the MACD and signal lines have not yet crossed over to the downside. A recovery or further downwards push is entirely possible. Let’s zoom in on the daily timeframe and see what else is happening:
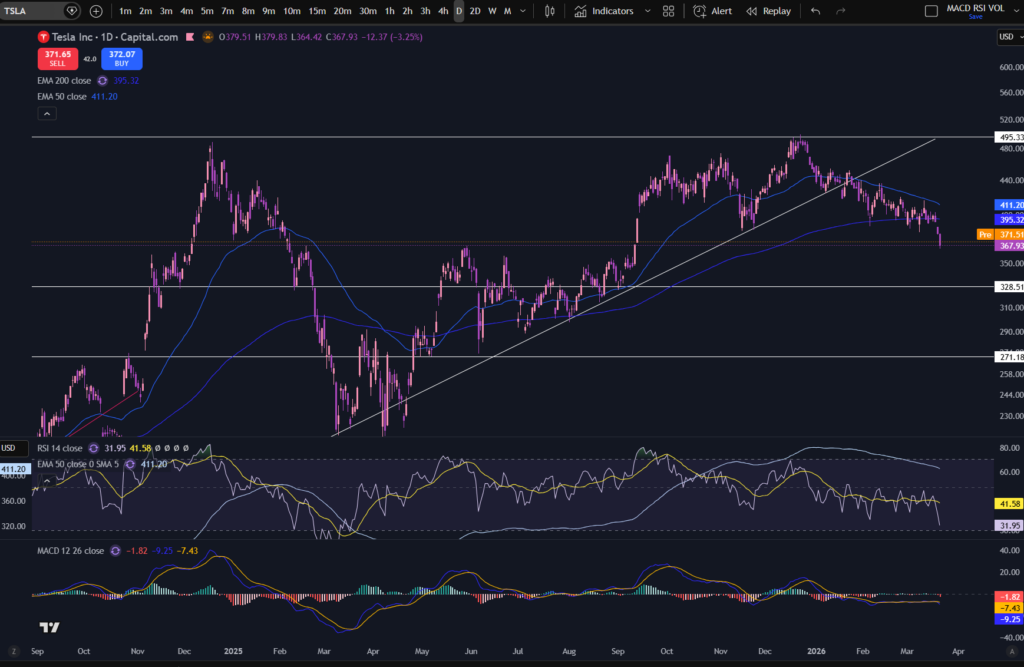
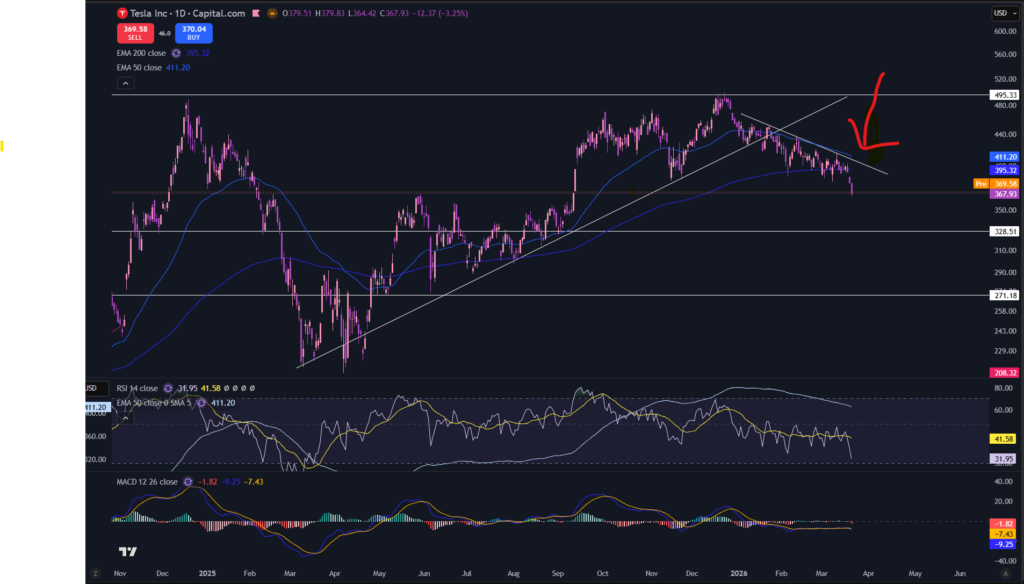
You can see much more clearly, what is happening on the daily timeframe, above. You can see the resistance at the all time highs more clearly and also the slight support level marked at around 328.51 on the chart. It looks to me like the price is still very much in a downward pattern – note that it is currently making lower highs and lower lows – as marked by the diagonal resistance line, here:
The above analysis should give you an idea of what could happen next with this stock, although it is for you to decide upon this and make a critical judgement. There are lots of resources on this blog to help you understand charts, including information on candlestick patterns, here:
Japanese Candlesticks – Trader Pro Consultancy – Learn how to Trade the Stock Market
and also, understanding Support and Resistance levels, here:
Support and Resistance – Trader Pro Consultancy – Learn how to Trade the Stock Market
I hope you found this article on stocks today, helpful.
Disclaimer!
Nothing on this blog should be taken as financial advice or encouragement for you to enter a trade. You are expected to speak to a financial adviser or carry out your own due diligence before entering any positions. Everything on this blog is made for educational purposes and to equip you with the knowledge you need to be able to make your own financial decisions.
For more great tips and advice on trading the stock market, please visit:
To watch me trade live please visit my patreon page here:
https://www.patreon.com/Traderpro8320
Finally, if you would like to receive a discount on the Trading View charting software I use, please click on the relevant link here:
https://www.tradingview.com/?aff_id=117138
Please note any subscriptions taken via my affiliate link with Trading View may result in me earning a small commission. However, I provide complete transparency on me using Trading View personally – I publish my success on the financial markets via my broker reports and any profits earned were done so by using my own Trading View subscription, so I genuinely do recommend them and have been using the Trading View charts for many years.