In this article i’m going to talk about how to use Bollinger Bands for day trading. I’m going to talk about how you can use this technical indicator to give you entry and exit signals, and to show you levels where the price is overbought or oversold. Let’s get straight into it!
How to use Bollinger Bands for Day Trading… but first, what are Bollinger Bands?
Bollinger Bands is a technical analysis tool which was developed by John Bollinger. They can measure market volatility and determine, relatively, whether prices are high or low. The way they work is they contain a simple 20 period moving average (“SMA”), and two outer lines (bands) which are a standard deviation away from the 20 SMA, of + or – 2. The bands expand and become wider around the 20 period SMA at times of high volatility and contract at times of low volatility. This is what the bands look like:
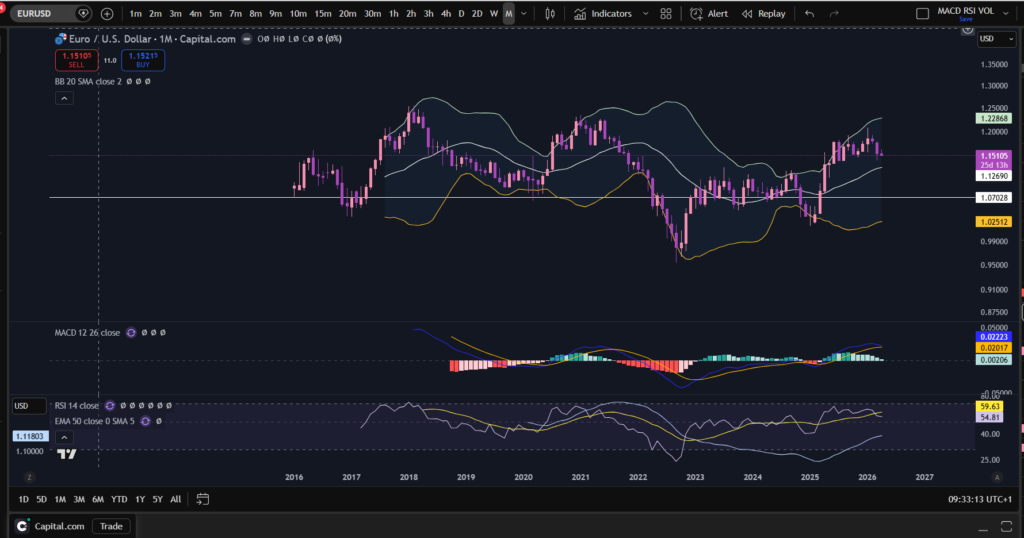
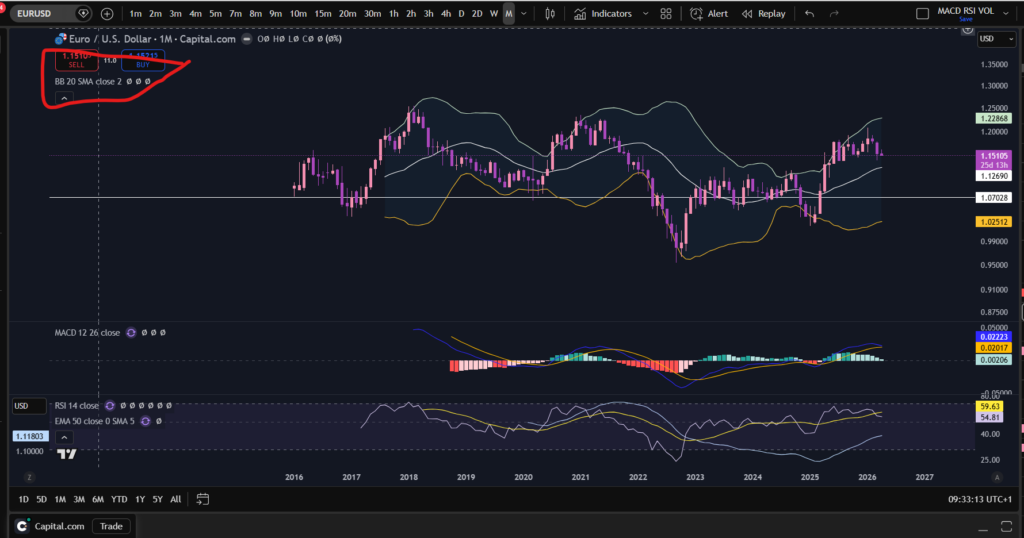
I have shown you what they look like here, using my favourite Trading View platform. If you would like a discount to this software, click the button below!
OK, so as you can see on the above chart, there is a line at the top, a line in the middle and a line below. The top and bottom lines are + and – 2 standard deviations away from the centre SMA line. You can change the settings of the bollinger bands, to use a slightly different SMA period for example, by clicking on the settings, in Trading View, here:
It’s sometimes best to use the default settings – set to 20 period SMA with 2 standard deviations. I have changed the colours on my Trading View charts, because I like using dark mode and the bands show up here, a bit more by changing them to white, light green and light orange.
How can you use Bollinger Bands for entry signals?
So lets talk about how to use Bollinger Bands for Day Trading…With Bollinger Bands you can buy the market when the price goes to or dips down below the lower band, and enter a take profit when it reaches the top band.
Similarly, you could sell when the price is at the top band, and then buy back on a short, when the price reaches the bottom band.
You can also use the bands to follow trends by entering and then waiting for the price to ride up the bands.
How to avoid false signals with Bollinger Bands?
You can avoid false entry signals by confirming the entry with another indicator such as the RSI. To learn about the RSI indicator please see the link below:
RSI Indicator – Sophia Trades – Learn how to Trade the Stock Market
I hope you found this article helpful.
Disclaimer!
Nothing on this blog should be taken as financial advice or encouragement for you to enter a trade. You are expected to speak to a financial adviser or carry out your own due diligence before entering any positions. Everything on this blog is made for educational purposes and to equip you with the knowledge you need to be able to make your own financial decisions.
For more great tips and advice on trading the stock market, please visit:
https://www.sophiatrades.co.uk
To watch me trade live please visit my patreon page here:
https://www.patreon.com/sophiatrades
Finally, if you would like to receive a discount on the Trading View charting software I use, please click on the relevant link here:
https://www.tradingview.com/?aff_id=117138
Please note any subscriptions taken via my affiliate link with Trading View may result in me earning a small commission. However, I provide complete transparency on me using Trading View personally – I publish my success on the financial markets via my broker reports and any profits earned were done so by using my own Trading View subscription, so I genuinely do recommend them and have been using the Trading View charts for many years.