In this article i’m going to talk about how you can read and understand a balance sheet with a view to carrying out fundamental analysis. This is key if you want to rely on fundamentals as a stock market trader. This article may also be useful for junior accountants as a general guide. Let’s get straight into it! In short, every set of financial statements which you will be able to find online about an entity you may be interested in trading, is comprised broadly of a balance sheet, a cash flow, and a profit and loss statement. The balance sheet will give you key information about the health of a company, the position it’s in at a set date (like a snapshot in time), in terms of whether or not it is able to meet its liabilities, how long it is likely to continue trading for etc. The profit statement and the cash flow will be covered in a separate article. I will also provide a separate article on reading balance sheet ratios.
What is a balance sheet – background
The notion of a balance sheet came from the ‘double entry’ accounting concept, thousands of years ago. I believe this originated in China, and it resulted from the double entry accounting method which was used as a way of keeping tight control of money in an organisation. The balance sheet is formed by a simple concept – for every ‘debit’ in a set of financial statements, there is a corresponding ‘credit’. At the end of a period – say, a year, all of the debits will be equal in value to the credits in the accounts. Why does this matter? Why do we make ‘double entries’ in a set of accounts? The idea is that for every asset or liability added to the business, there is a source or corresponding entry to denote what it relates to, or from whom it came, and correspondingly, to whom it will be paid at a later date. For example:
Share capital/premium adjustments – when making an addition to share capital in a set of accounts, we make a ‘credit’ to equity share capital/premium in the company’s accounts, and a debit in the company’s cash records for equal value. The credit denotes that the company owes money to the relevant shareholder. It’s a credit for that person/to that person. The debit records a receipt of an asset for the liability owing to the shareholder – a chunk of cash, which would have been received in the company’s bank account.
Note that debits on the balance sheet represent assets for a company or organisation, and this will feel odd to the reader of this article… mostly we associate credits with ‘good stuff’ but you must understand that the credits in your bank account, represent ‘debits’ for the banker, on the other side of the fence. You are only one party to that transaction. In your banker’s accounts, when you pay money into your bank account, they make the following entries:
Debit cash – assets for the bank
Credit liabilities – to Joe Blogs – (we as the bank, owe him this money which he can withdraw from an ATM whenever he likes etc).
Now, back to the balance sheet! I’ve explained that assets on a balance sheet are debits and liabilities are credits. As I explained, at the end of a period like a year of account, all of the debits for the assets recorded, will equate to the same value of ‘credits’ in the same period. In this way, the company will have a record of all assets, and the people to whom money is owed for those assets. The money could be owed to shareholders as i’ve illustrated above, or directors – by way of directors’ loans… it could also be owed to a bank – again, it’s the same concept… in the company’s accounts, they will debit cash, credit liability to HSBC or whichever bank is involved.
Balance Sheet – the features you will see
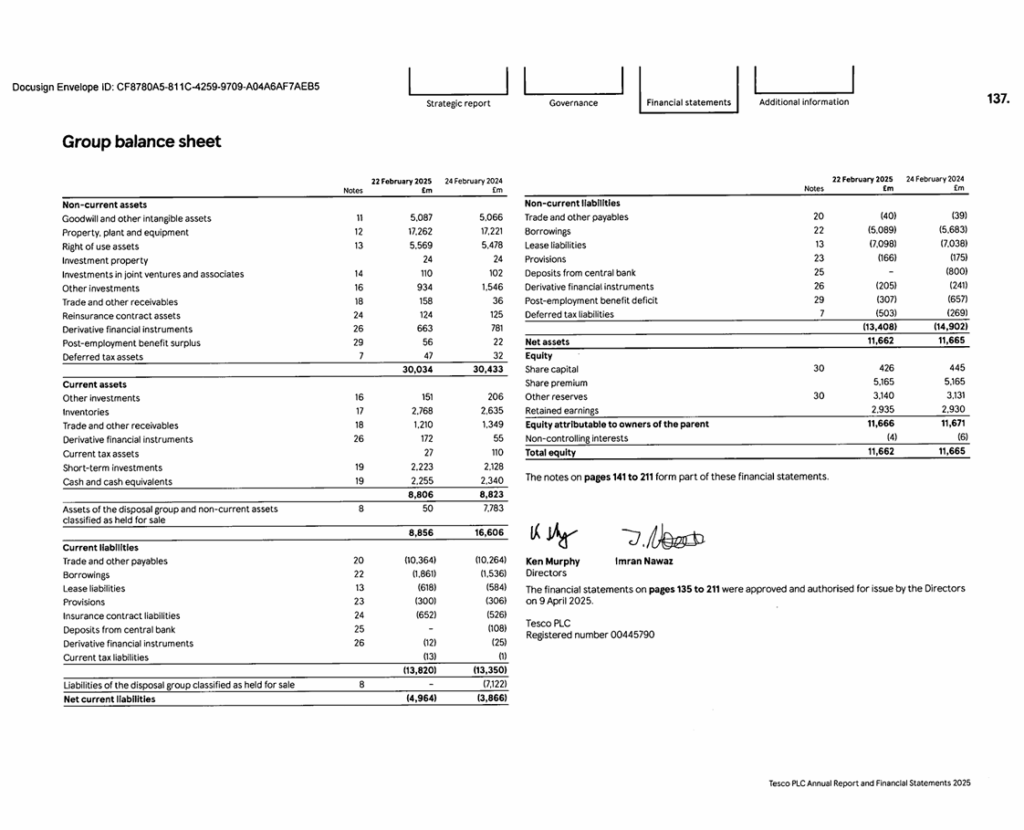
OK so now that i’ve explained to you what a balance sheet actually is, and how it comes about, let’s take a look at some real life examples. I’m going to show you the balance sheet of a well known retailer (Plc). PLC stands for ‘public liability company’. This means anyone can buy its shares. They are traded publicly on an open stock exchange. Let’s take a look at Tesco Plc’s balance sheet for the last year as published…
I’ve gone to the Companies House website in the UK and filtered for Tesco Plc, and then ‘accounts’. Anyone can retrieve this information from Companies House in the UK in respect of UK registered companies. This is free for the UK. However, there will be equivalent registries for companies in the United States etc for which there could be a charge payable.
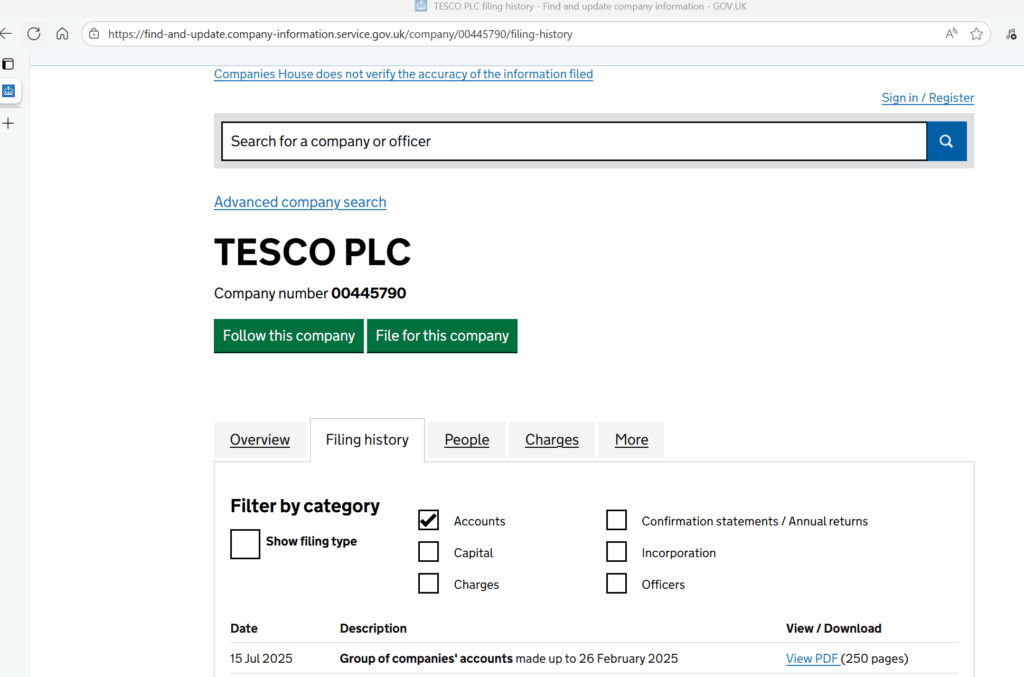
Here is the link for obtaining this data… note that this search function is not restricted to PLCs. You can also retrieve information about ‘Selfridges’ the retailer on Oxford Street, for example, which is privately owned. You will not find Selfridges in your trading broker account.
TESCO PLC filing history – Find and update company information – GOV.UK
Group balance sheet vs Parent balance sheet – what’s the difference?
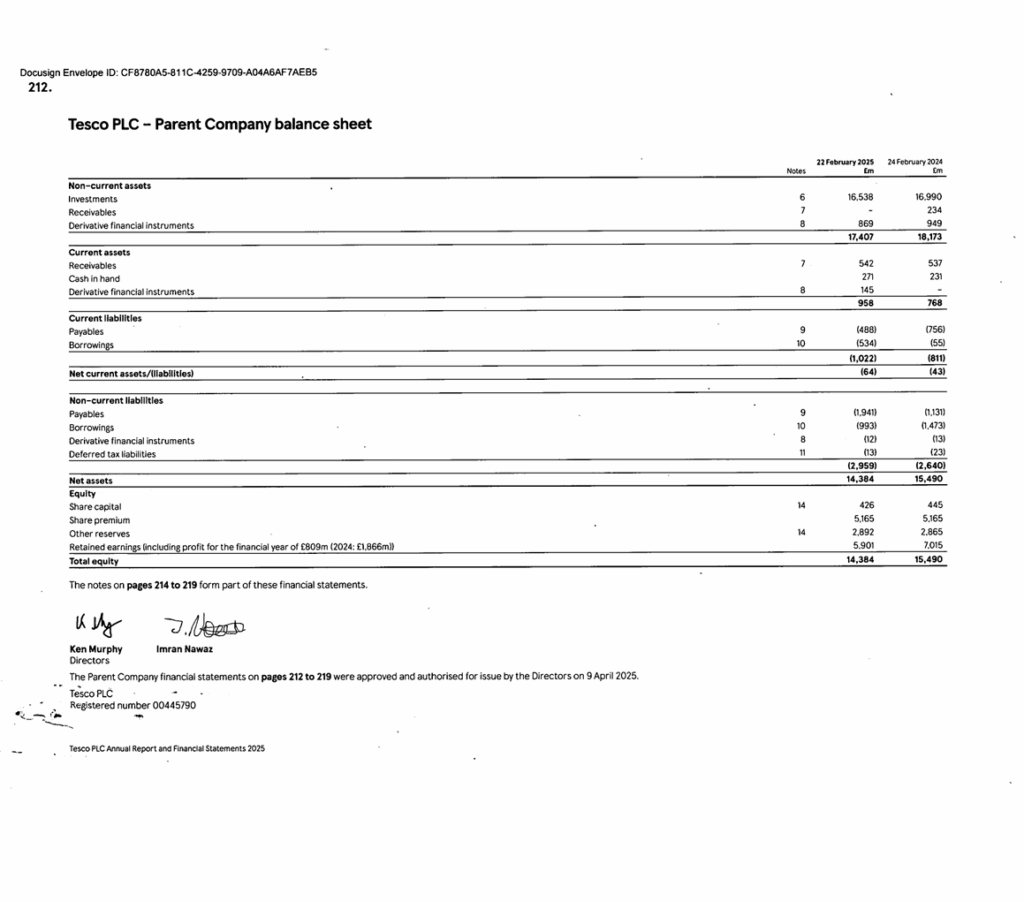
OK, so the first thing to note, is that there are two balance sheets… why is this? One of them relates to the ‘parent company’ only. It represents all of the assets and liabilities recorded in relation to the legal entity of Tesco Plc, solely. In contrast, the Group balance sheet, will also include the assets and liabilities of all of the company Tesco Plc’s, ‘SUBSIDIARIES’. Every time Tesco Plc buys another legal entity’s shares, and holds the controlling shareholding (>50%), it will have obligations and rules to follow in terms of reporting what the newly acquired assets and liabilities are in those subsidiaries, along with its own assets and liabilities. In the accounting world, once a parent obtains ‘control’ of another entity, it is viewed, almost like it’s the ‘same company’. Its basically the same people running both. The numbers are presented in group accounts, like it’s the same legal entity therefore.
Health of a company – a quick glance!
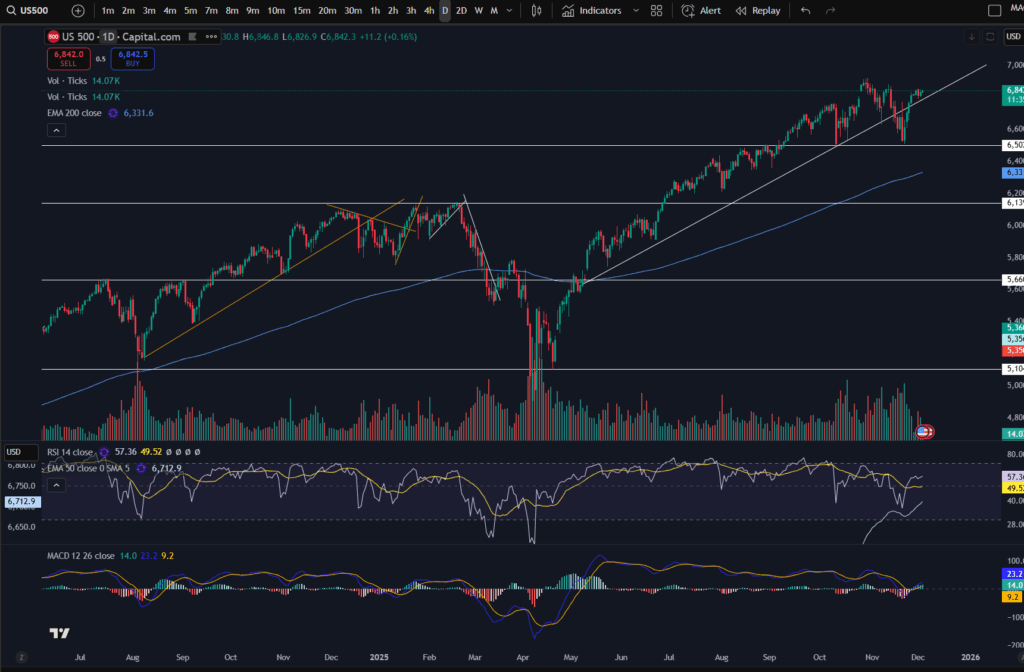
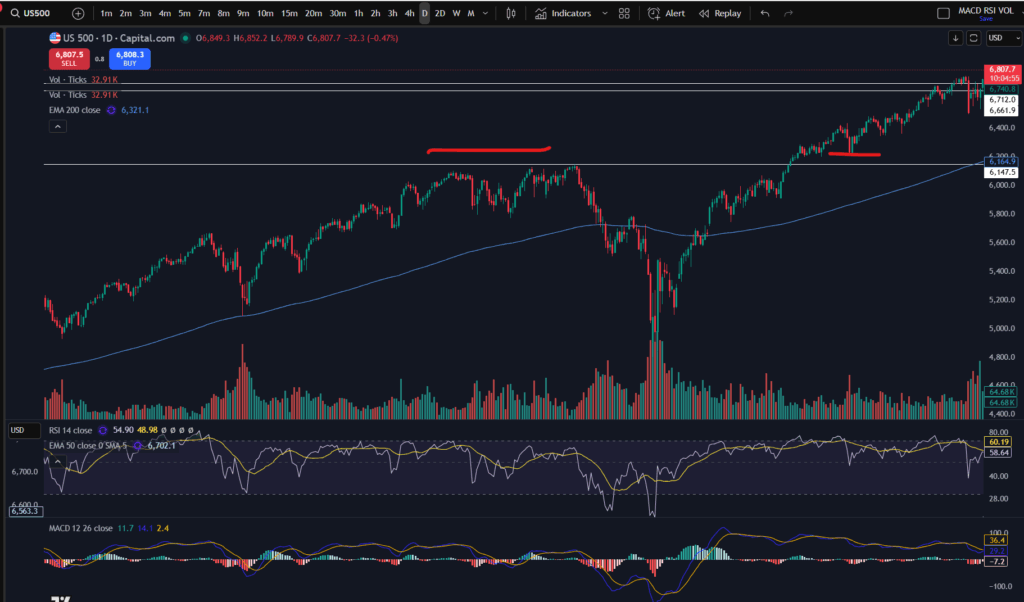
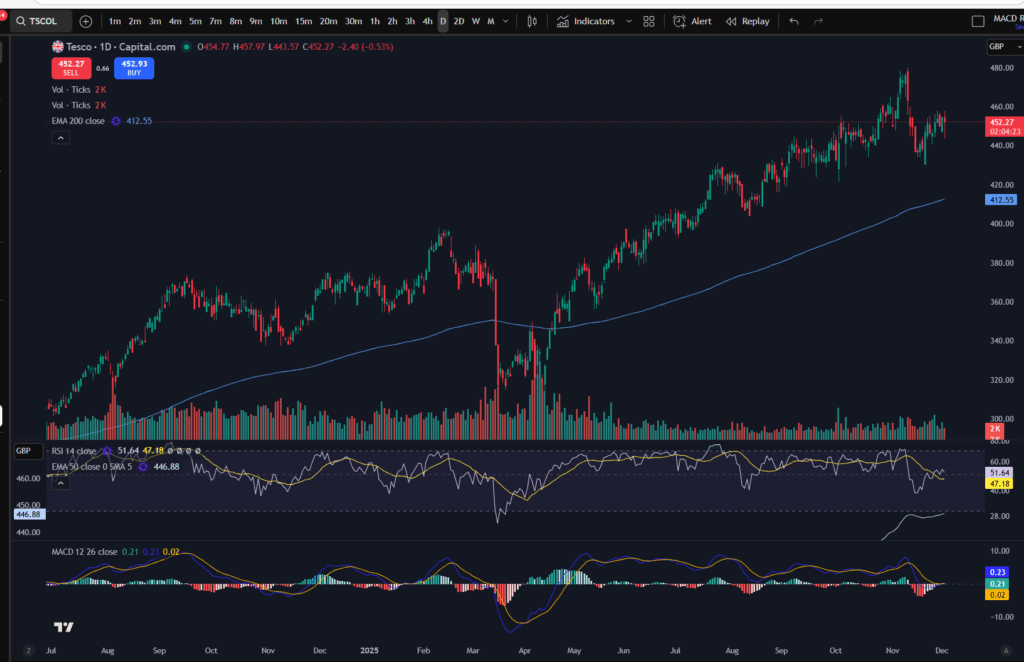
Before we get into what the actual assets and liabilities are, it’s important to note whether the company is in a position of net current ‘assets’ or net current ‘liabilities’. If a company is in a net current liabilities position, this is not a great sign as a start! It means the amount of assets it could convert into cash within the next year, will not cover the amount of liabilities the company is due to pay/discharge within the next year. As you can imagine, a company in this net liabilities position, may be finding things a struggle in terms of meeting liabilities as they fall due. Tesco’s position is that it is in a net liabilities situation, with assets recoverable within one year of £8.8m and it’s liabilities due within one year are £13m! I thought it might be interesting to take a quick glance at the company’s stock chart – when you compare this type of information, this is where it can get interesting! Interestingly, the company’s share price is growing per the daily timeframe below… obviously the net liabilities position is not something you will see simply by looking at the charts… if you are worried about a net liabilities position, you should most certainly check the directors’ statement in relation to ‘Going Concern’ and also the auditor’s statement on this.
Assets
As you can see, Tesco Plc has got a number of assets listed on its balance sheet. I’m going to talk about the group accounts going forward, since any time you buy shares in Tesco Plc, they will be affected by the performance of any of its subsidiaries too.
Let’s run through the items listed on the balance sheet, and I will tell you what they likely relate to…
Non current items:
What do we mean by ‘non current’? These are items which are going to mature/become payable after one year from the date of reporting.
Goodwill – this is an accounting adjustment which recognises and puts a value on, built up trust and reputation in any subsidiaries acquired. You don’t really need to focus on this very much when considering the company’s health.
Property, plant and equipment – this relates to property used in the business (not investment property), plant and machinery – any computers, tools, diggers, cars – basically anything which is purchased for the purpose of ‘running’ the business. Investments are categorised separately. These types of assets are held on the balance sheet at a value which is made up of cost less depreciation. (A regular adjustment is made to reduce the value on the balance sheet to represent the use of the asset over time – and this is known as depreciation).
Rights of Use assets – there was an accounting rule change a few years ago, and any leases now need to be recognised on the balance sheet either as liabilities or assets. In this scenario, the rights of use assets probably related to rented premises.
Investment property – this is where any properties held for investment purposes, where the company is receiving rental income, will be held. The values there represent the market value of these properties.
Investments in joint ventures and associates – these are investments in companies where Tesco Plc does not own the ‘controlling’ shareholding. It does, nevertheless, own some shares in other businesses as you can see.
Other investments – I have not checked the detail of these but note that you can check the notes to the accounts and you will find a ‘balance sheet note’ in respect of each item listed on the balance sheet. If you are unsure of what something relates to, you can check the notes to find out more information.
Trade and other receivables – these assets relate to contracts where other companies and people owe Tesco some money. A typical example is where another retailer may be selling some of Tesco’s goods and they owe Tesco money for items received. It could also relate to money paid on account, by Tesco to its suppliers. Until they ship something to Tesco, the ‘cash’ held at the other supplier company, is still owing to Tesco. ‘Other receivables’ could be staff loans, HMRC balances due to Tesco – for eg. where they have overpaid tax. Note that these items are non current. Typically, trade receivables such as supplier accounts, will fall under the current category (i.e. due within one year).
Reinsurance contract assets – these are amounts which are ‘recoverable’ from insurance companies. They are due to be paid/discharged to Tesco.
Derivative financial instruments – these can be complex financial instruments. It could be where the company has hedged its foreign exchange exposure for example – a ‘forward’ contract guarantees that Tesco can purchase another currency at a particular rate in the future, for a set period of time. This contract is a derivative financial instrument. It can be a liability or an asset, depending on which way the exchange rates have gone compared to the rate achievable under the contract.
Post employment benefits surplus – this is likely an accounting adjustment relating to employee liabilities. It could relate to holiday pay owing to the staff for example.
Current assets
Current assets are items which are payable or will become due, within one year. This is important for your fundamental analysis!!
Some of the items here are self explanatory – inventories for example – how much stock the company holds. The assets under ‘current’ assets are listed in order of liquidity (how quickly they can be converted into cash, with cash at the bottom).
Trade and other receivables – we talked about these above. These ones will be payable/due within one year.
Current tax assets – these are amounts due from the tax man payable within one year.
Short term investments – these are investments which are expected to mature within one year.
Cash and cash equivalents – this is what it says on the tin! It will be the amount of cash in the company’s bank account. Cash equivalents can represent assets which are very liquid and exchangeable almost immediately – like vouchers for example.
Current Liabilities
The liabilities listed under ‘current’, are all payable within one year.
You can see that the company has got some typical liabilities you would expect for a food retailer –
Trade payables – this is the amount due to its suppliers within one year
Borrowings – this will relate to the ‘current’ part of any bank loans payable
Lease liabilities – this could be for plant and equipment or rental premises
Provisions – these can relate to potential law suits or ongoing ones. It is likely that the accountants will ‘assume’ some will be inevitable, and they will estimate an amount each year. They could also relate to expected warranty claims in manufacturing businesses.
We’ve talked about the other current items as assets, so when they appear under the current liabilities section, they represent the amounts Tesco owe to someone else, for the same items.
Non Current liabilities
These represent items which are payable by Tesco after one year’s time. The items listed are self explanatory in light of my notes above.
Equity
This is generally where the share capital and premium goes – if you buy a share in tesco for £1, your £1 share credit will be sitting in this section of the accounts with your name attached! They also pay out dividends from this area.
This area collects profits each year which accumulate (or losses!!). These go under ‘retained earnings’. Note that the company will not legally be allowed to pay out dividends if they have negative reserves.
Other reserves can include adjustments such as uplifts on investment properties when they are revalued at market rates, intermittently.
The Non Controlling Interest section represents the value of any shareholdings held in the subsidiaries which are not owned by the parent company. It may be that Tesco Plc owns 60% of the shares of a company it has consolidated into its group accounts, but the other 40% of shares is owned by ‘Joe Blogs’. His shareholding goes under this NCI section.
Comparative periods
All parts of the financial statements of a company or organisation, will have comparative periods or balance sheet dates. These are very useful if you want to see the ‘direction’ the company has gone in, over the last year. For example, a negative movement on the reserves could mean a company has made a loss, in the absence of any dividend payments. A volatile cash balance may not be a good sign – especially if it’s decreasing year on year to an unhealthy level. Similarly, check out the company’s liabilities – which direction are they headed in? Does their growth, seem healthy? Any company will have a healthy level of debt but note should be made of the scale of this and what direction it’s going in!
Summary
This article was intended to give you a basic fundamental understanding of what a balance sheet is, and I hope it has achieved this. Watch out for subsequent articles on a company’s cash flow statement, balance sheet ratios and profit and loss statement. These will follow soon!
Understand my strategy in full:
Trader-Pro | Strategies for success in the financial markets | Patreon
For more great tips on trading the financial markets, please visit my blog:
Discount on Trading View:
https://www.tradingview.com/?aff_id=117138
Finally, thank you to my existing members on Patreon, and for your likes, comments and subscribes. Happy trading!
Please note any subscriptions taken via my affiliate link with Trading View may result in me earning a small commission.