In this article i’m going to talk about the key differences between fundamental and technical analysis. Should you use fundamental or technical analysis in your trading? Which one is more profitable? Let’s find out…
Fundamental or technical analysis – what is fundamental analysis?
In a nutshell, traders who perform fundamental analysis look at the ‘fundamentals’ behind a company – they consider the company’s balance sheet and financial statements. The consider directors’ reports and any other information they can get hold of about the company, in order to predict future price movements. This might include using key ratios on the company’s balance sheet, to assess the company’s health or liquidity. The ratios used are not covered in this article. I just want to explain to you what the difference is between these two different approaches to analysing the markets and making trading and investment decisions. Some of the ratios can be used to determine a ‘value’ for a company and therefore, by dividing this value by the number of shares issued, you could derive an estimate of what the company should be priced at in terms of share price, and then see if you can see a discount to this as a purchase opportunity. Such ratios include the company’s P/E ratio. These types of ratios give an idea of how much the company can earn vs the amount of investment you would need to put down to purchase the shares.
It is my intention to post another article explaining some of the key balance sheet ratios and how you can use these to assess the health of a company. Watch out for this.
Fundamental or Technical analysis – what is technical analysis?
Technical analysis does not rely on the financial statements directly and other documents and information. Technical analysis is performed by analysing patterns on the stock charts. The stock charts can give indications of places where there is strong buying or selling pressure by noting patterns of price rejection at these levels. These can be used to predict future price movements. If you would like to understand more about technical analysis, there are plenty of articles on this blog to help you get started. Let’s look at an example of some areas where this price action can be noted:
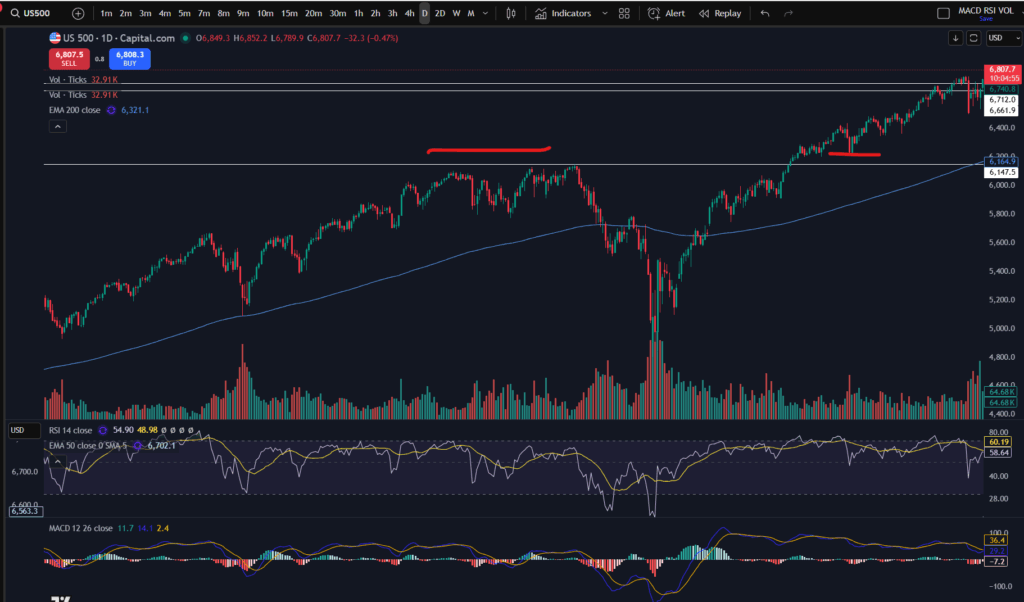
Note on the above chart how the price met some resistance at around 6,164.9 – where I have applied a horizontal support/resistance line in white to the chart. The price bumped on this level a few times and then sailed down very low – what this tells me, as a technical analysis trader, is that the price met a lot of selling pressure at that point. The highs could not be sustained – the buyers became depleted in the market – they did not believe the price was worth more than this level, at that time. This lack of buyers affected the volume of transactions in relation to people ‘buying’ which in turn drove the price down further.
Note that once a price becomes a resistance area, it can, subsequently become a support – note how after the price went past this level some time later, it dipped back down to ‘test’ the level – where I have marked the chart in red, before ascending further up. These patterns are common and can be seen in every stock chart across the markets. So the volume, and demand, which I can see on the chart, tells me a lot about how the share should be priced – it’s almost real time information as opposed to looking at the fundamentals.
So how does one method compare to the other?
Note that I stated technical analysis does not rely ‘directly’ on the fundamental analysis/documentation. However, the price which plays out as patterns on a stock chart, is ‘driven by’ the company’s fundamentals. As a technical analysis trader, I do not perceive these two methods as distinct – I understand that the price patterns I use on the chart, are driven by the fundamentals. I am a qualified chartered accountant by vocation, so although it would be very easy for me to check a company’s fundamentals, I personally, feel that the charts tell me everything I need to know. Therefore, the question of fundamental or technical analysis and which one is better or more profitable, is a bit of a misnomer.
I do keep aware of general major news in the markets and how this may affect what I would like to trade – for example, Trump’s tweets on tariffs and how these have been affecting Apple. However, in the most part, I rely on the technical analysis to give me an idea of when to invest or trade, where to invest or trade and most importantly, when not to!!
One of these methods is not necessarily going to make you more money than the other – it is best for you to become a ‘master’ of what you are doing, and develop skill in either one – this will help you best to make more profit.
I hope you found this helpful in terms of understanding fundamental or technical analysis.
I also published a video on YouTube which you may find helpful:
Understand my strategy in full: https://www.patreon.com/Traderpro8320
For more great tips on trading the financial markets, please visit my blog:
Discount on Trading View:
https://www.tradingview.com/?aff_id=117138
My performance in the live markets:
https://sophiatrades.co.uk/category/my-performance-statistics
Finally, thank you to my existing members on Patreon, and for your likes, comments and subscribes. Happy trading!
Please note any subscriptions taken via my affiliate link with Trading View may result in me earning a small commission.