In this article i’m going to talk about the current and recent positions of the NASDAQ with a view to answering the question ‘can you make money on the NASDAQ right now?’. I’m going to examine the recent highs and lows and what’s happening with some of my preferred indicators. Let’s jump straight into it!
Can you make money on the NASDAQ right now – recent activity
The NASDAQ is currently going sideways. It has been doing this for a long time. What does this mean? Markets can either go up, down or sideways, and sometimes they go sideways to consolidate – to allow breathing before pushing higher, or to test limits and supports before they lose strength and pull right back. You should think of a sideways market as a battery charging…. it’s building momentum to either go up, or down. When they go sideways for a long while, it can give the market a breathing space which is equivalent to the market pulling down/back – because time is passing by and the market is not reaching high prices. It allows the momentum to reset itself and you can see this on some of the indicators I like to use, like the RSI and the MACD. To help us answer the question about whether we can make money on the NASDAQ right now, let’s take a look at the daily time frame chart:
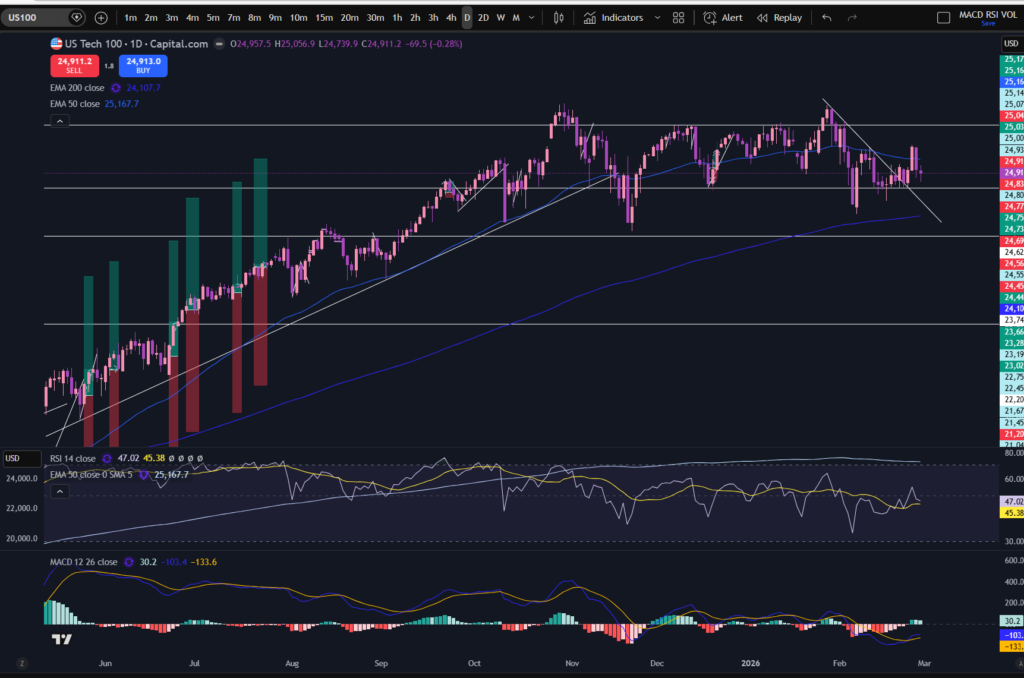
As you can see, the market reached an all time high in mid October and since then it’s been drifting through a channel sideways. It did touch the previous high in February but since then it descended further. You can see the diagonal down trend line I had recently applied to the chart, which the price has now bust through! The price is now back at the horizontal support again and it’s bounced away from it with a hammer candlestick pattern. If you would like to understand more about candlestick patterns, please see the relevant section of my blog, below:
Japanese Candlesticks – Trader Pro – Learn how to Trade the Stock Market
The MACD made a cross over to the upside, below the zero level of the histogram and this can be recognised as an upward push momentum but it remains to be seen how long it will last. This is the zone where the price bust through the diagonal resistance line above. In order to answer the question more fully, ‘can you make money on the NASDAQ right now’ we need to also consider the higher time frame for a birds eye view. Note: I am not in the habit of always considering the monthly timeframe – it depends. On this occasion I consider it is necessary, since the price has gone sky high recently so it may be coming to the end of a long term upwards push.
Let’s also take a look at the bigger picture – the monthly timeframe
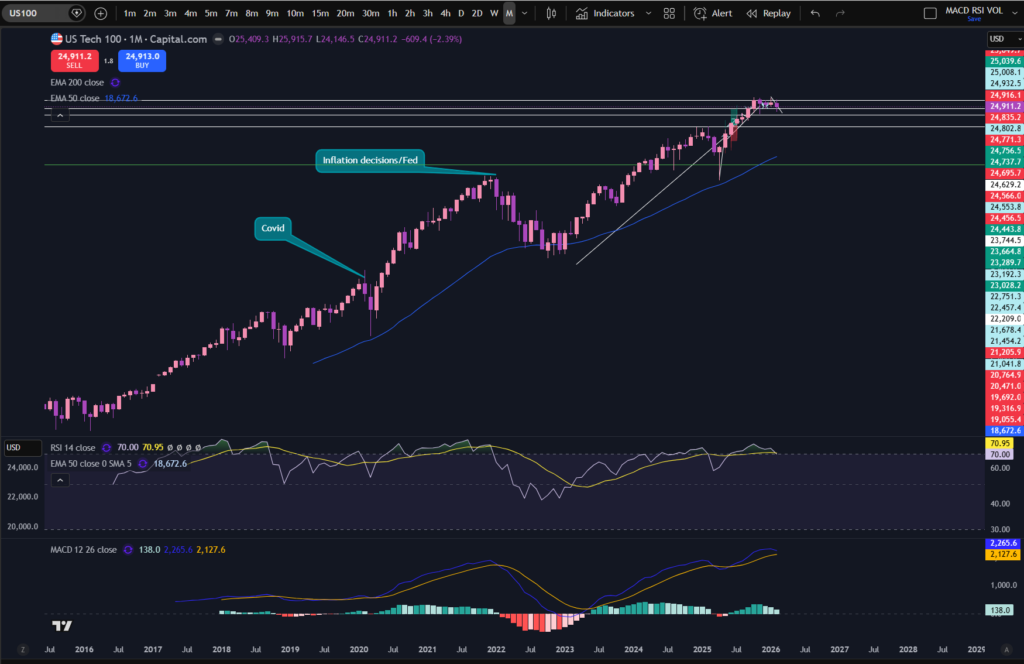
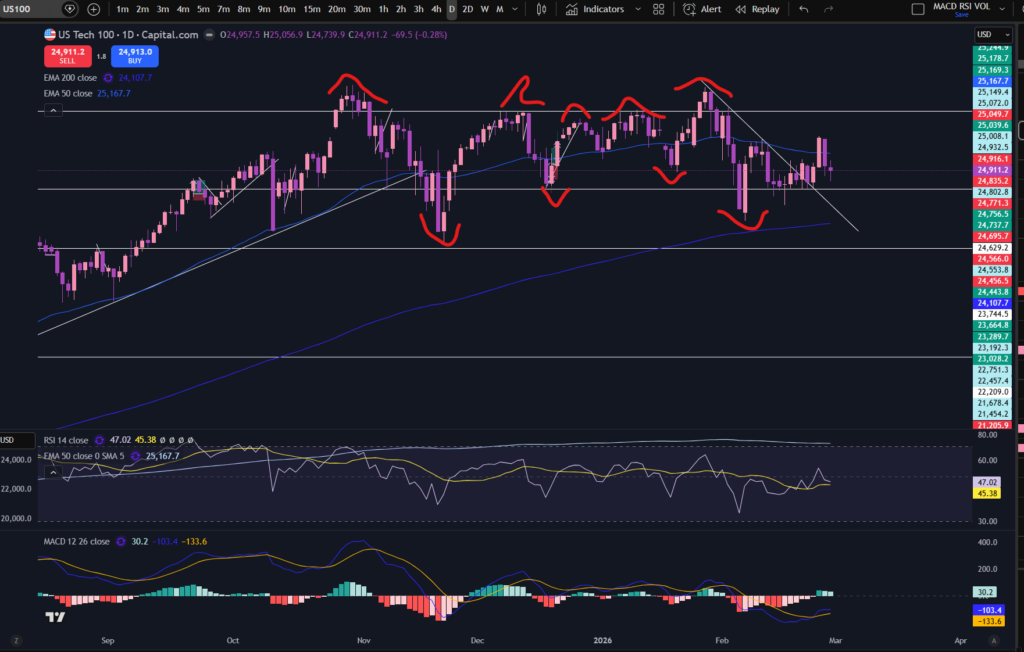
As you can see on the monthly time frame, the MACD indicator is losing momentum for upwards push – the histogram bars have gone from dark to light green and they are becoming smaller and smaller. The MACD and signal lines look like they are in a position where they could cross over to the downside. However, note that in the time the market has been going sideways, the RSI indicator has pulled back slightly meaning the price is not as expensive as it was at the peak and this is what I meant by a sideways movement allowing the price to recharge and gain energy. You can see from historical RSI movements on this chart, that the little dip which has happened recently on the RSI indicator, can sometimes be enough of a pull back for it to go up again. It is not clear what will happen next – I am simply waiting for confirmation. What do I mean by this? I’m waiting for the market to make higher highs and higher lows again. Going back to the daily timeframe, I have marked in red the recent highs and lows. At the moment the market is in a position where it is moving away from a ‘lower low’ so definitely not pushing up enough for me yet… and so I wait!
I hope you found this article helpful in answering your question, can you make money on the NASDAQ right now?
Disclaimer!
Nothing on this blog should be taken as financial advice or encouragement for you to enter a trade. You are expected to speak to a financial adviser or carry out your own due diligence before entering any positions. Everything on this blog is made for educational purposes and to equip you with the knowledge you need to be able to make your own financial decisions.
For more great tips and advice on trading the stock market, please visit:
To watch me trade live please visit my patreon page here:
https://www.patreon.com/Traderpro8320
Finally, if you would like to receive a discount on the Trading View charting software I use, please click on the relevant link here:
https://www.tradingview.com/?aff_id=117138
Please note any subscriptions taken via my affiliate link with Trading View may result in me earning a small commission. However, I provide complete transparency on me using Trading View personally – I publish my success on the financial markets via my broker reports and any profits earned were done so by using my own Trading View subscription, so I genuinely do recommend them and have been using the Trading View charts for many years.