In this article i’m going to take a look at stocks today: what’s been happening in the markets since market open. I’m going to consider the overall position of the NASDAQ, the S&P 500 and Gold as these can give a good overall indicator of market direction. Let’s jump straight into it!
Stocks today the NASDAQ
I mentioned yesterday that the NASDAQ had been recovering from it’s recent downwards move, and it had broken through the downward diagonal trend line. Today the market opened with a gap down, but is recovering again with a positive candle:
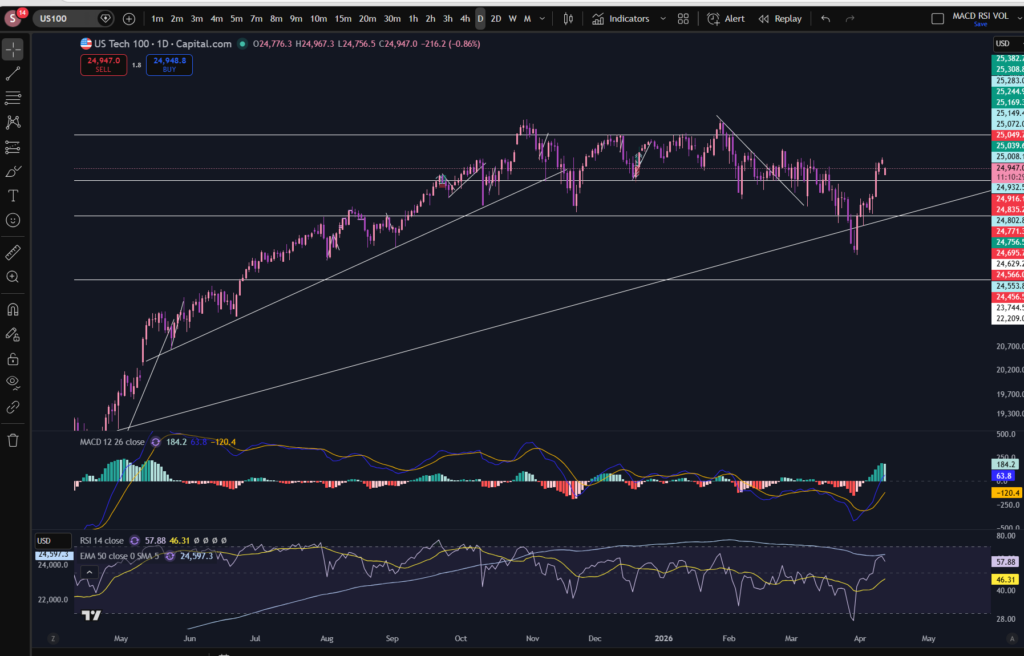
However, note that the MACD indicator histogram bars have slightly shrunk since yesterday and they are getting slightly smaller. We still have market open in the US to come, and that may have a big impact. The RSI is scooping over slightly too. It looks from the above chart, like the momentum for the upwards push has slowed down. It remains to be seen whether this will be reinforced at market open in the US.
Let’s take a quick look at the S&P 500 to see if we see a similar story:
Stocks today – S&P 500
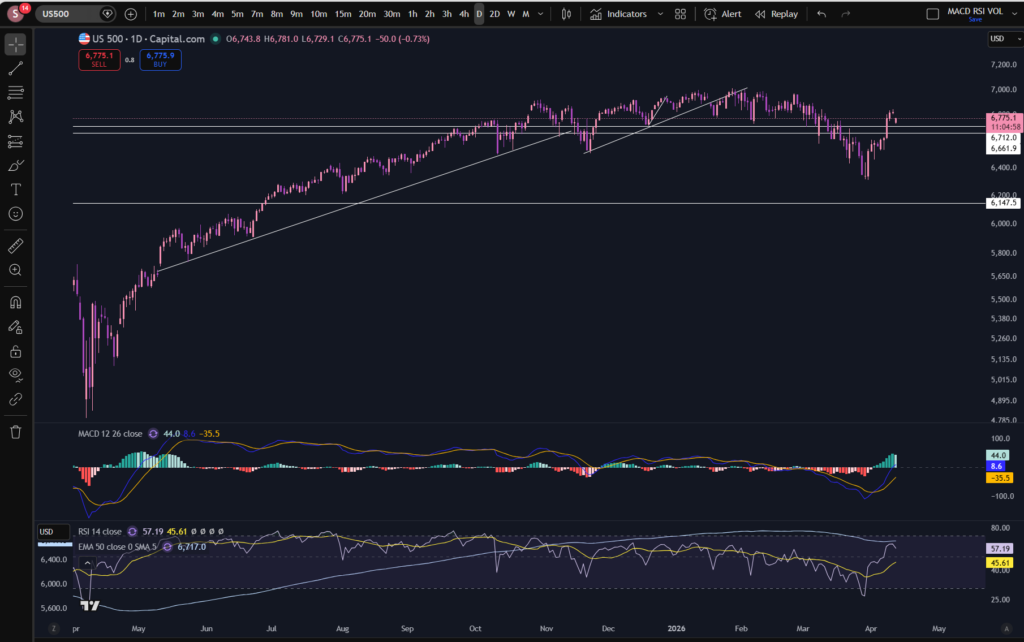
As you can see, the S&P 500 is showing a similar story and this is not surprising because it is heavily driven and influenced by the NASDAQ with its top constituents being companies which are also sitting on the NASDAQ.
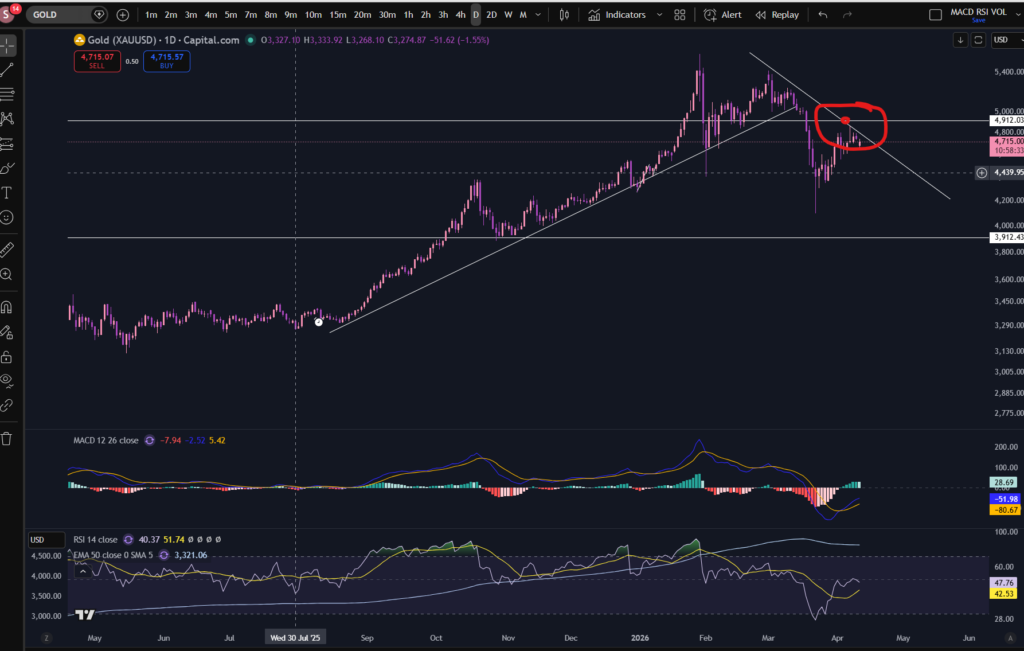
What’s happening on Gold?
In considering stocks today it is also useful to pay attention to what is happening to the price of Gold. When stocks are increasing due to consumer confidence or confidence in the financial markets in general, the price of Gold tends to pull back. Let’s take a look at the Gold chart:
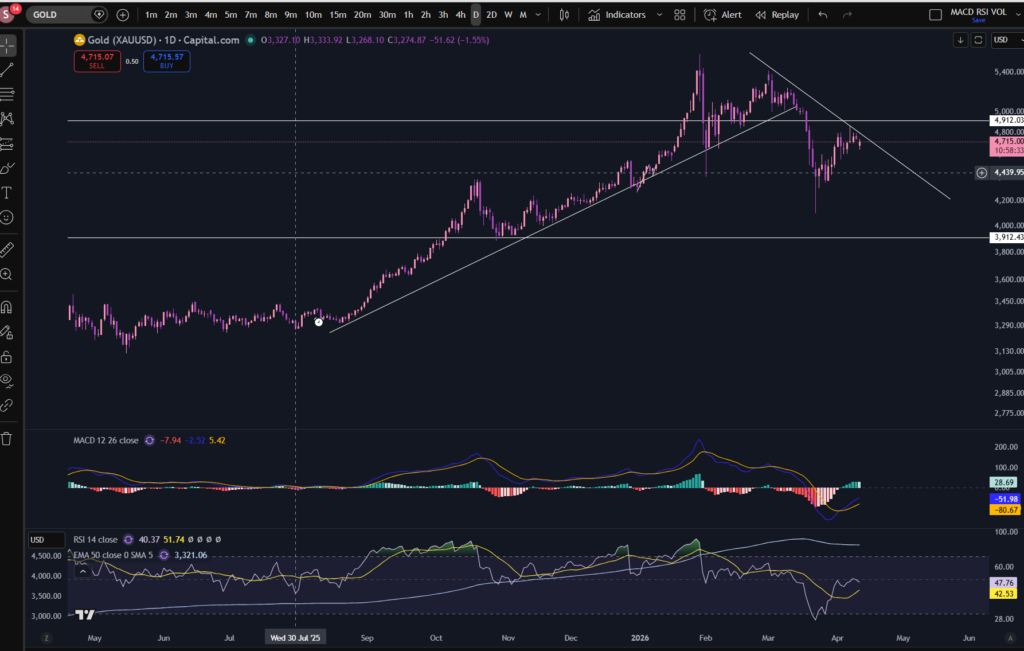
As you can see above, we now have another candle which at the moment, is respecting the downward diagonal resistance line shown on the chart. It seems Gold and the stock markets are indeed showing the relationship we normally see from them… Gold is coming down overall currently and has been since around the beginning of March. It’s worth noting that Gold is also, at another resistance level – the horizonal one. Pushes away from such areas can be stronger where there are two different resistance lines intersecting one another, as shown below. It remains to be seen whether this trend will continue and the resistance levels will be respected.
I hope you found this article helpful. Please check back again for further updates and technical analysis on the current states of the market.
Disclaimer!
Nothing on this blog should be taken as financial advice or encouragement for you to enter a trade. You are expected to speak to a financial adviser or carry out your own due diligence before entering any positions. Everything on this blog is made for educational purposes and to equip you with the knowledge you need to be able to make your own financial decisions.
For more great tips and advice on trading the stock market, please visit:
https://www.sophiatrades.co.uk
To watch me trade live please visit my patreon page here:
https://www.patreon.com/sophiatrades
Finally, if you would like to receive a discount on the Trading View charting software I use, please click on the relevant link here:
https://www.tradingview.com/?aff_id=117138
Please note any subscriptions taken via my affiliate link with Trading View may result in me earning a small commission. However, I provide complete transparency on me using Trading View personally – I publish my success on the financial markets via my broker reports and any profits earned were done so by using my own Trading View subscription, so I genuinely do recommend them and have been using the Trading View charts for many years.