In this article i’m going to explain how to paper trade on Trading View. I’m going to talk about some specific methods you can use which are extremely helpful when you are learning to be a stock market trader. These methods will mean literally zero risk for your portfolio. I will also explain some of the differences which can catch new traders out, once they trade in the live markets and find it feels different to paper trading. Let’s jump straight into it!
First of all, what is paper trading?
In order to understand how to paper trade on Trading View, it’s a good idea to get a firm foundation on what paper trading is, how it is used, its benefits and drawbacks.
Paper trading is used to test a strategy or idea for making money in the stock markets without risk to your funds. You can place ‘paper’ trades, meaning you are not using real money on the trades and then monitor whether they would have been a win or loss. You can accumulate this knowledge by applying the set up rules of your entry and exit points, over and over, to see whether, in the long term, the plan will end up making money. There are different ways to paper trade. It’s referred to as paper trading because some people literally have a note book and note down their planned entry points, and exit points, monitor the price and see whether it goes to target or their proposed stop loss position.
Another way to paper trade, and perhaps an easier way, is to use chart software, such as Trading View.
How to Paper Trade on Trading View
One way of learning how to paper trade on Trading View, is to use the alerts feature and the trade planning tool. Allow me to demonstrate how to paper trade on trading view, using this method… Let’s take the S&P 500 chart in Trading view, on the daily timeframe, as an example:
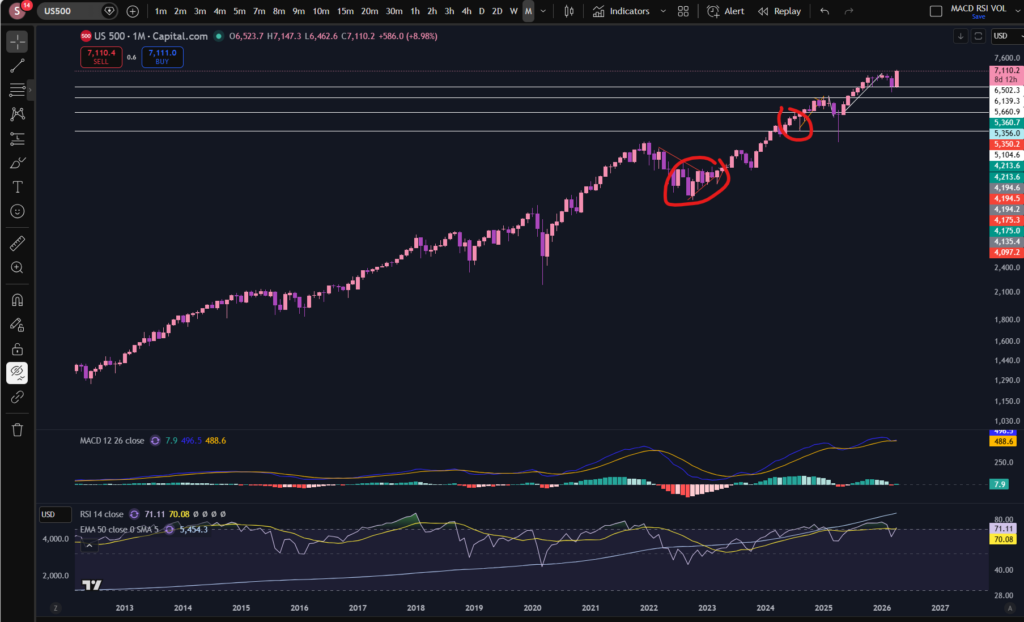
Let’s say your plan is to get into this market when the price dips down on a pull back in an uptrend, and then take profit when it reaches previous highs. I’ve marked on the screen shot above, an example of this. Now, let me show you the trade planning tool which you could use at the point you are planning your trade:
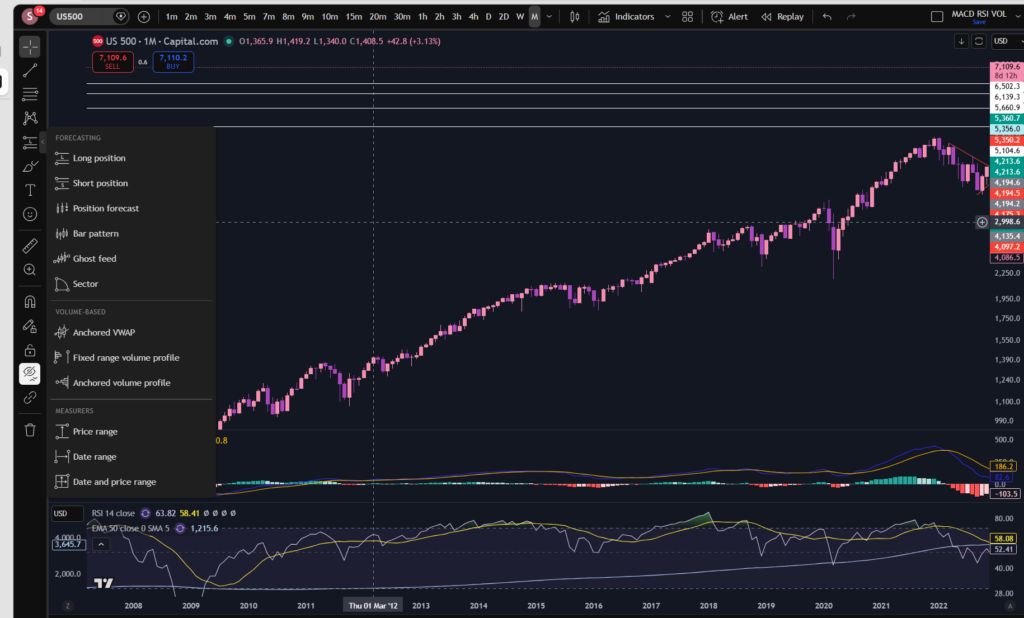
You can go to the menu on the left and pick ‘long’ position. This will bring up a little diagram on the chart where you can change its parameters to plan the entry point, take profit and stop loss. I’ve moved the chart across so that we can only see what we would see had we been planning this trade before it reached previous highs. This is what the diagram looks like on the chart:
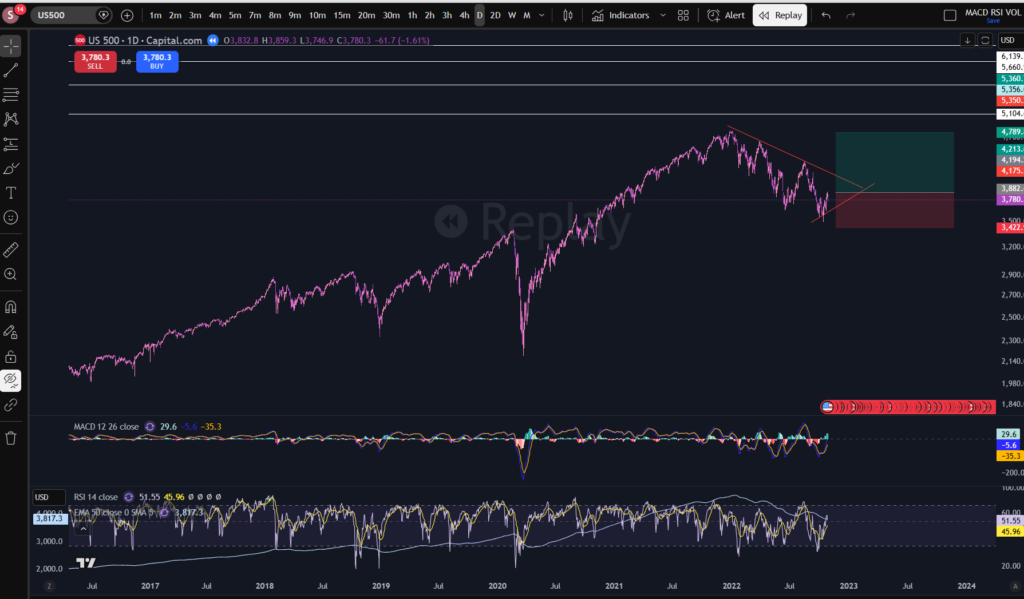
I’ve used the Trading View ‘replay’ tool to take the chart back to the entry position. I will explain the replay tool in a subsequent blog post, so watch out for this. As you can see, i’ve added the trade planning diagram for a long position, to this chart. The middle section where the red meets the green, is where the entry would be according to this type of plan. You would probably want to put a stop below the previous low of the trend, and this is where the red section extends to underneath the entry position. We said this would be a strategy where we take profit at the previous high, so this is where the green section extends to.
Now, what makes Trading View amazing for paper trading, is that you can set alerts at those levels marked with the diagram, as follows:
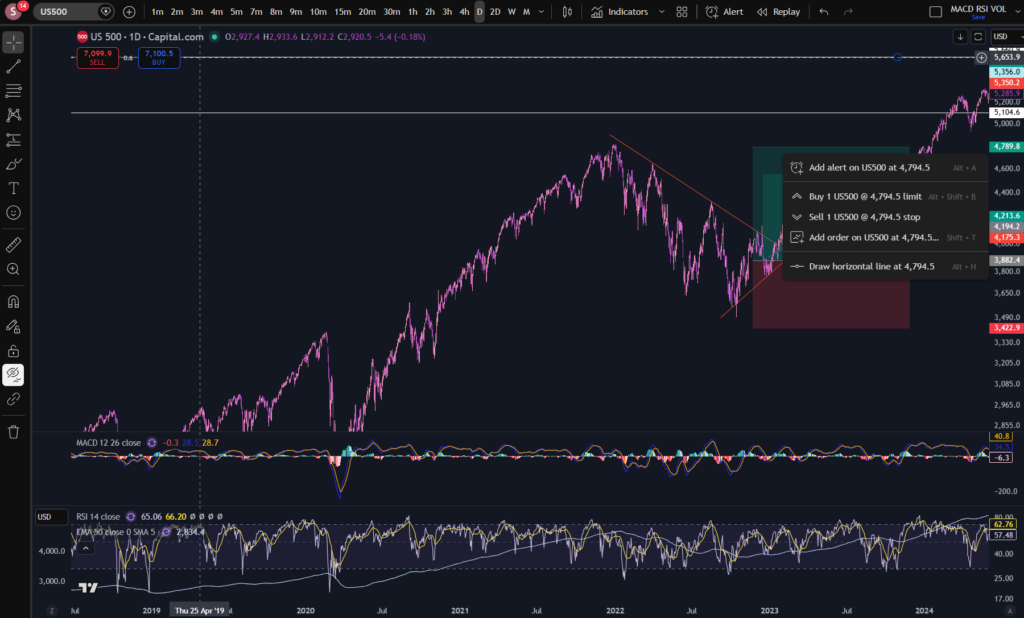
I can’t show you the alert being set in replay mode – it has to be done in the live market. So I right clicked at the top of the green section, and as you can see, it has a + sign with a clock, to set an alert on the chart at the price of 4,794. Once you go to set this alert, you can tell it to email you or notify you via push notifications:
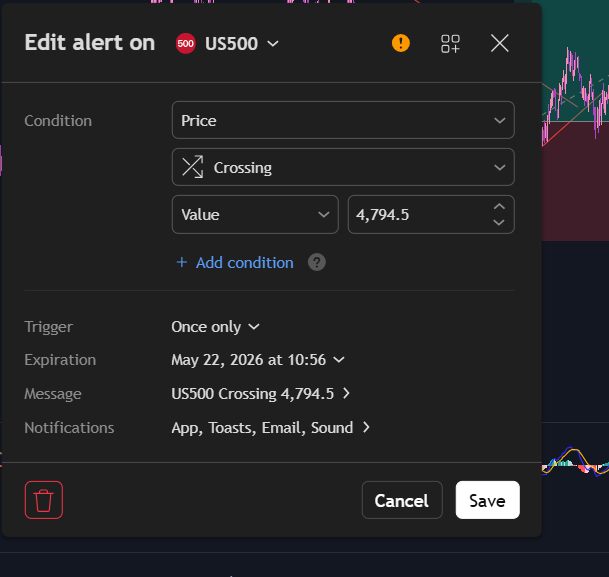
You can see i’ve set alerts in the app, via email and it will ping me with a sound when the price crosses 4,794.5.
This is just one very helpful way of planning paper trades using Trading View. There is another way, however.
Trading View Paper Trading Tool
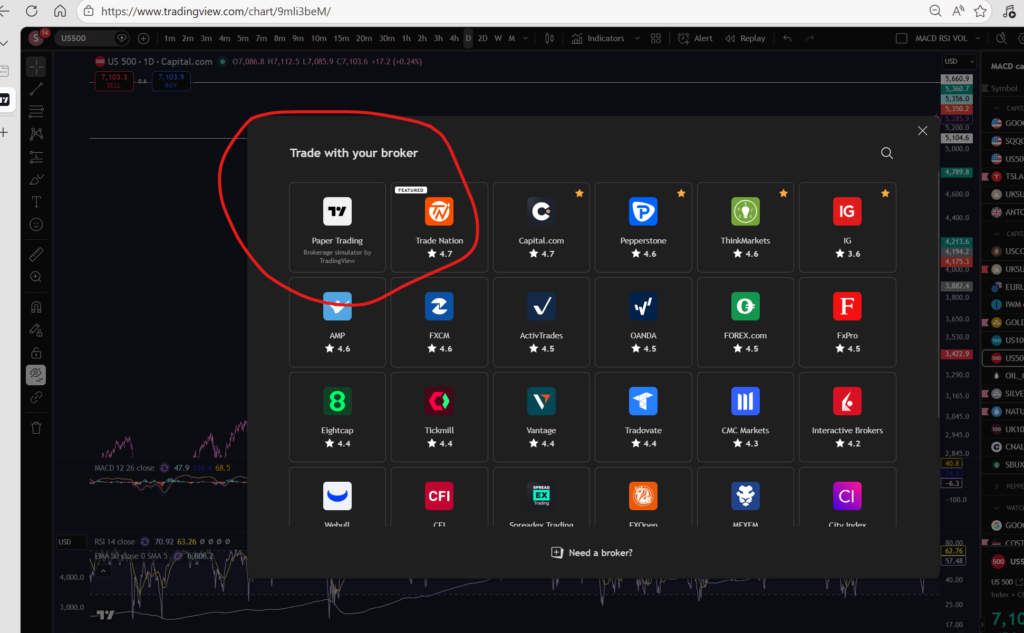
Another way to learn how to paper trade on Trading View, is to use the paper trading tool which is built into the platform. Trading View has got, built into it, a ‘paper trading’ module, accessible at the top right, when you click on Trade. It will bring up a brokers list, and you can either log into your broker account or use the Trading View module, highlighted below.
This feature is amazing. It basically records everything in your paper trading for you – like real trades. It will keep a record of your balance and whether it’s growing or not after each trade:
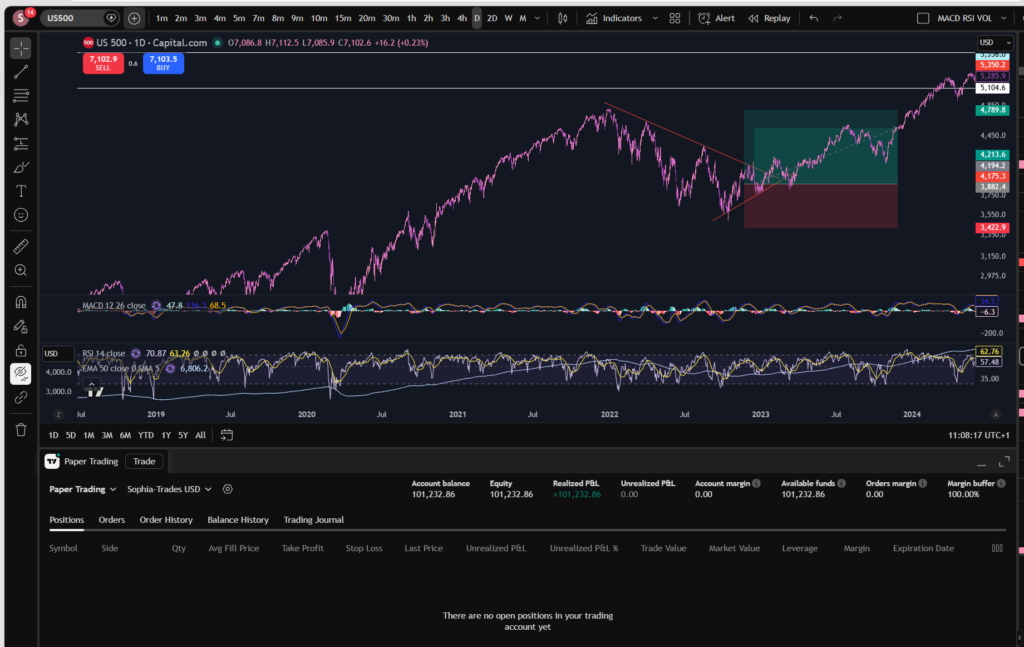
It records the history of what has happened in the log below the chart. It shows you open ‘paper positions’ and to get into these, you simply log into paper trading via Trading View, and go to ‘buy’ and the software will execute a ‘paper’ trade for you and it will be sitting in your trade log of open positions. I believe it gives you about 100,000 to spend as starting capital. You can see i’ve got an account balance of 101,232.86 above.
I hope this helped you to understand how to paper trade on Trading View.
If you would like to see my You Tube video on paper trading, please see the linked video, below:
Disclaimer!
Nothing on this blog should be taken as financial advice or encouragement for you to enter a trade. You are expected to speak to a financial adviser or carry out your own due diligence before entering any positions. Everything on this blog is made for educational purposes and to equip you with the knowledge you need to be able to make your own financial decisions.
For more great tips and advice on trading the stock market, please visit:
https://www.sophiatrades.co.uk
To watch me trade live please visit my patreon page here:
https://www.patreon.com/sophiatrades
Finally, if you would like to receive a discount on the Trading View charting software I use, please click on the relevant link here:
https://www.tradingview.com/?aff_id=117138
Please note any subscriptions taken via my affiliate link with Trading View may result in me earning a small commission. However, I provide complete transparency on me using Trading View personally – I publish my success on the financial markets via my broker reports and any profits earned were done so by using my own Trading View subscription, so I genuinely do recommend them and have been using the Trading View charts for many years.