Stocks today – everything you need to know

Stocks today – everything you need to know

In this article i’m going to talk about the stocks today, and recent activity on the NASDAQ and S&P 500. This is another follow up to some of my other recent articles on what’s been happening in the markets. The markets are being affected by the Iran war so we have to bear this in mind when considering whether or not to open more positions. Let’s take a look at the charts…

Stocks today – NASDAQ

Stocks today

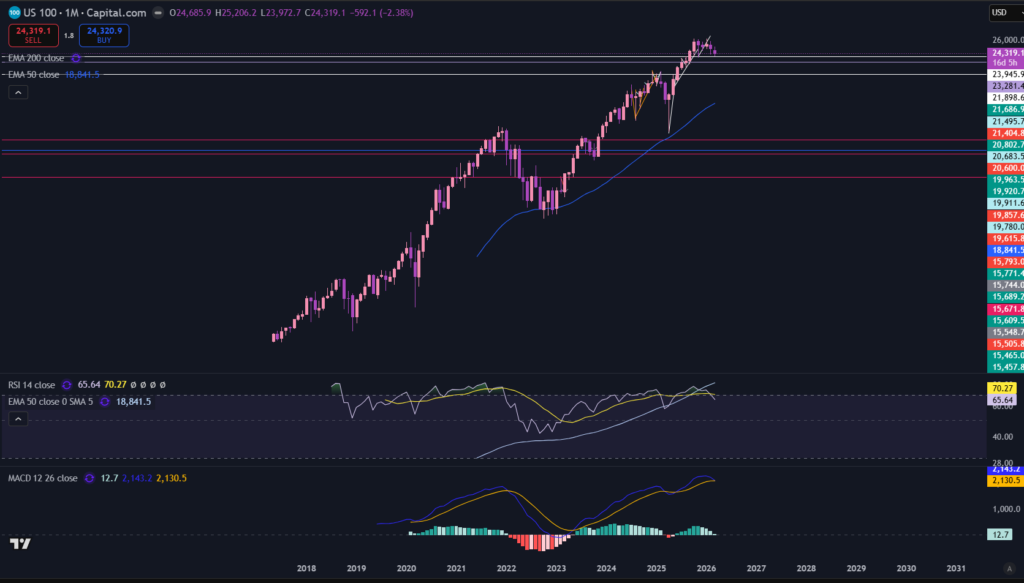
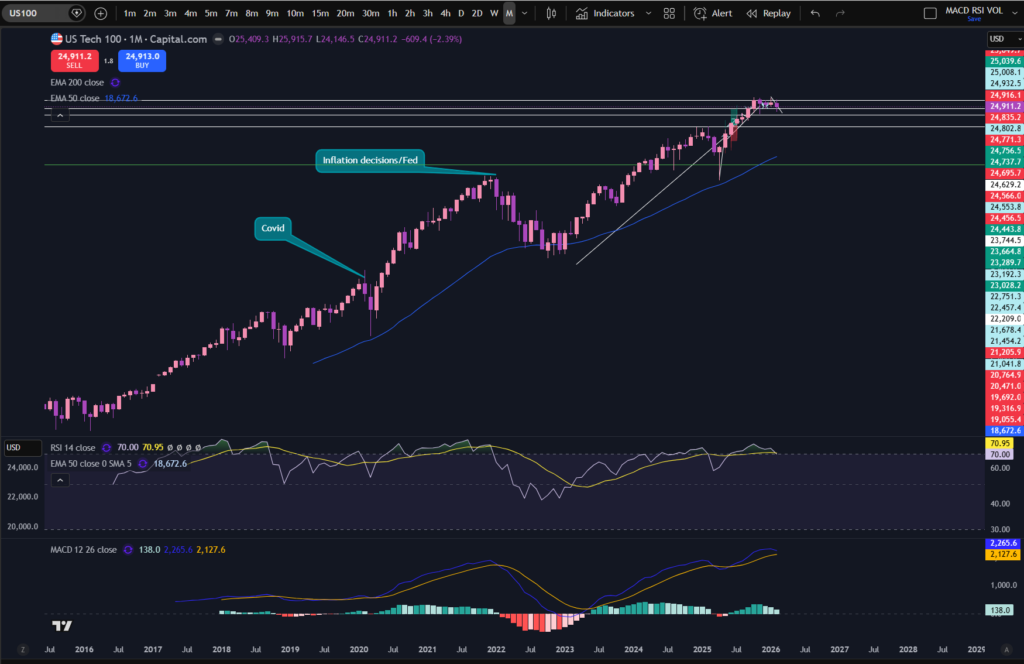
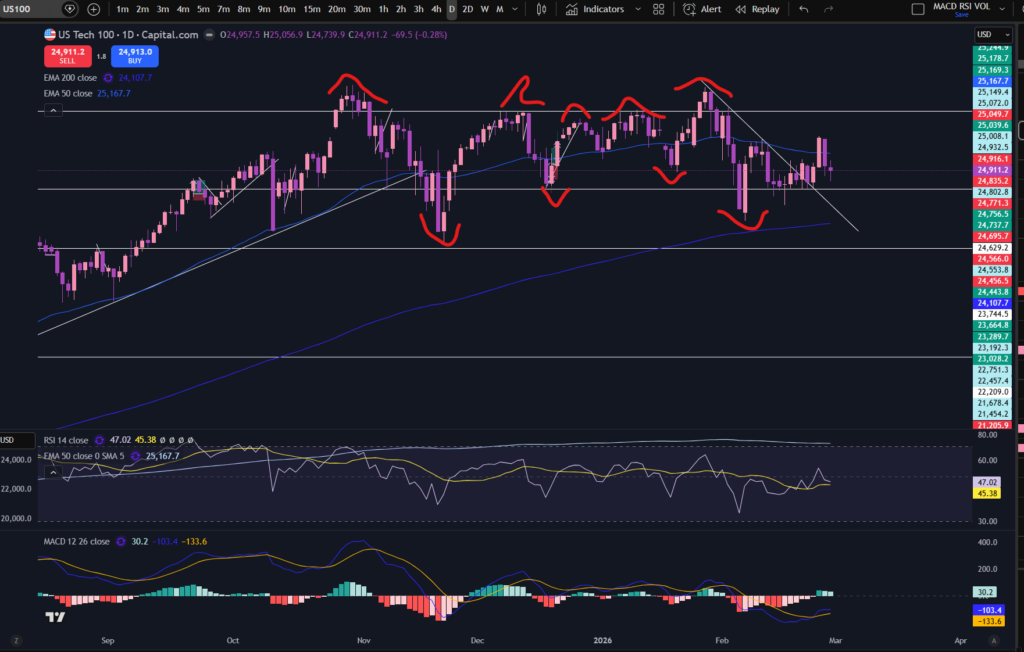
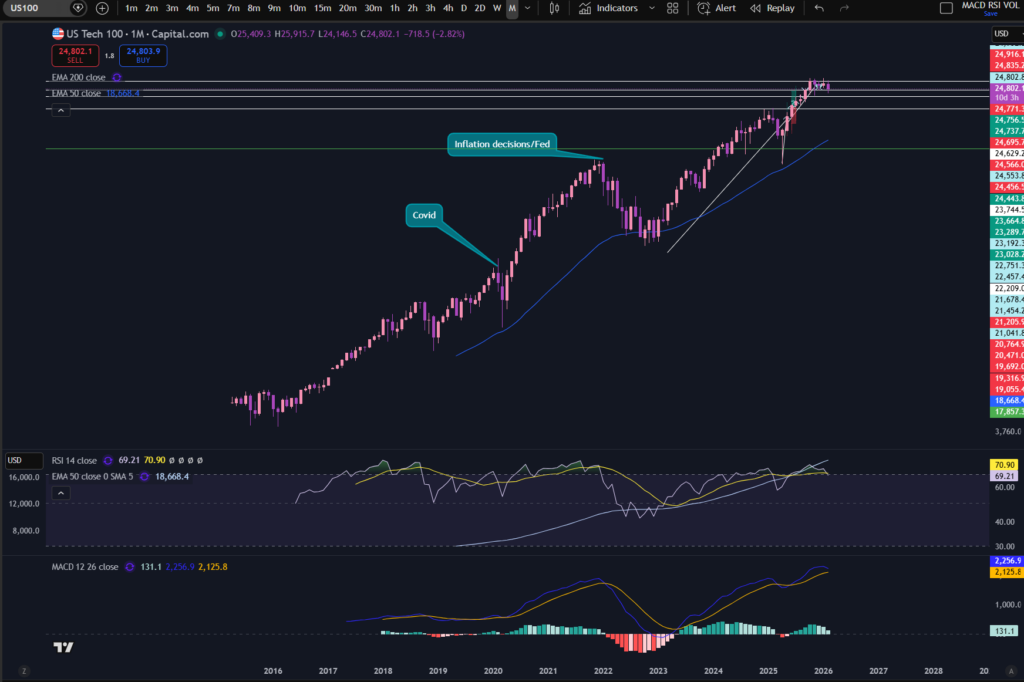
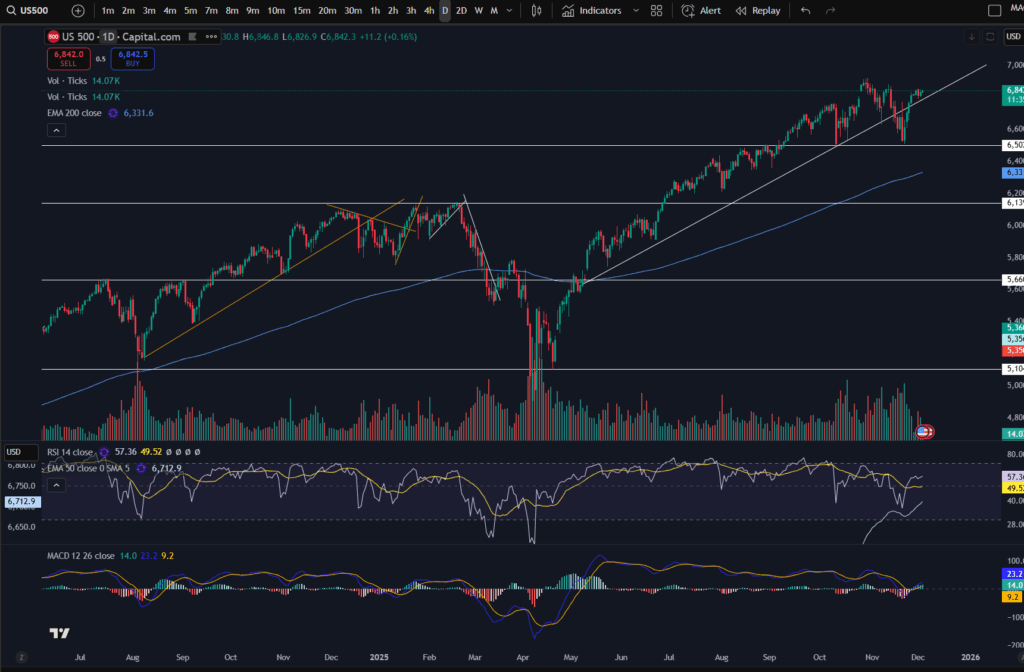
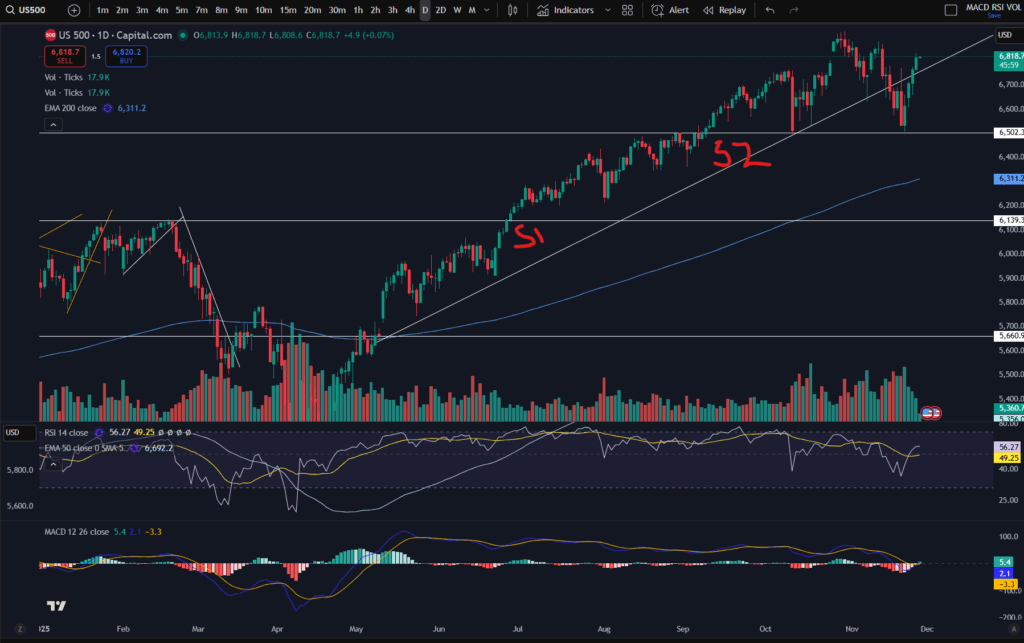
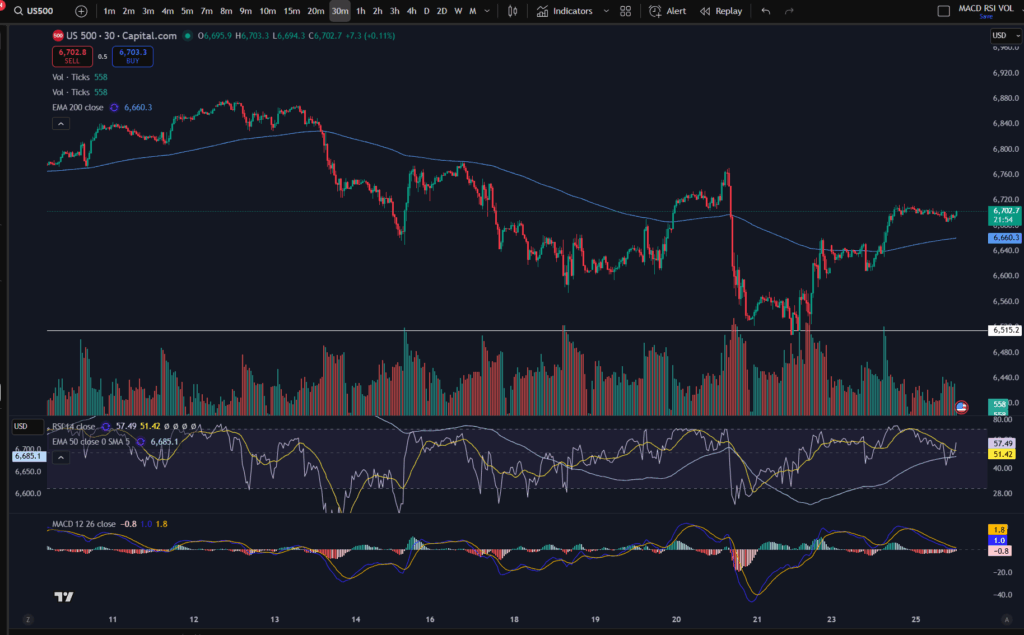
I like to consider the NASDAQ and the S&P 500 before zooming in and trying to establish which stocks may be good for closer attention in terms of ‘stocks today’! As you can see, there is no sign of any recovery yet, from the above chart. The price descended to a major support level on Friday and rebounded away from it, as can be seen by the last purple candle on the above chart. You can see the price touched the support level and then was pushed higher buy buyers coming in! Note the longer wick on this candle, a bit like a hammer pattern. To understand more about candlestick patterns, please see the following link:

Japanese Candlesticks – Trader Pro – Learn how to Trade the Stock Market

Also, if you would like a discount to the above chart software, please click below:

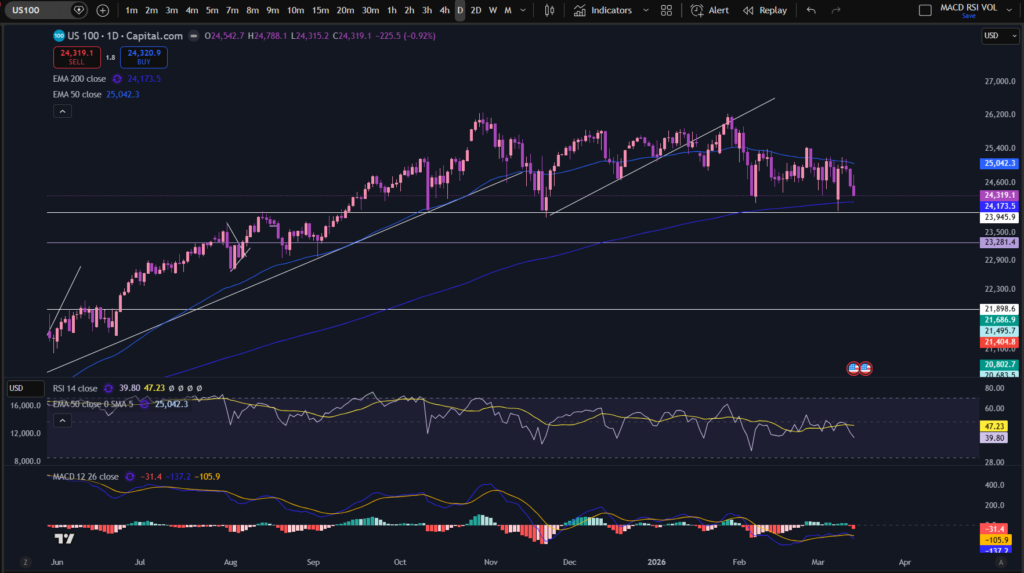
At the moment, the price is holding itself above the support level marked on the chart in white. It remains to be seen whether it will descend further or start to recover. I am still in the ‘waiting’ stage. I’m waiting to see prices start to make higher highs and higher lows before I enter any new positions. As far as stocks today are concerned, my conclusion for the NASDAQ is that I will wait to see what happens first…

S&P 500

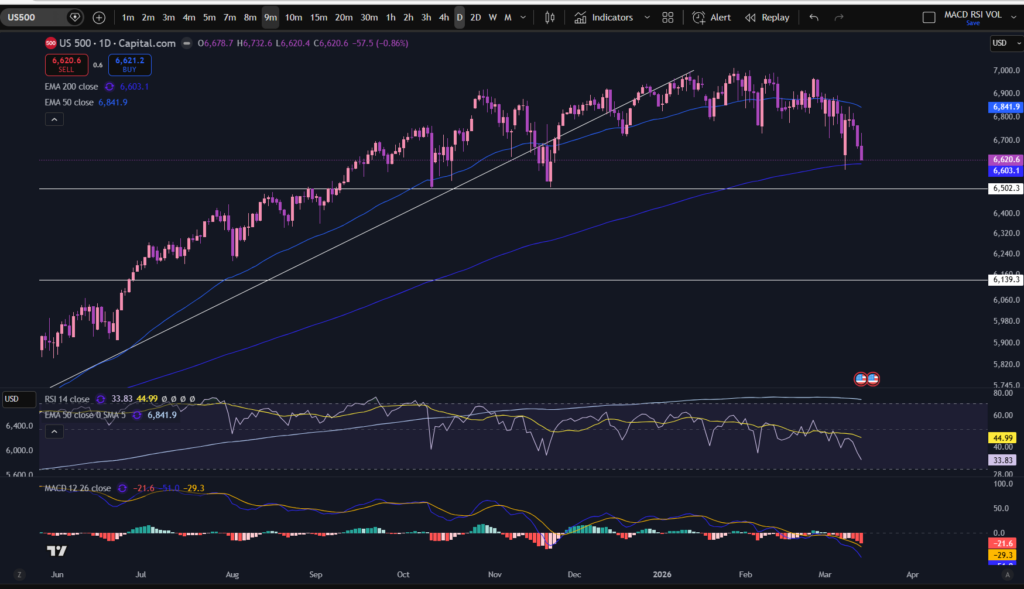
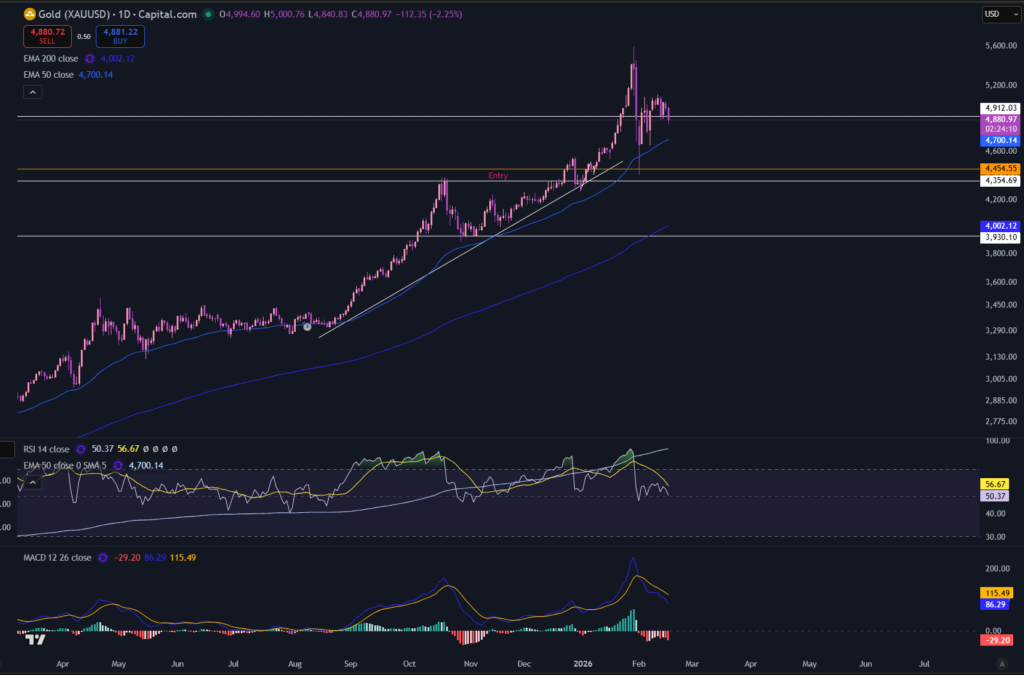
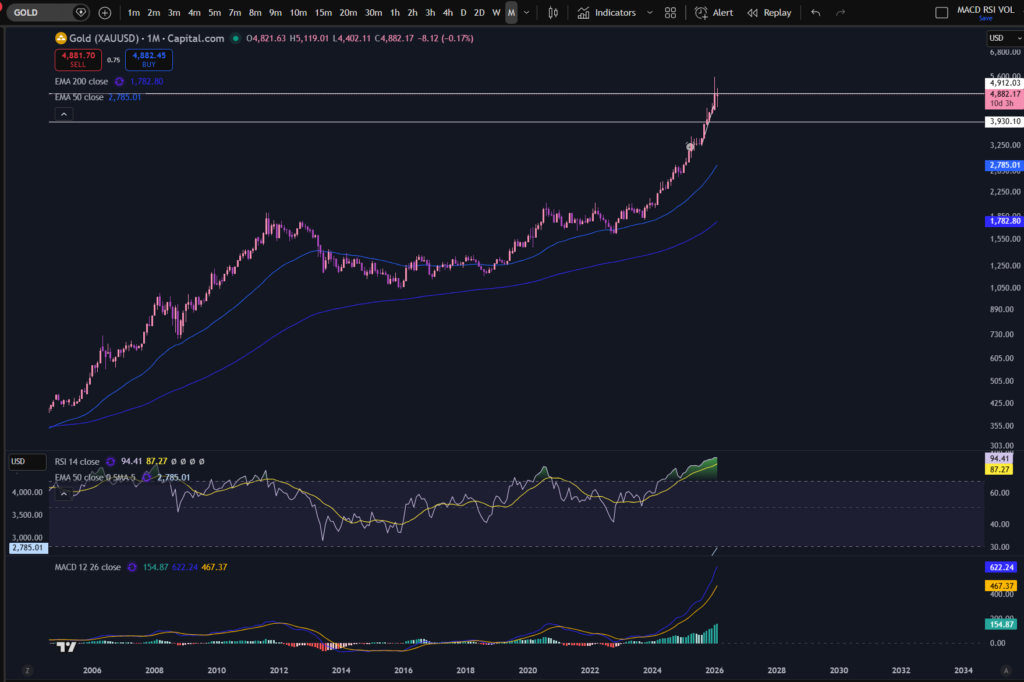
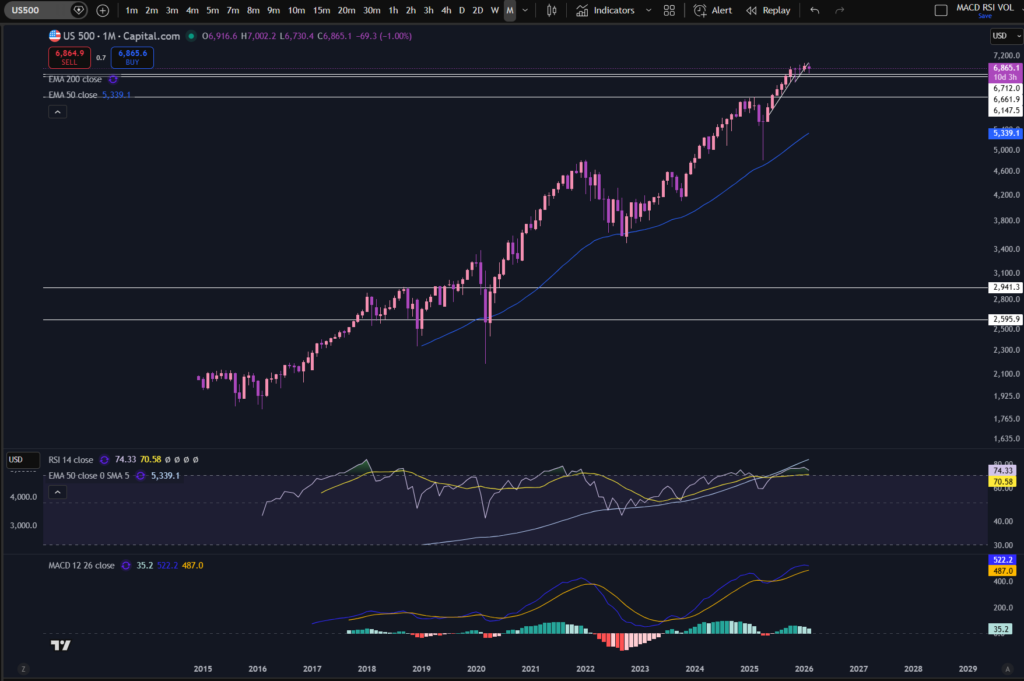
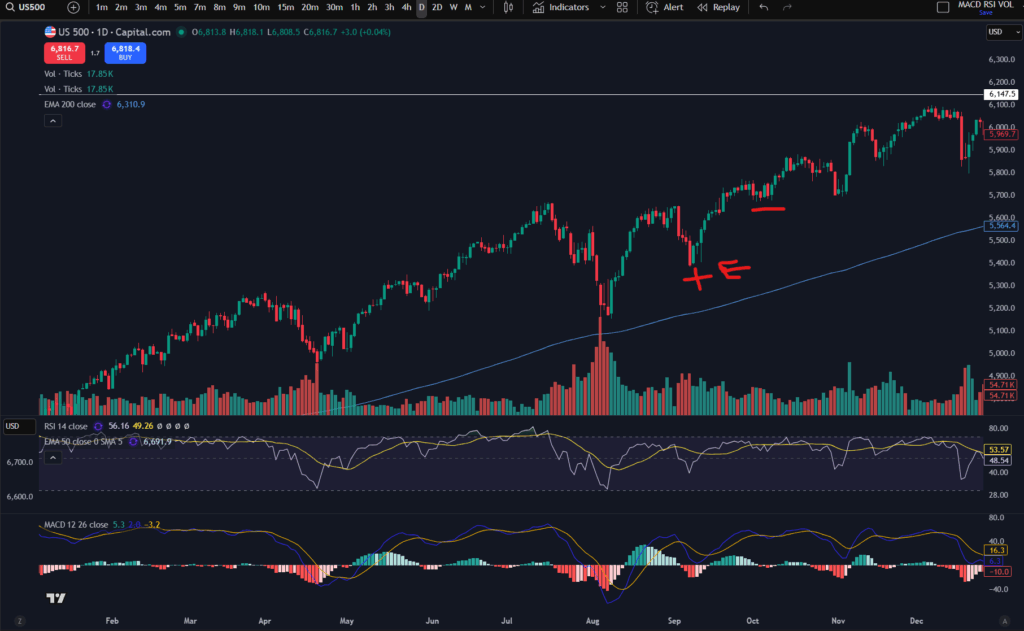
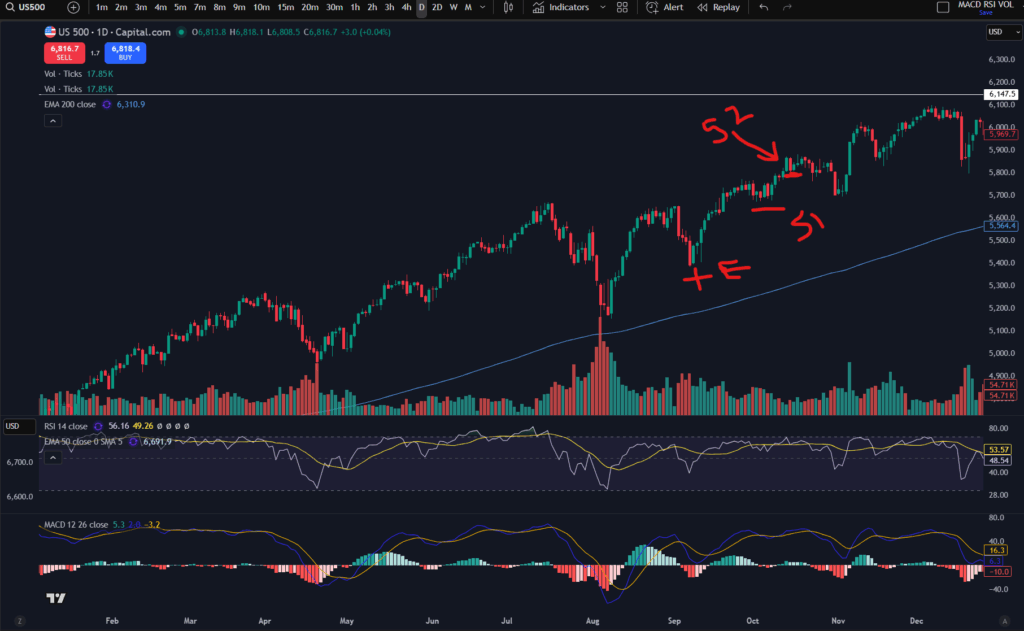
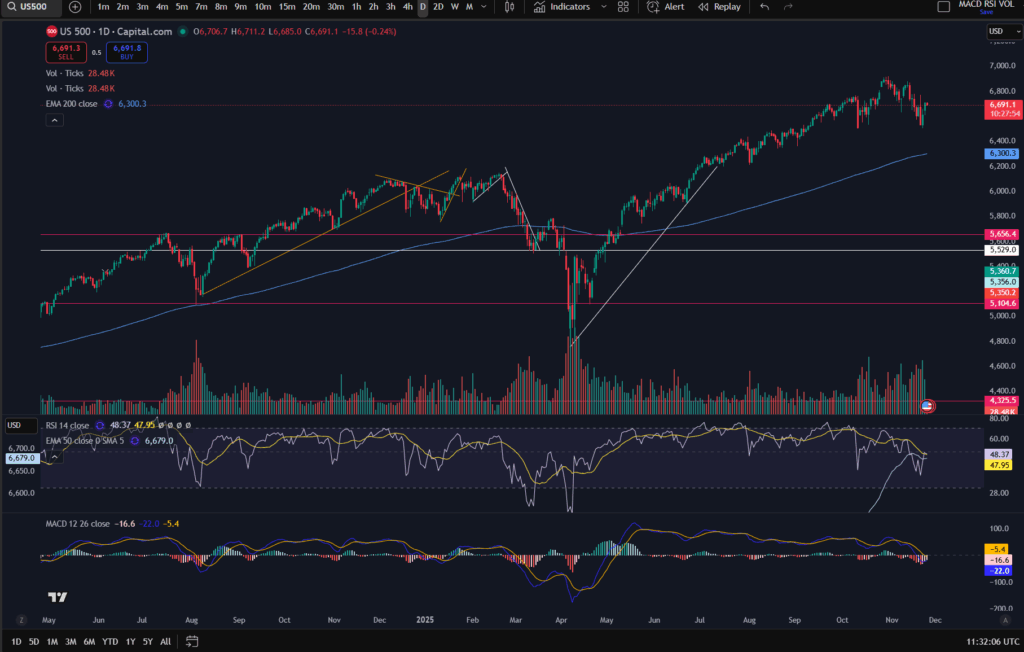
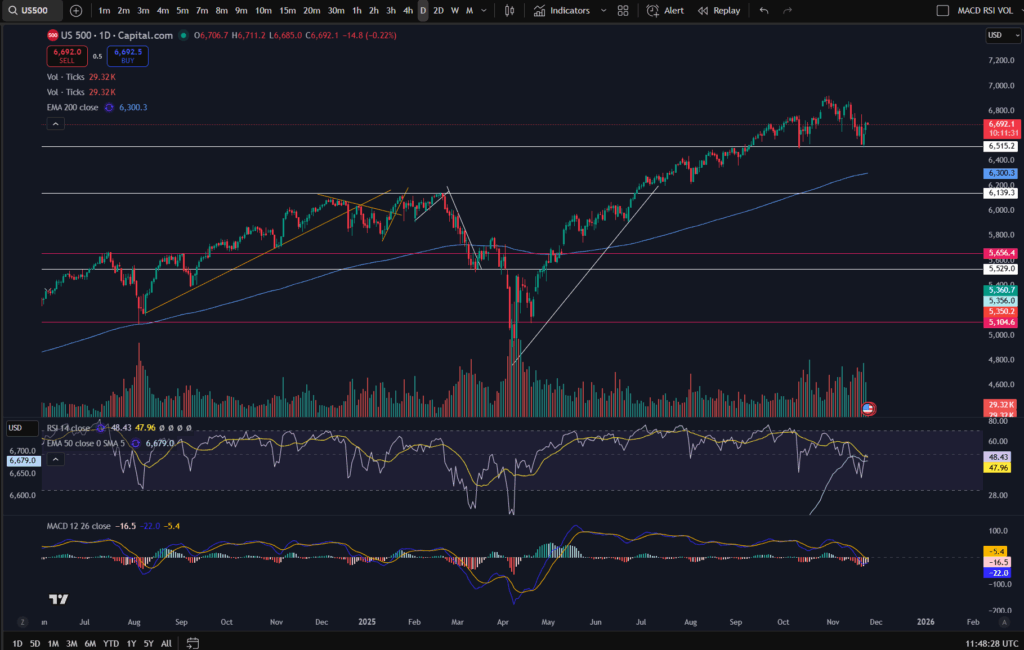
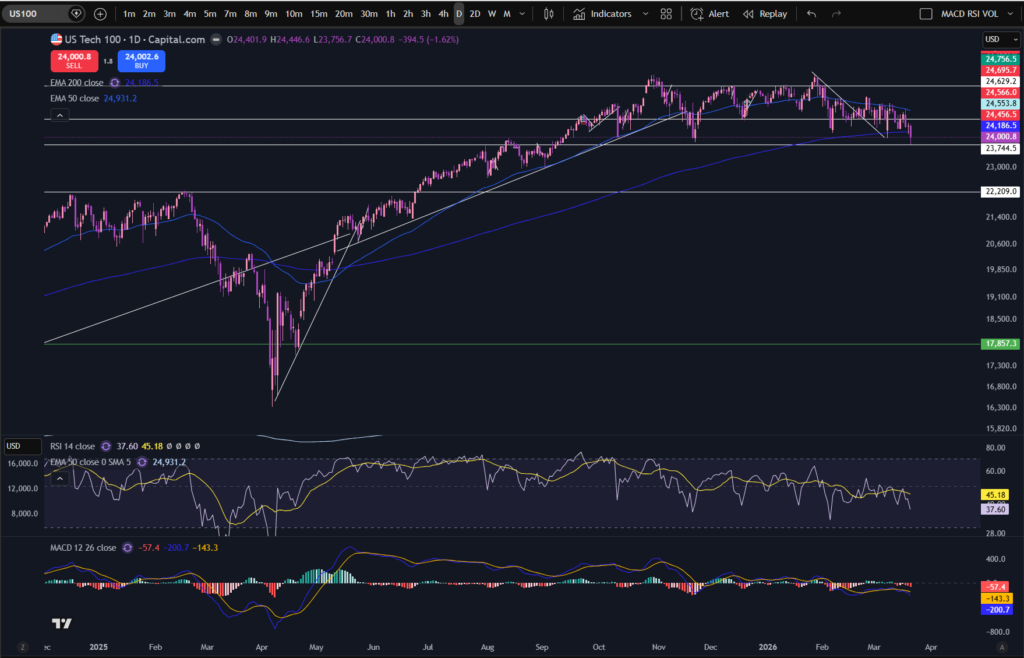
The story on the S&P 500 stocks today, is very similar. With the turbulence from the Iran war and missiles being fired to Cyprus and other countries in the area, it is no wonder they are struggling to pull up. Let’s take a look at the S&P 500 chart:

stocks today

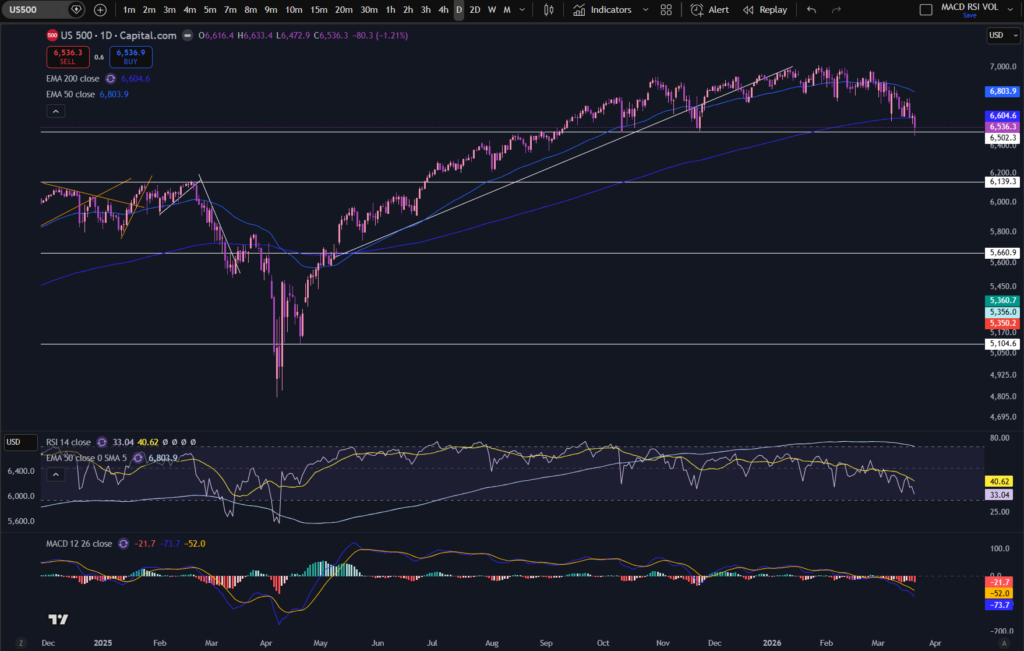
You can see the exact same pattern almost, on the 500 top stocks in America too. It’s at a major support level and on Friday it rebounded away from it.

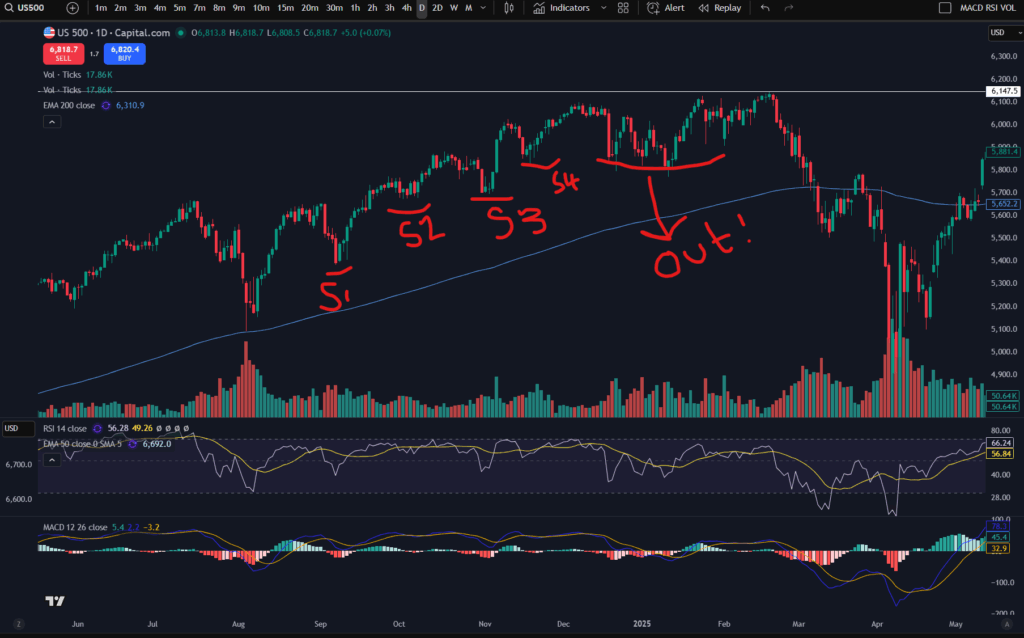
If you are a regular visitor to this blog, you will know that I like to focus my attention on the US markets. They are normally very bullish and I find it easy to find great trading set ups on the US markets. However, there are times when I need to exercise patience and caution. This is one of those times. I will be waiting for the markets to show signs of recovery before I invest or trade with any more open positions.

I hope you found this article helpful!

Disclaimer!

Nothing on this blog should be taken as financial advice or encouragement for you to enter a trade.  You are expected to speak to a financial adviser or carry out your own due diligence before entering any positions.  Everything on this blog is made for educational purposes and to equip you with the knowledge you need to be able to make your own financial decisions.

For more great tips and advice on trading the stock market, please visit:

https://sophiatrades.co.uk

To watch me trade live please visit my patreon page here:

https://www.patreon.com/Traderpro8320

Finally, if you would like to receive a discount on the Trading View charting software I use, please click on the relevant link here:

https://www.tradingview.com/?aff_id=117138

Please note any subscriptions taken via my affiliate link with Trading View may result in me earning a small commission.  However, I provide complete transparency on me using Trading View personally – I publish my success on the financial markets via my broker reports and any profits earned were done so by using my own Trading View subscription,  so I genuinely do recommend them and have been using the Trading View charts for many years.

Best stocks to buy now

Best stocks to buy now

In this article i’m going to look at what position the markets are in, with a view to helping you determine the best stocks to buy now. I’m going to examine the position of the overall index and recent highs and lows, and any recent patterns forming. Let’s get straight into it!

Best stocks to buy now – the NASDAQ – recent activity

It helps when considering which are the best stocks to buy now, to look at the overall index first – to see what’s happening there. Reason? Because the overall index has an influence on the prices of its constituents and vice versa. It helps you see clearly, in one big swoop, what’s happening to the markets in general currently. The NASDAQ is the average of the top 100 stocks in America and it is heavily weighted in the Technology sector, with constituents like Apple, Google and Microsoft sitting on it.

NASDAQ monthly timeframe:

Best stocks to buy now

Let’s take a look at the NASDAQ per the monthly timeframe. I’m using the Trading View chart software – click below for a discount:

As you can see on the monthly timeframe, the markets had recently pushed up to new overall highs and they are now pulling back. This is paramount information and consideration before you decide on the best stocks to buy now. The MACD indicator has gone from strong upwards momentum, dark green histogram bars to smaller, reducing in size, light green bars. This pattern is typical before it turns red. You can see where the MACD indicator went red previously on this time frame and what happened to the price. A further downwards push is not guaranteed – nothing is! As traders we are trying to look at patterns on the chart to see what might be possible in the near future. The RSI has pulled back considerably on this time frame. If you would like to understand more about these indicators, please see my blog articles below:

How to use MACD – The Moving Average Convergence Divergence to make more money – Trader Pro – Learn how to Trade the Stock Market

The Relative Strength Index (RSI Indicator) – how to make money – Trader Pro – Learn how to Trade the Stock Market

Now let’s take a look at the daily timeframe:

Best stocks to buy now

Looking at the daily timeframe, is like zooming in, on the monthly. It shows you a close up of what’s going on. To understand how to use Multiple Timeframe Analysis in your trading, please see the following blog article:

Multiple Timeframe Analysis – mind blowing knowledge that will change everything! – Trader Pro – Learn how to Trade the Stock Market

As you can see on the daily timeframe chart, the price is holding firm above the white support line at around 23,945. It has touched this line quite a few times, tried to push down through it, and then popped back up again. The market is consolidating and going sideways. Often times when a market is bouncing along sideways, it is gaining momentum to either push up strongly or pull back significantly. It is unknown which way it will go. The FEDS dropped interest rates which can help the markets push up further – historically this is what happened after interest rates were reduced. However, the markets are very overbought in general – all the stocks and commodities have reached record highs and it is not clear how long this upwards drive will last! What goes up, must come down – at least slightly!

The last candle which formed, was a large downward candle, taking the price back down close to the support level. To understand more about support and resistance levels, please see this blog article:

Support and Resistance – how to make more money trading – Trader Pro – Learn how to Trade the Stock Market

Let’s just throw in the S&P 500 for good measure!

As you can see, we have a similar story on the S&P 500…

From examining these indices, my own decision is to wait before considering the best stocks to buy now. I want to see which direction the markets are headed in, in general, before jumping into anything. There may be markets/stocks sitting on these indices which are still pushing up right now and this is what’s holding it up but i’m conscious of what I stated earlier, that the index has an overall impact on the direction of the stocks, and vice versa. I want the odds to be in my favour when I open more positions. So I will wait to see what happens for a while.

What am I waiting for?

Before I can decide on the best stocks to buy now, I’m waiting for the markets to break out of the sideways channel they are in (i.e. the Index). If they break out upwards, I may consider that a new pattern is starting to form (with reference to new consistent support levels being in a diagonal push up or a new clear horizontal level being established which it is now clearly a new support), and look for good markets / stocks to get into. If they burst downwards I will be waiting even longer – until they start to push up again. For now, I just wait…

He that can have patience can have what he will.” —Benjamin Franklin

Let’s generate wealth, independently, together!

Disclaimer!

Nothing on this blog should be taken as financial advice or encouragement for you to enter a trade.  You are expected to speak to a financial adviser or carry out your own due diligence before entering any positions.  Everything on this blog is made for educational purposes and to equip you with the knowledge you need to be able to make your own financial decisions.

For more great tips and advice on trading the stock market, please visit:

https://sophiatrades.co.uk

To watch me trade live please visit my patreon page here:

https://www.patreon.com/Traderpro8320

Finally, if you would like to receive a discount on the Trading View charting software I use, please click on the relevant link here:

https://www.tradingview.com/?aff_id=117138

Please note any subscriptions taken via my affiliate link with Trading View may result in me earning a small commission.  However, I provide complete transparency on me using Trading View personally – I publish my success on the financial markets via my broker reports and any profits earned were done so by using my own Trading View subscription,  so I genuinely do recommend them and have been using the Trading View charts for many years.

What is leverage in trading?  Everything you need to know!

What is leverage in trading? Everything you need to know!

In this article i’m going to answer the question, ‘what is leverage in trading?’. The answer to this question is something you absolutely must become familiar with if you are to become successful as a stock market trader. I will explain to you about the different types of leverage and how you can check the details so that you know exactly what you are dealing with in your broker account.

What is leverage in trading? Let’s start with the basics!

The best way I can describe leverage to you is for you to think about it as a loan for a large portion of a pie. Imagine that the asset you want to purchase, is divided up into pie pieces:

In a broker account with leverage, the broker will ask you to put down, as a deposit, maybe, one slice of pie – this is known as the margin. Why ‘margin’? Think of the margin as a small portion of a page – like the margin on a page. The rest of the pie will be funded by a loan (leverage). What is the point of this? It means when you use a leverage account, you can get into larger position sizes (purchase larger assets) than you would otherwise have been able to afford with your cash in the account.

To fully understand the answer to the question, ‘What is leverage’, you must also understand how much leverage is given by the broker

The amount of leverage (the proportions of the pie funded by a loan vs your own cash), will depend on the type of asset in question, and the broker account. I have set out the typical scenarios below:

Equities

Typically, equities (shares) attract leverage of 4/5 meaning 4 portions of the pie will be funded by the broker as a loan, and 1 portion of the pie will be funded by your cash. (1:5 ratio/20%).

Commodities

Commodities, such as oil, gas, coffee, orange juice etc, will typically attract leverage of 9/10ths of the position size, meaning you put down 10% as your cash deposit, and the broker funds the other 90%.

Indices

On indices you can obtain the most leverage. These instruments can typically allow you to borrow 19/20ths of the asset value with leverage and 1/20th will be funded by your cash.

How can you tell or check what the leverage is, on an asset, before you trade it? If you click on the asset ‘details’ within your broker account, it will say something like 20:1 (for an index) or 5:1 for an equity. Meaning, for every 1 you put in yourself on an equity trade, the broker will fund the other ‘4’.

What are the benefits and drawbacks of using leverage?

The basic benefit is that you can open larger positions so if you are a profitable trader you will make more profit. The downside is that the broker will charge you fees, like interest, for taking the loan in the form of leverage. These are seen in your account as overnight funding adjustments. The broker often charges you if you hold the leveraged positions overnight.

What is leverage in trading: How the leverage is managed in a broker account

On entry into a buy position, the broker will check that you have enough money to cover your deposit (margin). This deposit money will be ring fenced while you are in the trade. The broker typically shows you the amount of margin being used on open positions, and the amount of buying power you have (which is equal to the cash in the account, plus the profit or loss on any open positions, less the margin being used). The rest of the position you purchase will be on a loan.

Important information you MUST KNOW to complete your understanding of ‘what is leverage in trading’

NOTE! – AND THIS IS VERY IMPORTANT! Before you complete your understanding of what is leverage in trading, you must know this. The amount of loss you can take, when trading with a margin/leverage account, can be more than the cash in your account. HOW? I will explain below with an extreme scenario so you get the point.

Imagine you enter a position where the price of the asset is £5,000 for one share, and it’s a share/equity.

ENTRY: £5000 X 2 portions = £10,000 value of trade.

Margin/deposit required: £2,000 – the instrument is an equity so as above, 1/5th of the value of the trade is set aside for margin/deposit.

Cash in account at entry: £2,100.

Price movement: The price goes against you, and each share is now worth £1,000.

Now your open position is worth £2,000. £1,000 x two shares = £2,000.

You have lost on the trade, £10,000 (value at entry) – £2,000 (current value) = £8,000 LOSS.

Your cash level at entry, was only £2,100 – so you have now lost more money than the level of cash you had in the account at the outset.

This is why trading with margin is very dangerous unless you know and fully understand how it works. Don’t worry – this article will help you!

The reality is that you would have got a ‘margin call’, from the broker, asking you to fund the account at the point where you are going into a position where you do not have enough funds to cover the margin. (The broker will deduct/ringfence your loss from the available funds so in the scenario above, the cash in the account was depleted by the loss on the trade). You see, while the position is open, the margin and leverage is moving around, in accordance with the latest share price, compared to your entry point.

If you find it easier to hear and see a video on this, I also published a video on my YouTube channel, here:

I hope you found this article helpful, in understanding the answer to the question, what is leverage in trading. Perhaps if you did, you can leave a comment below?

Disclaimer!

Nothing on this blog should be taken as financial advice or encouragement for you to enter a trade.  You are expected to speak to a financial adviser or carry out your own due diligence before entering any positions.  Everything on this blog is made for educational purposes and to equip you with the knowledge you need to be able to make your own financial decisions.

For more great tips and advice on trading the stock market, please visit:

https://sophiatrades.co.uk

To watch me trade live please visit my patreon page here:

https://www.patreon.com/Traderpro8320

Finally, if you would like to receive a discount on the Trading View charting software I use, please click on the relevant link here:

https://www.tradingview.com/?aff_id=117138

Please note any subscriptions taken via my affiliate link with Trading View may result in me earning a small commission.  However, I provide complete transparency on me using Trading View personally – I publish my success on the financial markets via my broker reports and any profits earned were done so by using my own Trading View subscription,  so I genuinely do recommend them and have been using the Trading View charts for many years.

Can you make money on the NASDAQ right now?

Can you make money on the NASDAQ right now?

In this article i’m going to talk about the current and recent positions of the NASDAQ with a view to answering the question ‘can you make money on the NASDAQ right now?’. I’m going to examine the recent highs and lows and what’s happening with some of my preferred indicators. Let’s jump straight into it!

Can you make money on the NASDAQ right now – recent activity

The NASDAQ is currently going sideways. It has been doing this for a long time. What does this mean? Markets can either go up, down or sideways, and sometimes they go sideways to consolidate – to allow breathing before pushing higher, or to test limits and supports before they lose strength and pull right back. You should think of a sideways market as a battery charging…. it’s building momentum to either go up, or down. When they go sideways for a long while, it can give the market a breathing space which is equivalent to the market pulling down/back – because time is passing by and the market is not reaching high prices. It allows the momentum to reset itself and you can see this on some of the indicators I like to use, like the RSI and the MACD. To help us answer the question about whether we can make money on the NASDAQ right now, let’s take a look at the daily time frame chart:

money on the nasdaq

As you can see, the market reached an all time high in mid October and since then it’s been drifting through a channel sideways. It did touch the previous high in February but since then it descended further. You can see the diagonal down trend line I had recently applied to the chart, which the price has now bust through! The price is now back at the horizontal support again and it’s bounced away from it with a hammer candlestick pattern. If you would like to understand more about candlestick patterns, please see the relevant section of my blog, below:

Japanese Candlesticks – Trader Pro – Learn how to Trade the Stock Market

The MACD made a cross over to the upside, below the zero level of the histogram and this can be recognised as an upward push momentum but it remains to be seen how long it will last. This is the zone where the price bust through the diagonal resistance line above. In order to answer the question more fully, ‘can you make money on the NASDAQ right now’ we need to also consider the higher time frame for a birds eye view. Note: I am not in the habit of always considering the monthly timeframe – it depends. On this occasion I consider it is necessary, since the price has gone sky high recently so it may be coming to the end of a long term upwards push.

Let’s also take a look at the bigger picture – the monthly timeframe

As you can see on the monthly time frame, the MACD indicator is losing momentum for upwards push – the histogram bars have gone from dark to light green and they are becoming smaller and smaller. The MACD and signal lines look like they are in a position where they could cross over to the downside. However, note that in the time the market has been going sideways, the RSI indicator has pulled back slightly meaning the price is not as expensive as it was at the peak and this is what I meant by a sideways movement allowing the price to recharge and gain energy. You can see from historical RSI movements on this chart, that the little dip which has happened recently on the RSI indicator, can sometimes be enough of a pull back for it to go up again. It is not clear what will happen next – I am simply waiting for confirmation. What do I mean by this? I’m waiting for the market to make higher highs and higher lows again. Going back to the daily timeframe, I have marked in red the recent highs and lows. At the moment the market is in a position where it is moving away from a ‘lower low’ so definitely not pushing up enough for me yet… and so I wait!

I hope you found this article helpful in answering your question, can you make money on the NASDAQ right now?

Disclaimer!

Nothing on this blog should be taken as financial advice or encouragement for you to enter a trade.  You are expected to speak to a financial adviser or carry out your own due diligence before entering any positions.  Everything on this blog is made for educational purposes and to equip you with the knowledge you need to be able to make your own financial decisions.

For more great tips and advice on trading the stock market, please visit:

https://sophiatrades.co.uk

To watch me trade live please visit my patreon page here:

https://www.patreon.com/Traderpro8320

Finally, if you would like to receive a discount on the Trading View charting software I use, please click on the relevant link here:

https://www.tradingview.com/?aff_id=117138

Please note any subscriptions taken via my affiliate link with Trading View may result in me earning a small commission.  However, I provide complete transparency on me using Trading View personally – I publish my success on the financial markets via my broker reports and any profits earned were done so by using my own Trading View subscription,  so I genuinely do recommend them and have been using the Trading View charts for many years.

How does a dividend affect a share price?  Everything you need to know!

How does a dividend affect a share price? Everything you need to know!

How does a dividend affect a share price? This is an important topic for any trader and definitely something you should be considering before placing any trade – both in general and in relation to the timing of the specific stock you are interested in trading. I’m going to talk about what a dividend is, how this affects the price of a stock and how you can prepare for these fluctuations as a trader.

We want to answer, “How can a dividend affect a share price”, but first of all, what is a ‘dividend’?

So…. back to companies 101…. we know that a company is a business (or it can be an investment vehicle) in a legal entity ‘wrapper’. It is treated as a separate person entirely, from the business owner(s). The business is split into portions like dividing up a pie and these portions are the ‘shareholdings’ of the company. So the people who own the business are the ‘shareholders’ and they each own a piece of the company in accordance with their share holding and certificate, like a slice of pie. A dividend is a mechanism by which, the business pays out some profit to its shareholders.

So how do dividends come about?

In order to determine an answer to the question, how does a dividend affect a share price, we must first also understand how dividends come about! Any assets or income belongs to the legal entity of the business and is received within the legal entity. In order to distribute some of this income to the owners of the business (the shareholders), a ‘dividend’ must be declared and paid. The business will declare a dividend from ‘distributable profits’ only. If they do not ensure the dividend is made from ‘distributable profits’ it is possible the dividend will be made illegally. This is a slightly different topic but the directors basically need to ensure that the business has got enough cash and spare money before paying the shareholders a dividend, to make sure it is being fair to its creditors. The worst case scenario which could occur is that the company could pay a dividend and it depletes funds needed to pay creditor liabilities – this is why they must be paid from ‘distributable’ reserves. This is a slight digression, but it was worth noting here for anyone who does not know much about companies and how they work.

OK, so back to where we were… the directors of the company will assess whether the company is in a position to pay a dividend, and they will ‘declare’ it / in other words, they will announce to the market, that they have decided a dividend will be paid. This is the ‘ex dividend’ date – which is important. The cash payment of the dividend will follow a little while later and will be paid to the share holders in accordance with their slice of pie share holding. So if the company is divided up into 10 slices of pie (shareholdings) and they are all equal shareholdings, and the company declares a dividend of £800, what this means is that each slice of the pie shareholding will receive £80 as a dividend.

Are dividends mandatory?

No – dividends are not a mandatory thing on the part of the directors. They need the freedom and discretion to be able to examine the company’s financial position, prior to making any dividend declaration, and consider whether the company can afford to make a dividend from its distributable reserves.

Not only this, but some companies do not usually pay dividends and other ones do. It is entirely in the discretion of the directors and they are usually following the particular customs of the company in question. If a company usually pays a 1% dividend to shareholders, the shareholders would be in a position where they are accustomed to receiving this, and they would expect it. Indeed, it may be the reason they purchased those shares – some shareholders just purchase shares for the purposes of receiving dividends, and some shares pay more dividends, and pay more ‘often’ than others – so if the investor is someone who is interested in receiving dividends as income rather than more capital growth from his/her shareholdings, they may tailor their investment portfolio to the companies which pay dividends regularly and at a good rate. Notwithstanding this, the discretion of the directors must always be applied to ensure the dividends are not made illegally (from non distributable reserves – depleting funds for the creditors).

So how does a dividend affect a share price then?

So when a company makes a dividend, this dividend is in effect, the company paying out some of it’s earned profits to the shareholders. The company’s worth (share price) is based on it’s assets and earnings potential – it’s an estimate by the market based on supply and demand, of what people think that is worth! So when the company pays out some of it’s worth as a dividend, it is literally depleting the balance sheet of reserves and profit/cash – which could be used to buffer the company from any troubles, buy more assets, grow the business etc. I’m not saying paying a dividend is a bad thing but it ‘must’ affect the share price – logically, it will.

So when the stock goes ‘ex dividend’ (when the dividend announcement has been made), you can expect the stock to take a temporary nose dive in terms of the share price.

How can you plan your trades around this?

Make sure before you open a position on an equity, that you know what the next ex dividend date is, and be prepared in the plan of where to enter and exit, for the drop in share price when the stock goes ex dividend. If you are confident that there will be no significant impact from the question, how does a dividend affect a share price that’s fine… but it could affect your win rate if you ignore this and get in anyway!

I hope you found this article informative on resolving the question, how does a dividend affect a share price. Perhaps if you did, you can leave a comment below!

Disclaimer!

Nothing on this blog should be taken as financial advice or encouragement for you to enter a trade.  You are expected to speak to a financial adviser or carry out your own due diligence before entering any positions.  Everything on this blog is made for educational purposes and to equip you with the knowledge you need to be able to make your own financial decisions.

For more great tips and advice on trading the stock market, please visit:

https://sophiatrades.co.uk

To watch me trade live please visit my patreon page here:

https://www.patreon.com/Traderpro8320

Finally, if you would like to receive a discount on the Trading View charting software I use, please click on the relevant link here:

https://www.tradingview.com/?aff_id=117138

Please note any subscriptions taken via my affiliate link with Trading View may result in me earning a small commission.  However, I provide complete transparency on me using Trading View personally – I publish my success on the financial markets via my broker reports and any profits earned were done so by using my own Trading View subscription,  so I genuinely do recommend them and have been using the Trading View charts for many years.

Are the markets going to drop in 2026?  Everything you need to know!

Are the markets going to drop in 2026? Everything you need to know!

Many traders and investors are asking the question ‘Are the markets going to drop in 2026?’. In this article I take a look at the current state of the markets and whether a drop could be possible and most importantly, what you can do if they do drop and in the meantime! Let’s get straight into it!

Are the markets going to drop in 2026? Where are they right now?

Currently many of the most popular and most liquid markets, are very overbought. They have reached record highs. Let’s take a look at some examples:

Are the markets going to drop? – Gold

Gold has reached record highs. The chart recently reached a price of circa 5,615 USD but they took a slight downturn from this – let’s take a look at the chart to see if we can get start to answer the question, are the markets going to drop in 2026:

markets going to drop

As you can see from the daily chart, Gold has pulled back from it’s peak. Let’s take a look at what’s going on, on the monthly chart, as this can give a better ‘birds eye’ view:

As you can see on the monthly chart, Gold has reached record highs. The RSI is currently very overextended and it wouldn’t be surprising if the market were to pull back farther than the little dip it’s made on the daily timeframe. However, nobody can predict whether the markets are going to drop – or what they are going to do. The FEDS have cut interest rates in America and this can have a positive effect on some of the markets. We are in a bit of an unprecedented situation. History tells us that when so many markets reach these types of highs, they do pull back quite a bit. It may be just a question of time!

Let’s take a look at the NASDAQ…

Are the markets going to drop? -NASDAQ

As with the case of Gold, you can see on the monthly timeframe, that the NASDAQ has sailed sky high. Take a look at the RSI and the MACD which is now bumping over to the downside! The green histogram bars on the MACD indicator are losing their pigment meaning they are losing strength currently and they are becoming smaller in size! For information I have added what happened to the markets during Covid and also the inflation struggles which have happened over the last few years and the effect of the FED’s interest rate increases on the markets.

The soaring prices on the NASDAQ have partly been inflated by expectations concerning AI and future profitability predictions surrounding this. Some people believe the AI bubble could burst. Nobody truly knows what will happen, however.

Let’s also take a look at the S&P 500 chart for good measure!

S&P 500

As you can see, it’s the same story on the monthly chart for the S&P 500! RSI over extended, MACD bumping over, prices at record highs.

So what to do in the scenario that the markets do ‘pull back’

Try and keep some money aside to take advantage of them on their way back up. Experienced traders and investors do not panic when the markets drop – they have dollar signs in the eyes! There is a saying that most profit is made at the time of purchase, not sale! The wealthy investors will be watching and waiting, and going shopping at the relevant time! Will you be one of them, or will you start panicking? Which one do you want to be?

It’s a good idea to do some research before the markets pull back, into which solid stocks could generate solid returns after some time. It’s a good idea to pick stocks with healthy balance sheets, in sectors which are likely to do well, and try and be diversified to hedge your risk. I posted a video on how you can carry out fundamental analysis of a balance sheet or profit statement, which you may find helpful:

Traders can manage risk in a slightly different way – there are plenty of articles on this blog about how you can manage risk. Currently, for example, I am entering small positions until the market starts moving in my favour and then I load up. This is similar to the averaging up which investors do, but I do this in trading now as well.

Conclusion – are the markets going to drop

My strong suggestion to you is to not fear the question ‘are the markets going to drop’ but rather see the this as an inevitable situation and a significant money making opportunity! Plan for the drop to happen – it will, periodically! Keep cash aside for these times to be in the best possible position, to take full advantage.

I also prepared a YouTube video on this issue which you may find helpful to watch:

Disclaimer!

Nothing on this blog should be taken as financial advice or encouragement for you to enter a trade.  You are expected to speak to a financial adviser or carry out your own due diligence before entering any positions.  Everything on this blog is made for educational purposes and to equip you with the knowledge you need to be able to make your own financial decisions.

For more great tips and advice on trading the stock market, please visit:

https://sophiatrades.co.uk

To watch me trade live please visit my patreon page here:

https://www.patreon.com/Traderpro8320

Finally, if you would like to receive a discount on the Trading View charting software I use, please click on the relevant link here:

https://www.tradingview.com/?aff_id=117138

Please note any subscriptions taken via my affiliate link with Trading View may result in me earning a small commission.  However, I provide complete transparency on me using Trading View personally – I publish my success on the financial markets via my broker reports and any profits earned were done so by using my own Trading View subscription,  so I genuinely do recommend them and have been using the Trading View charts for many years.

I made 180% profit  trading Google within a few months

I made 180% profit trading Google within a few months

I made 180% profit trading Google within the space of a few months and I wanted to explain to you how I achieved this. In this article i’m going to talk about my entry points, why I selected Google to trade, where I planned to exit and how I averaged up in this trade which is an approach I’ve been using more recently, to handle the turbulence in the markets, and Donald Trump’s announcements!

I made 189% profit trading Google, but why did I chose to trade Google Class C to begin with?

I chose to trade Google Class C because I had identified an opportunity. This is a successful company which is investing in modern technology. It has a good product range and I considered it is not likely to go into liquidation, any time soon! The price had dipped right down due to Donald Trump’s tariffs and other news releases. I saw a large opportunity:

profit trading google

If you would like to use the Trading View software pictured above, in your analysis, I can get you a discount – click the link below:

The price had dipped right down by about 30% as you can see in the above chart. This happened in the Summer of 2025. I had predicted that the price would return back up to previous highs and potentially beyond… and I would end up making a large profit trading Google – and this is exactly what it did.

I got in near the bottom where you can see I drew a diagonal support line above.

I took a smaller position size to begin with. This is a new approach I have adopted as outlined in one of my previous articles (here):

How President Trump is affecting the stock market – Trader Pro – Learn how to Trade the Stock Market

My latest approach is to take a smaller position at the outset and then add to this as the position goes in the direction of my favour, instead of using a stop loss. This is what happened afterwards:

You can see in the chart above, that the market actually returned about 90% profit in the time I was in my trade, but how did I make 189% profit trading Google? I loaded up as the market moved in my favour so by the time it reached the top, I was carrying quite a large position and I had scooped up several staggered entry point profit tranches, between their entry points, and the 90% ‘market profit level’ marked on the chart.

As I explained in the above linked article, this approach has made me significantly more money while trading the stock market – President Trump did me a favour in my trading style! I could not be more grateful to him for the turbulence he created.

I consider the sky really is the limit in my trading now and I’m excited to continue with this approach. Thanks Trump!

Let’s generate wealth independently, together!

Understand my strategy in full:

My trade set up/Watch me | Collection from Sophia-Trades | 1 post | Patreon

If you find it more helpful to watch a video you can see my YouTube post in relation to the profit trading Google which I made, here:

https://youtu.be/GzrR1mXELG8

For more great tips and advice on trading the stock market, please visit:

https://sophiatrades.co.uk

To watch me trade live please visit my patreon page here:

https://www.patreon.com/Traderpro8320

Finally, if you would like to receive a discount on the Trading View charting software I use, please click on the relevant link here:

https://www.tradingview.com/?aff_id=117138

Please note any subscriptions taken via my affiliate link with Trading View may result in me earning a small commission.  However, I provide complete transparency on me using Trading View personally – I publish my success on the financial markets via my broker reports and any profits earned were done so by using my own Trading View subscription,  so I genuinely do recommend them and have been using the Trading View charts for many years.

How to Understand Financial Instruments

How to Understand Financial Instruments

In this article i’m going to talk about different types of financial instruments, what they are, how they can be traded. The markets can be a minefield for new traders so it is hoped this article will shed some light on exactly what it is you are looking at, when you log into a broker account.

What are Financial Instruments?

Financial instruments can be any type of financial asset or liability with an underlying contract present giving rise to the asset or liability rights. For example, if you hold shares, you hold financial instruments. If you owe a loan company some money for the new car you just purchased, this is also a financial instrument. It’s a liability for you, but an asset for the vehicle loan company.

So what about the instruments you can see when you log into a broker account? The types you will see, will depend on whether you are logging into an account with margin, or a regular asset purchase account. I have covered what margin is, separately – please see the links below:

OK, so back to the question at hand! If you log into a margin account, you will see many ‘ETFs’ which are available for trading. This stands for Exchange Traded Fund. They are based on many different types of underlying assets. They are basically funds which track some sort of asset.

Financial Instruments – Indices

Indices are indexes of stocks of particular regions or sectors. For example, note the following indices which are available for trading:

  1. NASDAQ ETF (NASDAQ 100) – this is a fund which tracks the value of the 100 top stocks on the NASDAQ stock exchange in America. It is heavily weighted in the technology sector. For example, you will find Apple, Google, Microsoft listed on this exchange/top 100 list. The ETF tracks the average value of all of these top 100 NASDAQ stocks. To buy into this asset effectively means you are hedging your trade or investment between many different successful companies.
  2. S&P 500 – like the NASDAQ tracks the top 100 stocks, this one tracks the top ‘500’ stocks in America. The stocks relate to many different sectors.
  3. FTSE 100 – the top 100 stocks in the UK – you are starting to get the picture, right?
  4. FTSE 350 – the top 350 stocks in the UK.

These indices track the average value of the stocks listed on them.

Pictured below is the chart for the S&P 500 via the Trading View application:

financial instruments

ETFs – Commodities

The ETF commodities track the value of an underlying commodity asset. The commodity could be crude or brent oil (priced in USD per barrel), natural gas, wheat, soy… there are many different commodities available for trading. They are typically priced at a recognised unit of measure in the relevant industry – for eg. oil priced per barrel.

ETFs – Metals

Metals can be traded too via ETFs. Some popular metals include:

  1. Gold (XAUUSD)
  2. Silver (XAGUSD)
  3. Copper
  4. Lead
  5. Platinum

Again, the price of these are based on typical units of measure of the underlying assets, usually in USD.

ETFs can be traded via a margin account – either a spreadbetting account, or a ‘CFD’ account (“Contract for Difference”). More on this below.

Ordinary individual stocks

You can purchase shares in a stock and own part of the relevant company. Unlike trading or investing in the ETFs, when you purchase actual stock shares, you own the underlying shares as opposed to just a contract or you making a ‘spread bet’ on the movement (more below on this). These are not purchased through a margin account but instead through a simple investment account.

When you own a stock share, you may receive dividends once or twice per year. If you purchase enough shares in the company, you will literally take control of the company.

The purchase and sale of stocks in the UK are typically subject to capital gains tax. Any dividends received will be taxed as dividend income.

Let’s look at the different types of financial instruments which can be used to open positions on these types of assets

Spread betting account

A spread betting account is used to place bets on the price movements of the underlying asset. You will never own the asset in this scenario. It is literally like making a bet a a book makers. The fee taken from the broker is heavily weighted on the ‘spread’ – the value between the buy and sell prices. The broker takes a cut by adding a bit more to the buy price for you, for example. It works in the opposite way too, when you sell.

Spread betting accounts are typically seen as ‘gambling’ and therefore exempt from personal tax liability, but note there can be some exceptions for professional traders. If you are getting to a point where you are buying and selling and making money without a day job from this method of trading, you are strongly advised to take some tax advice about the implications in the UK.

Please see my article on spread betting here for more information:

Understanding the spread – Trader Pro

CFD account (“Contract for Difference”)

Unlike a spread betting account, you will own the underlying asset in a contract for difference account. However, it is not the ‘shares’ or ‘oil’ or ‘gold’ that you will own. You will own a ‘contract’ for the price difference as it plays out in the market. If the price goes up and you purchased the asset, the ‘contract for difference’ will determine that you will be owed some money from the person on the other side of the instrument. The same is true the other way round. If you sell, thinking the price is going to go down, and it does indeed go down, the ‘buyer’ on the other side, will need to pay you, in accordance with the CFD. The broker controls the payments and receipts of all of these exchanges so this is not something for you to worry about – it is just useful for you to understand what it is, you are actually buying or selling.

CFD accounts are typically subject to capital gains tax in the UK, for individuals. (You are strongly encouraged to take your own tax advice on this).

Purchasing shares outright

In this scenario, as I mentioned above, you will own the underlying share, and you will benefit from all voting and dividend rights attached to the share. These are typically subject to capital gains tax in the UK although, as noted above, you should take your own tax advice about the implications of what you are trading, for tax purposes.

I hope you found this article helpful. I also posted a video – maybe you are more of a visual person and it would be helpful to see me talking through these instruments on a screen:

Understand my strategy in full: https://www.patreon.com/Traderpro8320

For more great tips on trading the financial markets, please visit my blog:

https://sophiatrades.co.uk

Discount on Trading View:

https://www.tradingview.com/?aff_id=117138

Finally, thank you to my existing members on Patreon, and for your likes, comments and subscribes. Happy trading!

Please note any subscriptions taken via my affiliate link with Trading View may result in me earning a small commission.

How to trail a stop to make big profits trading

How to trail a stop to make big profits trading

In this article i’m going to talk about how you can trail a stop loss to make even more profit when trading the stock market. I’m going to take you through the different types of manual trailing stops you can use, and the types of scenarios they might be useful in. Let’s get straight into it!

How to trail a stop loss – what do we mean by trailing a stop?

When you ‘trail a stop loss’, it means you follow the price at a safe distance, with a stop loss – you move your stop slowly to mimic the price increases on the chart so that if the price descends, you will not lose the profit on the table you have already earned. However, it allows scope for the price to increase further and in this way, you can make profit out of long trends! What’s not to love?

To understand stop losses and risk management, please see our other article, here:

Risk Management – setting a stop loss? How to make money – Trader Pro

Please also see our YouTube video, here, on managing risk:

How to trail a stop loss – the manual way

There are some automatic ways to trail a stop but please note, they are not covered by this article. I’m going to share with you, how I trail a stop manually here. There are different scenarios which would help me to decide how ‘closely’ to trail a stop. This would depend on how much leverage i’m using, whether I have profit on the table, how far I think the price will go and how much room I believe it needs to breath and fluctuate if I’m trying to catch a long trend.

The way I trail a stop is to look for a support – the support could be either a candle (to trail a stop closely), a low on a trend (perhaps to try and trail a trend for a long time), a support line (either diagonal or horizontal) – you could also use this latter type for long trends and breakouts. I would keep my stop at the most recent support and move it manually once the price moves up into a new zone/level.

For scenarios where i’ve made a little trade, the price has gone near my target, and I believe there is a chance it could grow a little more, but I don’t want to risk the profit i’ve made already, I would trail a stop very closely, using the candles. This is the type of scenario where I would not be looking to catch a long trend with the trailing stop. Let’s look at an example…

Trailing a stop closely using candles

trail a stop

To get a discount to the Trading View software that I use, please click the link below:

Let’s say you entered the market in the above trend where i’ve marked a + sign and ‘E’. Your initial intention was to take profit near the previous high so you’ve got some profit on the table, but the market is showing no sign of resistance and you are tempted to see if it will keep going…. you can trail a stop underneath one of the red/lowest candles where it has breathed/pulled back slightly. If you placed a stop where i’ve marked the next red line/marker on the chart, the price did indeed carry on going up further until it pulled back again… at this point you could have taken profit off the table. Alternatively, after the initial stop position, if I were in such a trade, I might be tempted to move it up again, just under the next red candle – marked below:

trail a stop

You can see in the chart above, where I have marked ‘S2’ that this was anther red/low candle and it tried to push up further after this, but it then pulled back down. You would have got stopped out at this level which is a nice bit of profit over and above your original target!

Trailing a stop on long trends

For trailing a long trend, I would instead use the highs and lows of the trend, or diagonal/horizonal support and resistance lines. Let’s take a look at how this could work:

trail a stop

OK, so as you can see in the above chart, i’ve marked out where your stop loss would be moved to manually – every time the trend makes a higher low the stop is moved. I use the MACD indicator to tell me where the highs and lows are in a trend. If you would like to understand this more, please see the following article:

Amazing secrets to help you make more money trading – spot a downtrend early! – Trader Pro

Also please see my video on this:

Back to the chart! So you can see that you would have been able to ride this trend up to just before it crashed down and you would have scooped a large amount of profit from the market. You can see that the stop position ‘4’ would have stopped you out in this trade because shortly afterwards the price fell back down to this level.

Trailing a stop in horizontal steps of resistance and support

In the same way as you can trail a stop in a diagonal movement, you can also trail it in a horizontal step up movement. If you have got support and resistance lines drawn on your chart, you can move the stop up just under the last support level, every time the price pops up into a new zone. For information on understanding how to draw support and resistance levels, please see this article:

Support and Resistance – how to make more money trading – Trader Pro

Let’s take a look at what this looks like on the chart:

trail a stop

As you can see, there are major support and resistance levels marked on this chart in white. I’ve added S1 and S2 as suggested places to which the stop loss could be moved, as the price pushes up through these stepped levels.

I hope this helped you understand how you can trail a stop loss and take even more profit from the market. I’ve also shared below my video on this in case you find it easier to digest:

Understand my strategy in full: https://www.patreon.com/Traderpro8320

For more great tips on trading the financial markets, please visit my blog:

https://sophiatrades.co.uk

Discount on Trading View:

https://www.tradingview.com/?aff_id=117138

My performance in the live markets:

https://sophiatrades.co.uk/category/my-performance-statistics

Finally, thank you to my existing members on Patreon, and for your likes, comments and subscribes. Happy trading!

Please note any subscriptions taken via my affiliate link with Trading View may result in me earning a small commission.

Multiple Timeframe Analysis – mind blowing knowledge that will change everything!

Multiple Timeframe Analysis – mind blowing knowledge that will change everything!

In this article i’m going to talk about something which is paramount to your trading – multiple timeframe analysis. This will blow your mind and change the way you trade forever! Multiple timeframe analysis is essential for new traders to learn – it will change the way you trade and see the markets, forever! Let’s get straight into it…

What is multiple timeframe analysis?

Multiple timeframe analysis is what it says on the tin – undertaking analysis on multiple timeframes to get a clearer idea of what’s happening in the markets. So how does this work, and how can it help you in your trading? The basic premise is that you use ‘larger/higher’ timeframes to get a bird’s eye view of the market – where the price is going long term, what the long term trend is, if there is one. Is it in a range long term? Then you can use the smaller timeframes to ‘zoom in’ and plan and execute your trades with greater precision. Let’s take a look at how this might work. It is common for people to use the ‘daily’ timeframe as their higher timeframe. I personally use this timeframe as a higher timeframe, but note that I also refer to the ‘monthly’ timeframe as another level up, to get an even higher ‘birds eye view’ as compared to the daily.

Let’s look at the daily timeframe on the S&P 500 most recently:

multiple timeframe analysis

You can use the daily/higher timeframe, to mark major support and resistance levels, as below:

multiple timeframe analysis

You can see that the price has found a support a few times at the white marked horizontal line on the chart (6,515). (If you think you would benefit from using this chart software, I can offer you a discount, through Trading View – please click the link below):

OK, so back to the chart analysis! Why is marking the higher timeframe in this way, important when using multiple timeframe analysis? The higher the timeframe, the more people, hedge funds, big money etc, are noticing the resistance or support level – which gives it more weight! More people are going to be respecting those levels and being mindful of them. More people will get into the market at the higher timeframe support area – meaning there will be a stronger push up from that level as a result of sheer volume and demand.

So you can use the higher timeframe to plan the general ‘area of interest’ in your trade set up. For information on how to plan trades and where to get started, please see our blog article:

How to create a Trading Plan – make big wins trading – Trader Pro

Once you have got your general ‘area of interest’ per your bird’s eye view, you can then ‘zoom in’ by using a smaller timeframe. The smaller timeframe should be about 4 timeframes away from your bird’s eye view timeframe. For example, I use the daily timeframe as my bird’s eye view, and the 30 minute timeframe to execute trades, currently. I have combined the daily with the 10 minute and this did work for me, as well.

Smaller timeframe analysis – Zooming in!

OK, so now that you have your general area of interest per the larger timeframe, you can use the smaller timeframe, under multiple timeframe analysis, to plan how to ‘execute your trade. We established that on the daily timeframe for the S&P 500, there was a general resistance level at around 6,515 price. Let’s say we were just at the red X marked below and we had not gone past this point – we knew that the price typically bounces at this level and we expect it to, because in the past, this area was a resistance, too – see how the price was bumping against it, in mid August on the chart below.

multiple timeframe analysis

Bearing in mind this is our point of interest, we might want to get into a trade here, at the support. Now let’s take a look at the 30 minute timeframe to plan this possible trade. We are interested in the price at mid November on the 30 minute timeframe. (Usually you will not have to cut off the chart in this way, obviously – i’m just showing you, retrospectively, how you may have planned and executed a trade at this level):

multiple timeframe analysis

OK, so here we have the zoomed in view of the ‘bounce’ on the daily timeframe. Under my strategy, I would want the price to have popped up over the EMA line before I consider entering a trade. You can see my strategy here:

NASDAQ trading strategy that will make you thousands! ££££££ – Trader Pro

The point of the lower timeframe is that you can see ‘under a microscope’, what’s happening in the market. You can execute your trade at just the right place on the chart, with extra precision.

You plan and execute your trade including the ‘take profit’ and ‘stop loss’ levels per the smaller timeframe, when using multiple timeframe analysis. Do not set a take profit on the daily timeframe. You have to understand that if you put your take profit at the top of a peak on the daily timeframe, it may take weeks to get there, depending on how many days need to go by, to get up there. This is why we plan and execute per the smaller timeframe – each candle is only 30 minutes, or 10 minutes, or whatever you choose to use. So it could take 12 x 10 minutes = 120 minutes to get to your target on the smaller timeframe of 10 minutes. If you waited for 12 candles on the daily timeframe you would be waiting for 12 days!

I hope you found this helpful. I also created a video on my Youtube Channel which you may like to see on multiple timeframe analysis:

Understand my strategy in full: https://www.patreon.com/Traderpro8320

For more great tips on trading the financial markets, please visit my blog:

https://sophiatrades.co.uk

Discount on Trading View:

https://www.tradingview.com/?aff_id=117138

My performance in the live markets:

https://sophiatrades.co.uk/category/my-performance-statistics

Finally, thank you to my existing members on Patreon, and for your likes, comments and subscribes. Happy trading!

Please note any subscriptions taken via my affiliate link with Trading View may result in me earning a small commission.

Nothing in this video should be taken to constitute financial advice. Although we make observations on the current state of the markets, nothing we suggest should be taken as an indication of what they will do next. You are required to carry out your own due diligence before entering any of the markets.