In this article i’m going to consider how to trade commodities, and in particular, Cocoa. I’m going to look at the chart for Cocoa using my favourite chart platform, Trading View. I’m going to perform some technical analysis on the recent and longer term price movements and patterns. Let’s get straight into it…
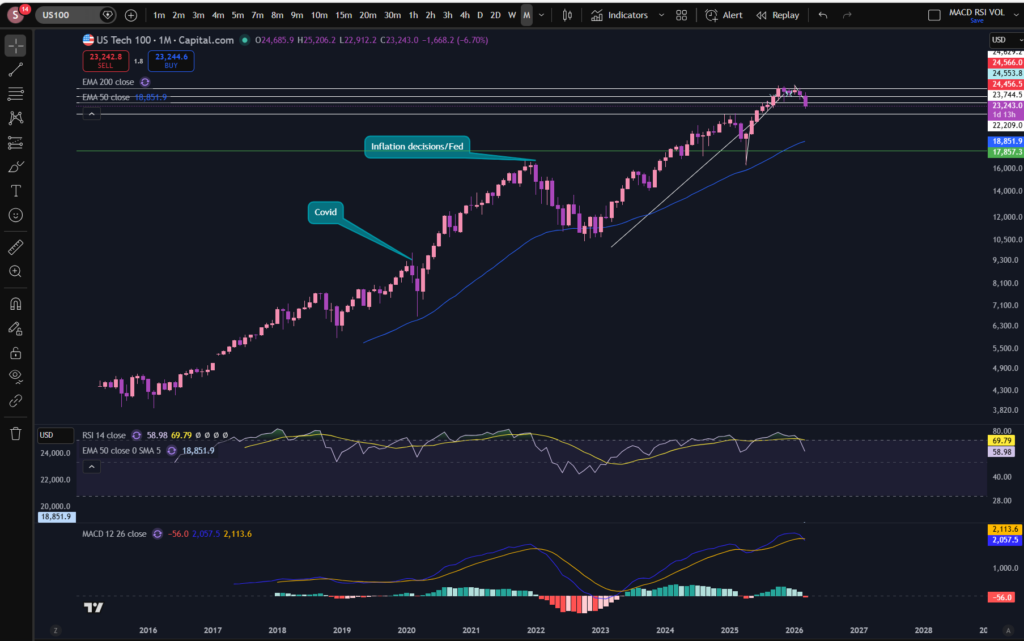
Cocoa birds eye view
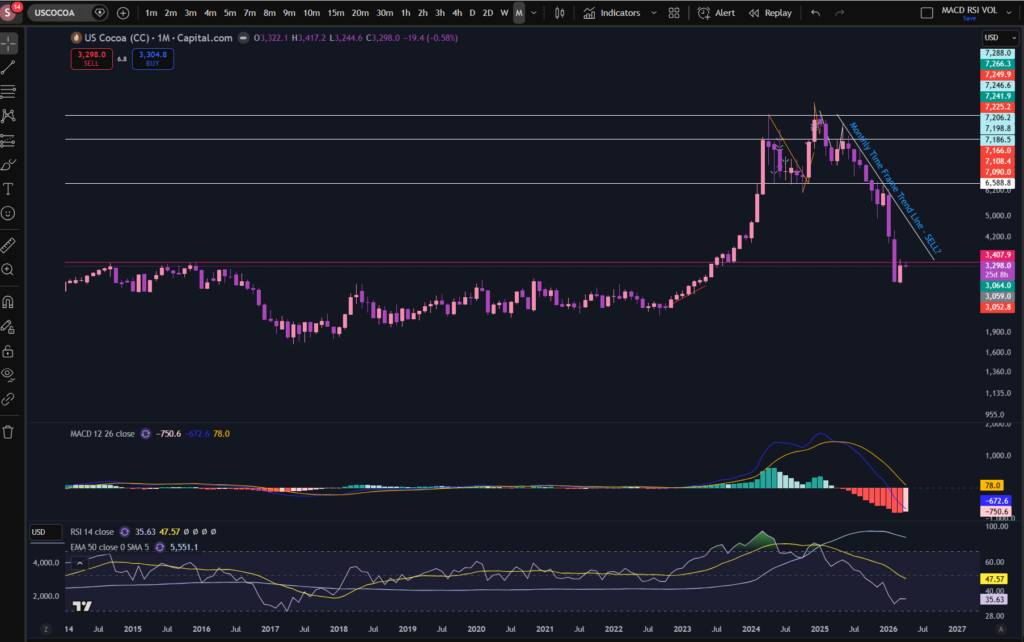
A great place to start in understanding how to trade commodities, is to first, get a birds eye view of a market. In order to get a great bird’s eye view of this market, it’s helpful to consider what is happening on the monthly timeframe. The monthly timeframe contains Japanese candlesticks where each candlestick represents a single month’s worth of price movements – so you can see from the above chart, the long term view of what is happening on the market.
As you can see, the price reached an enormous, all time high, ‘peak’, at around the end of 2025, and since then it has fallen sharply. The price has since respected a diagonal downwards trend line. At the moment it has made a sharp steep peak away from the trend line in the downwards direction, and it has started pulling back again, with a significant pink candle – closing higher, within the last couple of days of the markets being open. As you can see, there is also a strong support level at around 6588.8 but the price has now sailed away from this, so it is useful to check any other horizontal levels which are closer to the current price:
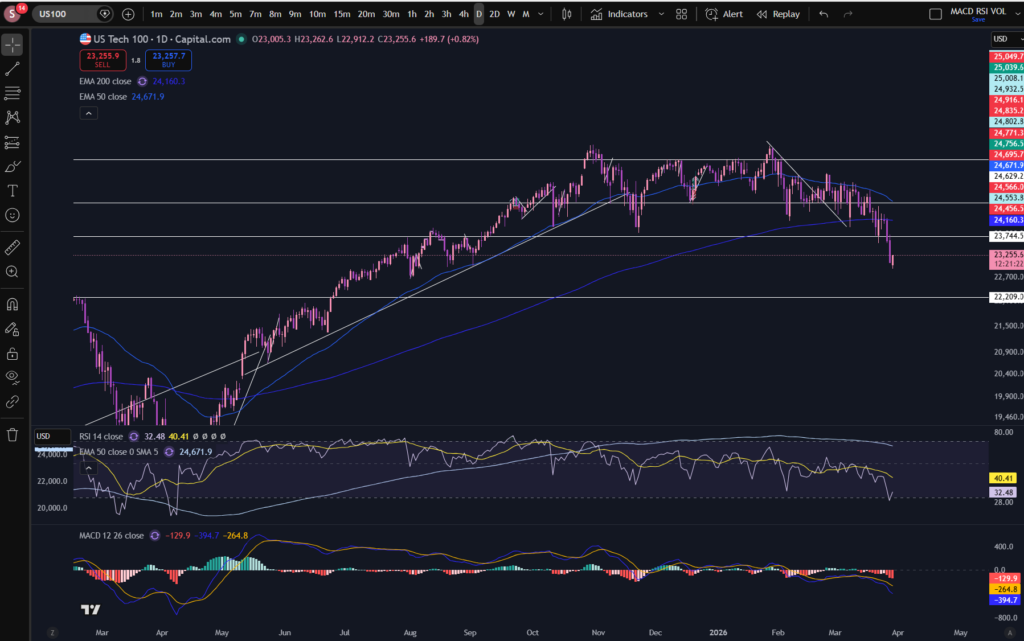
As you can see, there is another horizontal resistance/support line identified at around 3.485. The recent price movements show that they have broken below this support. The price is currently at the horizontal level. It remains to be seen whether it will now descend further, or pull back to the horizontal trend line again.
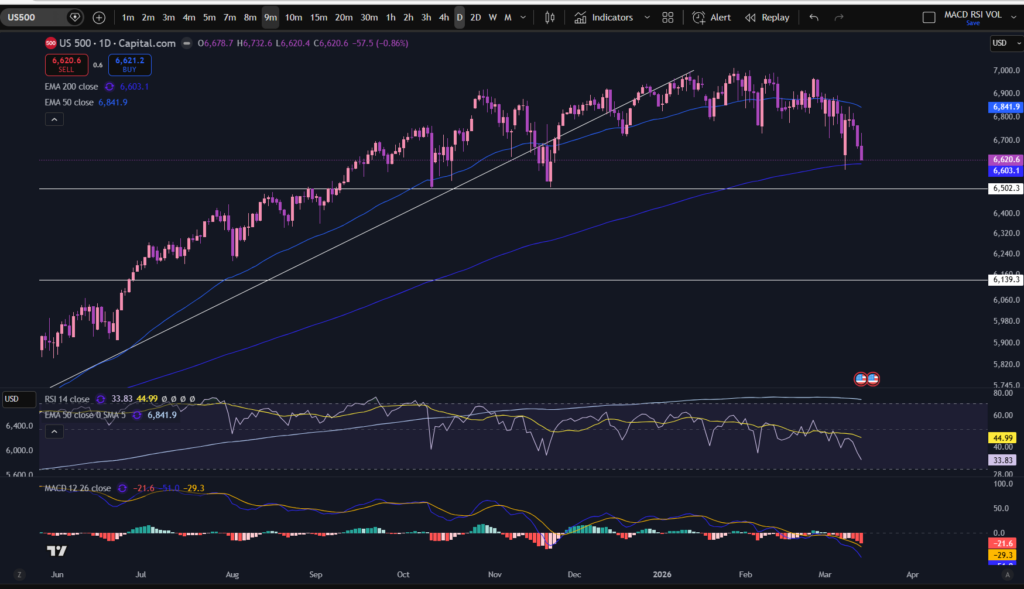
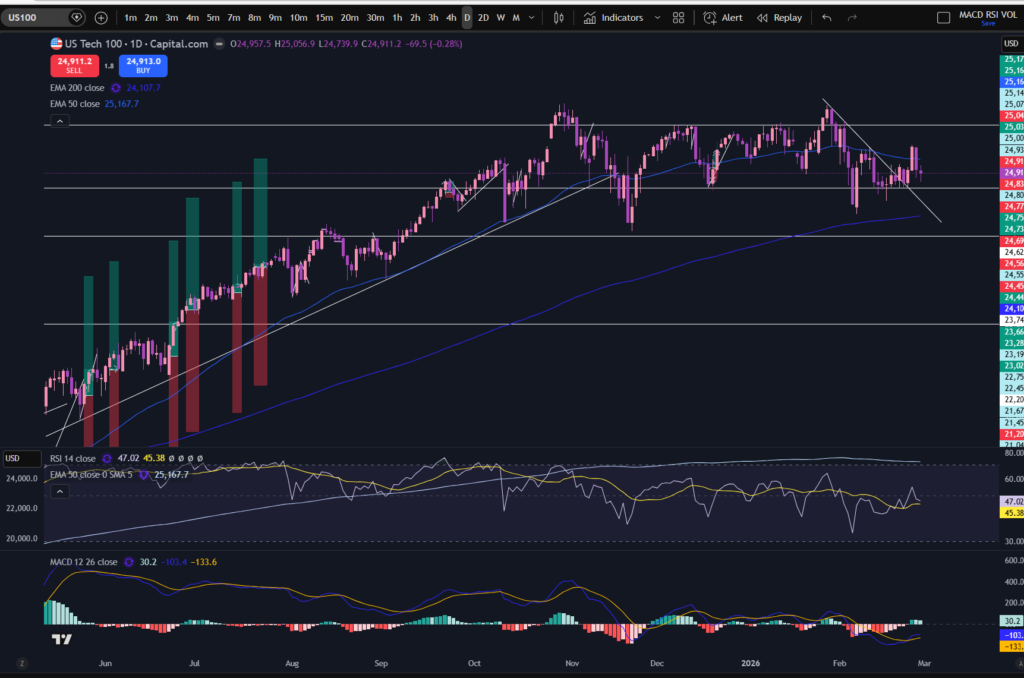
Overall the price on Cocoa has been down trending long term. Let’s take a closer look using the daily time frame:
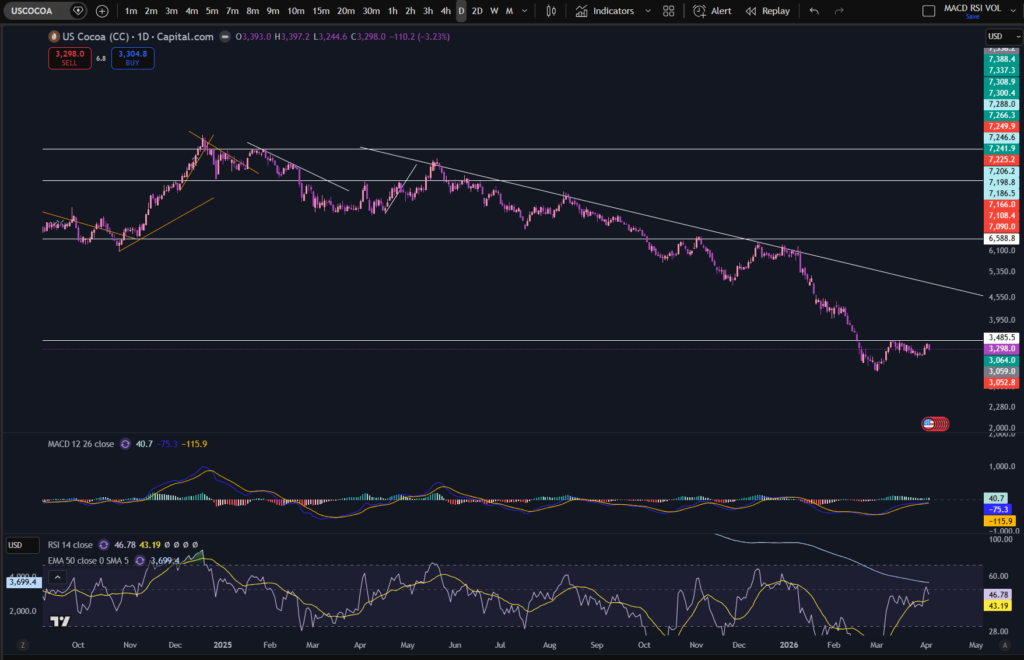
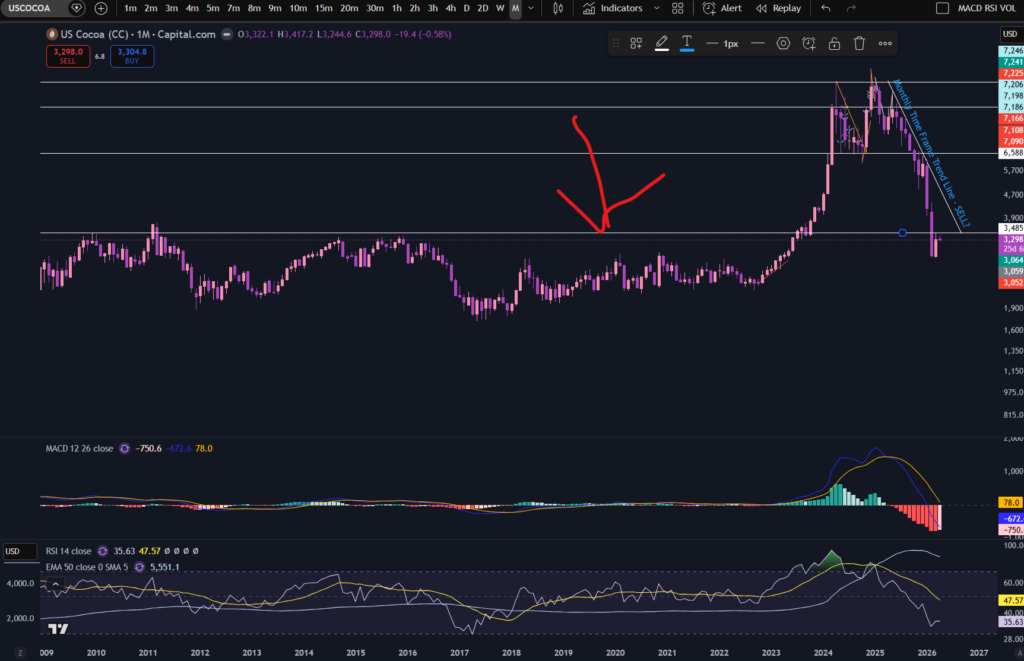
As you can see, the daily timeframe does not really add anything additional here, other than being able to see the support and resistance lines very clearly The MACD Indicator shows the price is currently pushing up in the nearer term. It looks as though it’s trying to push up to make a higher low, but we will need to wait and see what happens…
How to trade commodities – Cocoa – So how could you plan a trade on this market?
So in understanding the answer to the question, how to trade commodities, I hope you can see that you can use the support and resistance lines to plan where to enter and exit your trade. You want to trade close to the ‘structure’ of the pattern and allow the price to move away from it. You would have to decide which support or resistance line to use, and when but I hope you can see the potential for predicting price movements, from this article.
I hope you found this article helpful.
Disclaimer!
Nothing on this blog should be taken as financial advice or encouragement for you to enter a trade. You are expected to speak to a financial adviser or carry out your own due diligence before entering any positions. Everything on this blog is made for educational purposes and to equip you with the knowledge you need to be able to make your own financial decisions.
For more great tips and advice on trading the stock market, please visit:
https://www.sophiatrades.co.uk
To watch me trade live please visit my patreon page here:
https://www.patreon.com/sophiatrades
Finally, if you would like to receive a discount on the Trading View charting software I use, please click on the relevant link here:
https://www.tradingview.com/?aff_id=117138
Please note any subscriptions taken via my affiliate link with Trading View may result in me earning a small commission. However, I provide complete transparency on me using Trading View personally – I publish my success on the financial markets via my broker reports and any profits earned were done so by using my own Trading View subscription, so I genuinely do recommend them and have been using the Trading View charts for many years.