How does a dividend affect a share price? This is an important topic for any trader and definitely something you should be considering before placing any trade – both in general and in relation to the timing of the specific stock you are interested in trading. I’m going to talk about what a dividend is, how this affects the price of a stock and how you can prepare for these fluctuations as a trader.
We want to answer, “How can a dividend affect a share price”, but first of all, what is a ‘dividend’?
So…. back to companies 101…. we know that a company is a business (or it can be an investment vehicle) in a legal entity ‘wrapper’. It is treated as a separate person entirely, from the business owner(s). The business is split into portions like dividing up a pie and these portions are the ‘shareholdings’ of the company. So the people who own the business are the ‘shareholders’ and they each own a piece of the company in accordance with their share holding and certificate, like a slice of pie. A dividend is a mechanism by which, the business pays out some profit to its shareholders.
So how do dividends come about?
In order to determine an answer to the question, how does a dividend affect a share price, we must first also understand how dividends come about! Any assets or income belongs to the legal entity of the business and is received within the legal entity. In order to distribute some of this income to the owners of the business (the shareholders), a ‘dividend’ must be declared and paid. The business will declare a dividend from ‘distributable profits’ only. If they do not ensure the dividend is made from ‘distributable profits’ it is possible the dividend will be made illegally. This is a slightly different topic but the directors basically need to ensure that the business has got enough cash and spare money before paying the shareholders a dividend, to make sure it is being fair to its creditors. The worst case scenario which could occur is that the company could pay a dividend and it depletes funds needed to pay creditor liabilities – this is why they must be paid from ‘distributable’ reserves. This is a slight digression, but it was worth noting here for anyone who does not know much about companies and how they work.
OK, so back to where we were… the directors of the company will assess whether the company is in a position to pay a dividend, and they will ‘declare’ it / in other words, they will announce to the market, that they have decided a dividend will be paid. This is the ‘ex dividend’ date – which is important. The cash payment of the dividend will follow a little while later and will be paid to the share holders in accordance with their slice of pie share holding. So if the company is divided up into 10 slices of pie (shareholdings) and they are all equal shareholdings, and the company declares a dividend of £800, what this means is that each slice of the pie shareholding will receive £80 as a dividend.
Are dividends mandatory?
No – dividends are not a mandatory thing on the part of the directors. They need the freedom and discretion to be able to examine the company’s financial position, prior to making any dividend declaration, and consider whether the company can afford to make a dividend from its distributable reserves.
Not only this, but some companies do not usually pay dividends and other ones do. It is entirely in the discretion of the directors and they are usually following the particular customs of the company in question. If a company usually pays a 1% dividend to shareholders, the shareholders would be in a position where they are accustomed to receiving this, and they would expect it. Indeed, it may be the reason they purchased those shares – some shareholders just purchase shares for the purposes of receiving dividends, and some shares pay more dividends, and pay more ‘often’ than others – so if the investor is someone who is interested in receiving dividends as income rather than more capital growth from his/her shareholdings, they may tailor their investment portfolio to the companies which pay dividends regularly and at a good rate. Notwithstanding this, the discretion of the directors must always be applied to ensure the dividends are not made illegally (from non distributable reserves – depleting funds for the creditors).
So how does a dividend affect a share price then?
So when a company makes a dividend, this dividend is in effect, the company paying out some of it’s earned profits to the shareholders. The company’s worth (share price) is based on it’s assets and earnings potential – it’s an estimate by the market based on supply and demand, of what people think that is worth! So when the company pays out some of it’s worth as a dividend, it is literally depleting the balance sheet of reserves and profit/cash – which could be used to buffer the company from any troubles, buy more assets, grow the business etc. I’m not saying paying a dividend is a bad thing but it ‘must’ affect the share price – logically, it will.
So when the stock goes ‘ex dividend’ (when the dividend announcement has been made), you can expect the stock to take a temporary nose dive in terms of the share price.
How can you plan your trades around this?
Make sure before you open a position on an equity, that you know what the next ex dividend date is, and be prepared in the plan of where to enter and exit, for the drop in share price when the stock goes ex dividend. If you are confident that there will be no significant impact from the question, how does a dividend affect a share price that’s fine… but it could affect your win rate if you ignore this and get in anyway!
I hope you found this article informative on resolving the question, how does a dividend affect a share price. Perhaps if you did, you can leave a comment below!
Disclaimer!
Nothing on this blog should be taken as financial advice or encouragement for you to enter a trade. You are expected to speak to a financial adviser or carry out your own due diligence before entering any positions. Everything on this blog is made for educational purposes and to equip you with the knowledge you need to be able to make your own financial decisions.
For more great tips and advice on trading the stock market, please visit:
Please note any subscriptions taken via my affiliate link with Trading View may result in me earning a small commission. However, I provide complete transparency on me using Trading View personally – I publish my success on the financial markets via my broker reports and any profits earned were done so by using my own Trading View subscription, so I genuinely do recommend them and have been using the Trading View charts for many years.
Many traders and investors are asking the question ‘Are the markets going to drop in 2026?’. In this article I take a look at the current state of the markets and whether a drop could be possible and most importantly, what you can do if they do drop and in the meantime! Let’s get straight into it!
Are the markets going to drop in 2026? Where are they right now?
Currently many of the most popular and most liquid markets, are very overbought. They have reached record highs. Let’s take a look at some examples:
Are the markets going to drop? – Gold
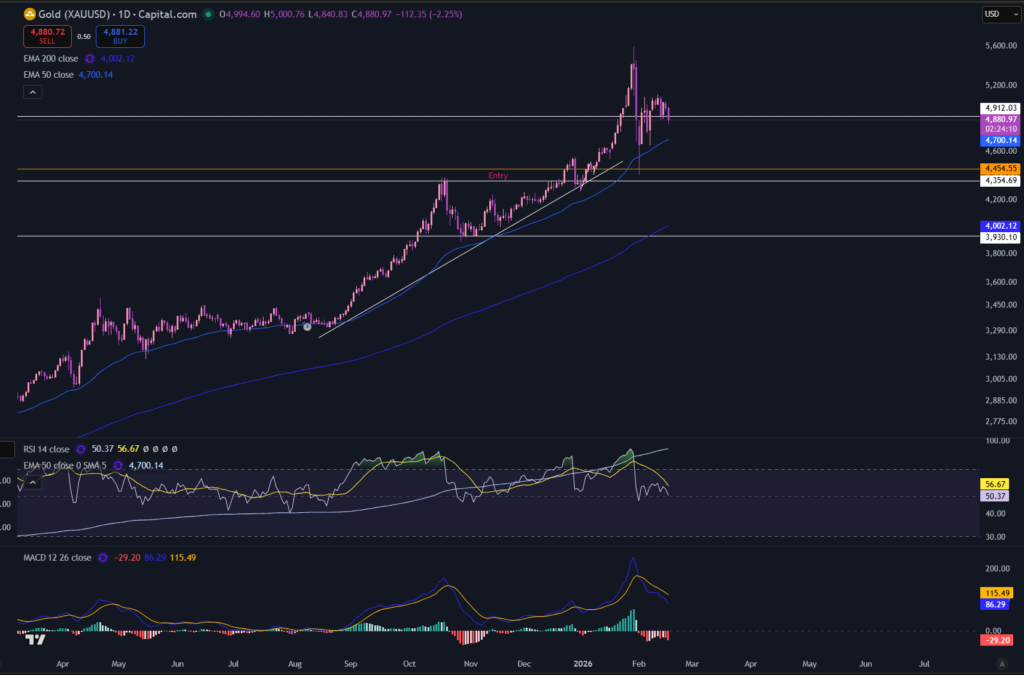
Gold has reached record highs. The chart recently reached a price of circa 5,615 USD but they took a slight downturn from this – let’s take a look at the chart to see if we can get start to answer the question, are the markets going to drop in 2026:
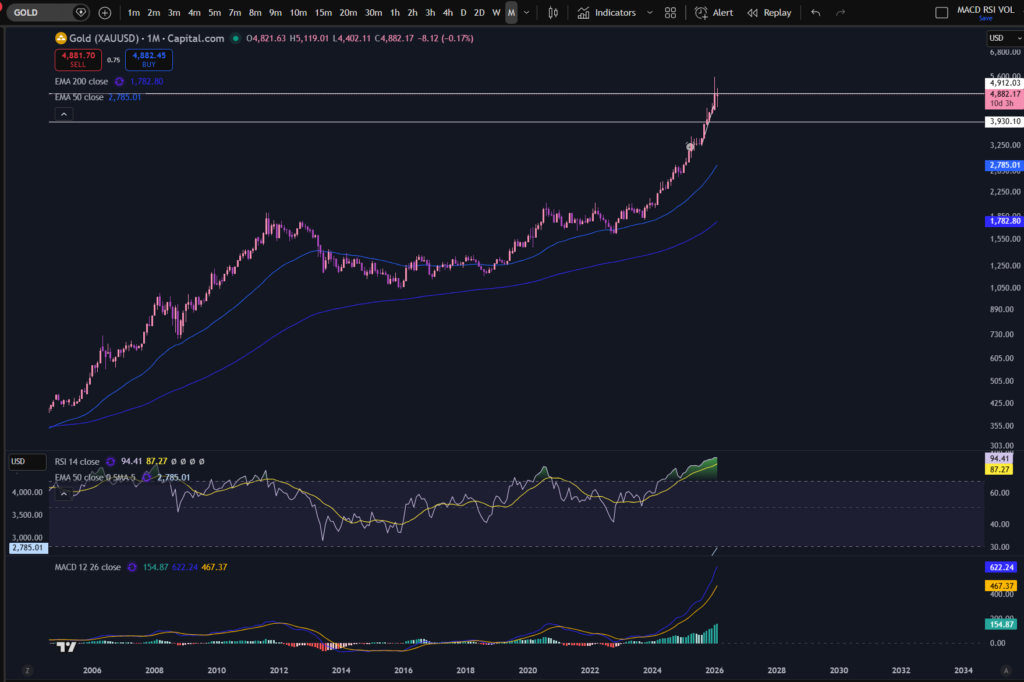
As you can see from the daily chart, Gold has pulled back from it’s peak. Let’s take a look at what’s going on, on the monthly chart, as this can give a better ‘birds eye’ view:
As you can see on the monthly chart, Gold has reached record highs. The RSI is currently very overextended and it wouldn’t be surprising if the market were to pull back farther than the little dip it’s made on the daily timeframe. However, nobody can predict whether the markets are going to drop – or what they are going to do. The FEDS have cut interest rates in America and this can have a positive effect on some of the markets. We are in a bit of an unprecedented situation. History tells us that when so many markets reach these types of highs, they do pull back quite a bit. It may be just a question of time!
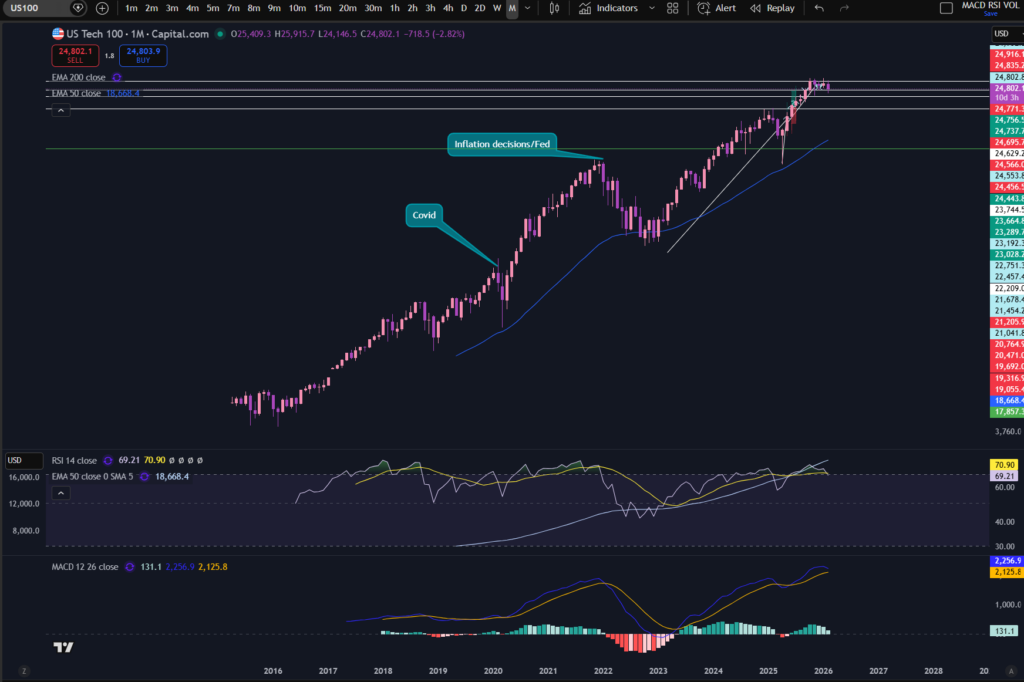
As with the case of Gold, you can see on the monthly timeframe, that the NASDAQ has sailed sky high. Take a look at the RSI and the MACD which is now bumping over to the downside! The green histogram bars on the MACD indicator are losing their pigment meaning they are losing strength currently and they are becoming smaller in size! For information I have added what happened to the markets during Covid and also the inflation struggles which have happened over the last few years and the effect of the FED’s interest rate increases on the markets.
The soaring prices on the NASDAQ have partly been inflated by expectations concerning AI and future profitability predictions surrounding this. Some people believe the AI bubble could burst. Nobody truly knows what will happen, however.
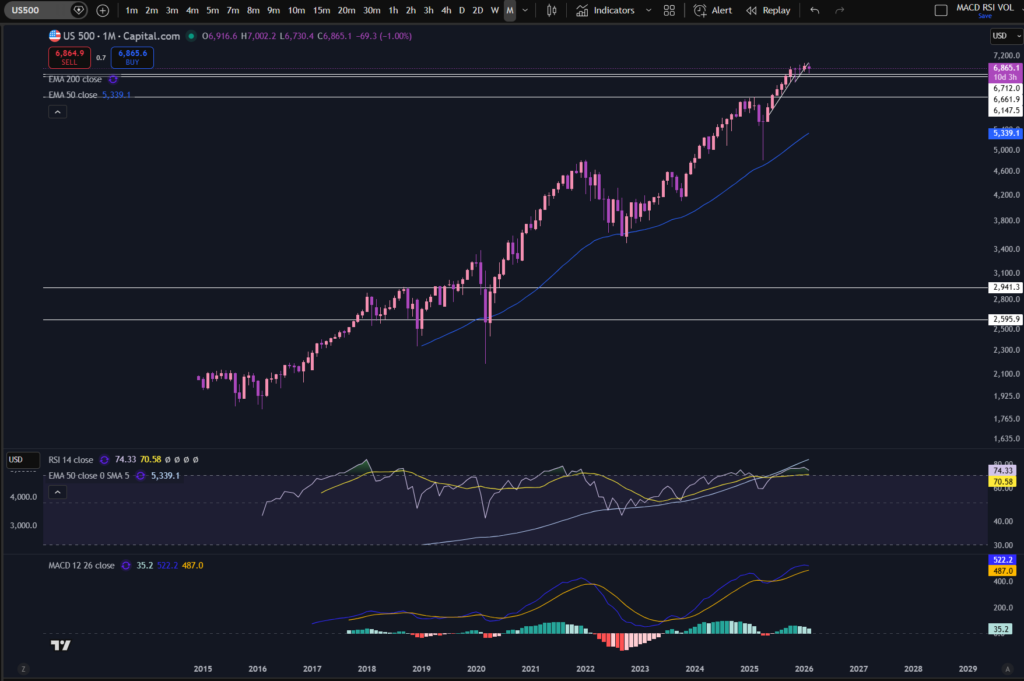
Let’s also take a look at the S&P 500 chart for good measure!
As you can see, it’s the same story on the monthly chart for the S&P 500! RSI over extended, MACD bumping over, prices at record highs.
So what to do in the scenario that the markets do ‘pull back’
Try and keep some money aside to take advantage of them on their way back up. Experienced traders and investors do not panic when the markets drop – they have dollar signs in the eyes! There is a saying that most profit is made at the time of purchase, not sale! The wealthy investors will be watching and waiting, and going shopping at the relevant time! Will you be one of them, or will you start panicking? Which one do you want to be?
It’s a good idea to do some research before the markets pull back, into which solid stocks could generate solid returns after some time. It’s a good idea to pick stocks with healthy balance sheets, in sectors which are likely to do well, and try and be diversified to hedge your risk. I posted a video on how you can carry out fundamental analysis of a balance sheet or profit statement, which you may find helpful:
Traders can manage risk in a slightly different way – there are plenty of articles on this blog about how you can manage risk. Currently, for example, I am entering small positions until the market starts moving in my favour and then I load up. This is similar to the averaging up which investors do, but I do this in trading now as well.
Conclusion – are the markets going to drop
My strong suggestion to you is to not fear the question ‘are the markets going to drop’ but rather see the this as an inevitable situation and a significant money making opportunity! Plan for the drop to happen – it will, periodically! Keep cash aside for these times to be in the best possible position, to take full advantage.
I also prepared a YouTube video on this issue which you may find helpful to watch:
Disclaimer!
Nothing on this blog should be taken as financial advice or encouragement for you to enter a trade. You are expected to speak to a financial adviser or carry out your own due diligence before entering any positions. Everything on this blog is made for educational purposes and to equip you with the knowledge you need to be able to make your own financial decisions.
For more great tips and advice on trading the stock market, please visit:
Please note any subscriptions taken via my affiliate link with Trading View may result in me earning a small commission. However, I provide complete transparency on me using Trading View personally – I publish my success on the financial markets via my broker reports and any profits earned were done so by using my own Trading View subscription, so I genuinely do recommend them and have been using the Trading View charts for many years.
I made 180% profit trading Google within the space of a few months and I wanted to explain to you how I achieved this. In this article i’m going to talk about my entry points, why I selected Google to trade, where I planned to exit and how I averaged up in this trade which is an approach I’ve been using more recently, to handle the turbulence in the markets, and Donald Trump’s announcements!
I made 189% profit trading Google, but why did I chose to trade Google Class C to begin with?
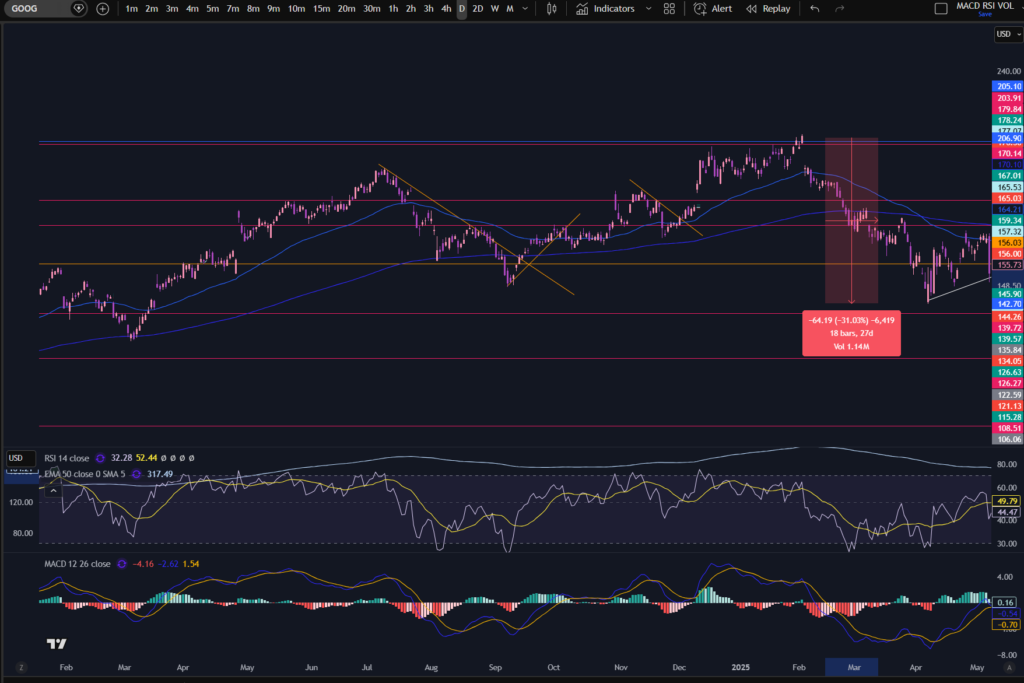
I chose to trade Google Class C because I had identified an opportunity. This is a successful company which is investing in modern technology. It has a good product range and I considered it is not likely to go into liquidation, any time soon! The price had dipped right down due to Donald Trump’s tariffs and other news releases. I saw a large opportunity:
If you would like to use the Trading View software pictured above, in your analysis, I can get you a discount – click the link below:
The price had dipped right down by about 30% as you can see in the above chart. This happened in the Summer of 2025. I had predicted that the price would return back up to previous highs and potentially beyond… and I would end up making a large profit trading Google – and this is exactly what it did.
I got in near the bottom where you can see I drew a diagonal support line above.
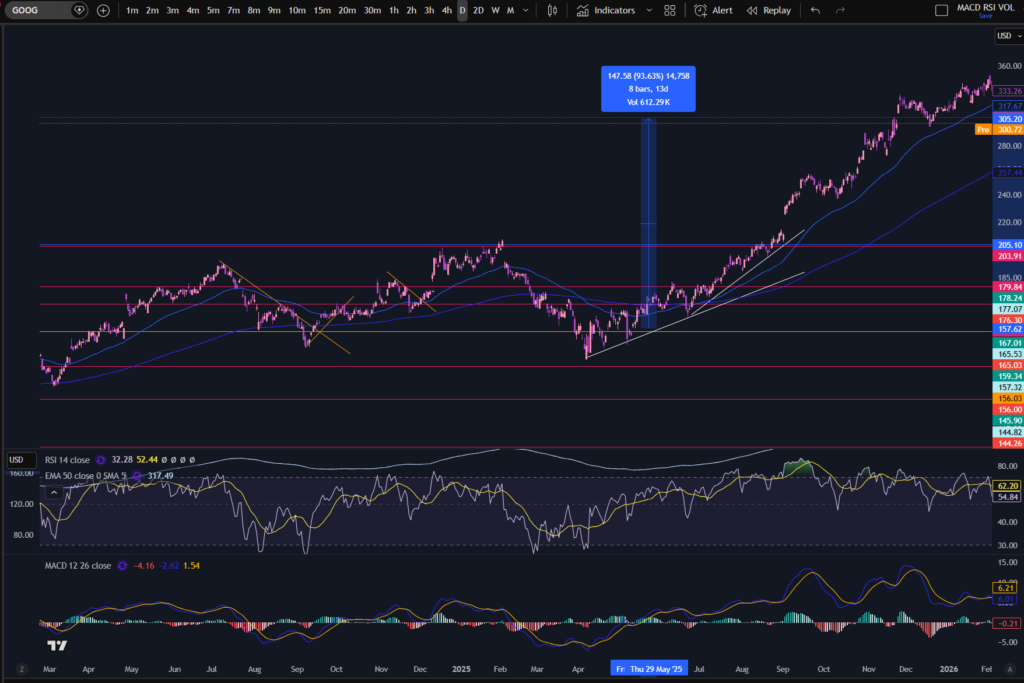
I took a smaller position size to begin with. This is a new approach I have adopted as outlined in one of my previous articles (here):
My latest approach is to take a smaller position at the outset and then add to this as the position goes in the direction of my favour, instead of using a stop loss. This is what happened afterwards:
You can see in the chart above, that the market actually returned about 90% profit in the time I was in my trade, but how did I make 189% profit trading Google? I loaded up as the market moved in my favour so by the time it reached the top, I was carrying quite a large position and I had scooped up several staggered entry point profit tranches, between their entry points, and the 90% ‘market profit level’ marked on the chart.
As I explained in the above linked article, this approach has made me significantly more money while trading the stock market – President Trump did me a favour in my trading style! I could not be more grateful to him for the turbulence he created.
I consider the sky really is the limit in my trading now and I’m excited to continue with this approach. Thanks Trump!
Please note any subscriptions taken via my affiliate link with Trading View may result in me earning a small commission. However, I provide complete transparency on me using Trading View personally – I publish my success on the financial markets via my broker reports and any profits earned were done so by using my own Trading View subscription, so I genuinely do recommend them and have been using the Trading View charts for many years.
Hi guys! So I want to talk to you about your corporate jobs. Maybe you are not doing a corporate job, but some other job… a job that you hate. A job you do to earn money – it’s sucking the life out of you, and you’re not sure how you can keep doing it. I want to talk to you about some things which can help you to keep going if you are in this scenario (until your escape)… If you are a woman who wants to escape the corporate hell, this article is aimed at helping you… let’s get straight into it!
Some things which can keep you going while you are waiting to escape the corporate hell as a woman…
If you are desperate to escape the corporate hell, you want to have a plan for your self – an exit plan. On this blog I help women learn to trade and invest in the stock market. If you are terrified of trading, you can be more of a passive investor rather than trader and it will still provide you with an exit plan from your corporate hell job. Investing will take a long time – I know what you are thinking! But here’s the thing… do you want to be someone who is completely free in ten years’ time, or someone who is still STUCK IN THE CORPORATE HELL in ten years time? Imagine that!
Those ten years will go by either way. You are going to get there. You will go through those ten years no matter what. At the end of those ten years, you will either be Sarah or Marylin who still works in her awful corporate job or you will be someone who took control ten years ago and freed yourself.
I’ve given advice on my youtube channel and other blog articles about how long it will take for you to become a guaranteed millionaire. Here’s a link to my youtube video on this:
You just need a plan for yourself and you need to stick to it with complete discipline. When you have that plan in your head, it helps you to keep going. The office politics and garbage which goes on in your corporate hell job, where men take credit for your work and you need to work three times as hard as them to get half of the recognition and pay….all of this garbage which goes on and consumes your energy, will no longer be relevant. You will surpass these people. In ten or twenty years time, they will just be distant memories. You will look back and laugh. So i’m guessing after listening to the above video, you now have a plan in mind about investing and your exit/escape, and at what point your exit can literally happen – a guaranteed date in the future, based on the rate at which you can invest.
Some things which can help you on your journey…
Let’s talk about the things which can help (or hinder!) you… I’ve been there, in all walks of life – I used to have a Central London job, commuting on the train every day… each morning, I would buy a latte and a croissant from Costa Coffee… in those days it used to cost about £4 or £5 per day. That was over ten or 15 years ago. These days it’s probably costing a lot more. If I told you how much this would cost over a ten year period, in lost investment opportunity, (or 20 years – even worse!), you may be very horrified… Let’s take a look:
Ten years of spending £5 per day on a coffee and snack in the morning will set you back c.£29,000 in lost investment earnings at an assumed stock market return rate of 15%. Please see the Compound Interest Calculator website, as explained in my above video!
Twenty years of spending £5 per day will cost you a whopping £162k….
Yes, you read this correctly.
One hundred and sixty two thousand pounds, over a twenty year period – on croissants and coffee.
At that point in time, if you had accumulated those funds in the stock market, the return (and therefore, yearly income) would be £162k x 15% = £25k per year, annual income.
So let’s sum that up… if you choose to put your £5 per day into an investment account and keep doing it for 20 years, you will have achieved a capital balance which would be enough to live on in some countries – example, it can cost 1,000 euros per month in living expenses in some of the European countries like the Greek islands, Portugal etc. Half of your annual income on your saved coffee money. You would live like a king in Thailand or somewhere similar I bet!
That could be an escape right there – without any further effort on your part! OR… You could have your coffee and snack on your way to your big corporate hellish job, every day, for the rest of your life/till you retire and always be trapped in that? Which would you prefer? This is just the coffee and croissant money – I’m expecting you might be able to spare a bit more than that, and get your £1m by the time you quit the corporate hell – then you can literally do whatever the hell you like, and live wherever you want.
Don’t forget, you can always buy a multi pack of croissants from Aldi each week and just take one with you! It doesn’t need to be complete suffering and austerity! Get yourself a lovely travel mug and take a nice coffee with you as well! This is also better for the environment so an added bonus! Obviously this lesson does not just relate to coffee – are you spending money on other things which can be avoided and the money invested instead? Lottery tickets? Newspapers? Cigarettes? Chocolate bars from the Central London shop instead of buying a muti pack from Tesco with the weekly shop? The list is endless of where you could find money to invest.
Make the corporate hell worth it…
Hear me out on this…It’s never going to be enjoyable, but overall, you want to make the hellish nightmare of a corporate job worth it in some way – for yourself. You want to be doing it, for YOU… Not your boss, not the employer, not the business. If you use the money in a smart way and built wealth and an escape route you can justify having to deal with it. It is way less justified when you spend the money on coffee and croissants and it’s causing you to be trapped in that nightmare, FOREVER.
A word on switching the corporate hell in one job, for another
So we’ve discovered we always want to have our ‘plan’ in mind while we are putting up with the corporate hell. Another issue I want to talk to you about, is ‘moving jobs’. Sometimes it’s easy to think “if I get a new job, everything will be fine” I can almost guarantee you, it won’t be. The grass will not be greener. You will get the same sorts of issues with different people and managers. All of the jobs are expecting you to work free overtime to sustain the activities of the business. It’s corruption at it’s finest. Tesco is not expected to give out free food, but for some reason, employees are expected to do free overtime and charity work for their employer…This will be the same in any job.
Here’s a reason you might want to actually move though:
Your boss is a complete narcissist and it is literally destroying you, and is becoming very toxic emotionally for you – it’s way beyond normal corporate hell issues;
If they are not paying you the market rate for your experience. This can happen if you are in a job for a long time, through lack of pay rise/inflationary rises. This second issue will affect your ‘plan’ because you will need to work longer to get there. So if your rate of pay is negatively affecting your plan, this would be a good reason to move.
If the issues you have in work are the bog standard, free overtime required, your boss is annoying, you have men trying to undermine you as a woman in the work place, my suggestion is you just stay there and invest more heavily and in the back of your mind, laugh at them. Laugh at the fact that you are on your way out, literally, and Derek and Bryan will still be d*ck measuring for a measly 3p per hour promotion in the office, when you are long gone.
So, to sum up, if you want to escape the corporate hell, you need to TAKE CONTROL. Make a wealth building journey ‘plan’. Work out exactly how much you need to invest regularly to become a millionaire. Write down the plan and commit yourself to your escape route. This is 100% doable. This is how the wealthy people became wealthy – by investing in the stock market.
You do not need a lot of knowledge to become a passive investor – you could put a set amount from your salary into one of the indices like the S&P 500 which is the average of the top 500 stocks in America and just leave it there and watch it grow!
Let’s generate wealth independently, together!
If it’s easier for you to digest this on a video, please see the video below.
For more great tips and advice on trading the stock market, please visit:
Please note any subscriptions taken via my affiliate link with Trading View may result in me earning a small commission. However, I provide complete transparency on me using Trading View personally – I publish my success on the financial markets via my broker reports and any profits earned were done so by using my own Trading View subscription, so I genuinely do recommend them and have been using the Trading View charts for many years.
In this article i’m going to talk about how you can read and understand a balance sheet with a view to carrying out fundamental analysis. This is key if you want to rely on fundamentals as a stock market trader. This article may also be useful for junior accountants as a general guide. Let’s get straight into it! In short, every set of financial statements which you will be able to find online about an entity you may be interested in trading, is comprised broadly of a balance sheet, a cash flow, and a profit and loss statement. The balance sheet will give you key information about the health of a company, the position it’s in at a set date (like a snapshot in time), in terms of whether or not it is able to meet its liabilities, how long it is likely to continue trading for etc. The profit statement and the cash flow will be covered in a separate article. I will also provide a separate article on reading balance sheet ratios.
What is a balance sheet – background
The notion of a balance sheet came from the ‘double entry’ accounting concept, thousands of years ago. I believe this originated in China, and it resulted from the double entry accounting method which was used as a way of keeping tight control of money in an organisation. The balance sheet is formed by a simple concept – for every ‘debit’ in a set of financial statements, there is a corresponding ‘credit’. At the end of a period – say, a year, all of the debits will be equal in value to the credits in the accounts. Why does this matter? Why do we make ‘double entries’ in a set of accounts? The idea is that for every asset or liability added to the business, there is a source or corresponding entry to denote what it relates to, or from whom it came, and correspondingly, to whom it will be paid at a later date. For example:
Share capital/premium adjustments – when making an addition to share capital in a set of accounts, we make a ‘credit’ to equity share capital/premium in the company’s accounts, and a debit in the company’s cash records for equal value. The credit denotes that the company owes money to the relevant shareholder. It’s a credit for that person/to that person. The debit records a receipt of an asset for the liability owing to the shareholder – a chunk of cash, which would have been received in the company’s bank account.
Note that debits on the balance sheet represent assets for a company or organisation, and this will feel odd to the reader of this article… mostly we associate credits with ‘good stuff’ but you must understand that the credits in your bank account, represent ‘debits’ for the banker, on the other side of the fence. You are only one party to that transaction. In your banker’s accounts, when you pay money into your bank account, they make the following entries:
Debit cash – assets for the bank
Credit liabilities – to Joe Blogs – (we as the bank, owe him this money which he can withdraw from an ATM whenever he likes etc).
Now, back to the balance sheet! I’ve explained that assets on a balance sheet are debits and liabilities are credits. As I explained, at the end of a period like a year of account, all of the debits for the assets recorded, will equate to the same value of ‘credits’ in the same period. In this way, the company will have a record of all assets, and the people to whom money is owed for those assets. The money could be owed to shareholders as i’ve illustrated above, or directors – by way of directors’ loans… it could also be owed to a bank – again, it’s the same concept… in the company’s accounts, they will debit cash, credit liability to HSBC or whichever bank is involved.
Balance Sheet – the features you will see
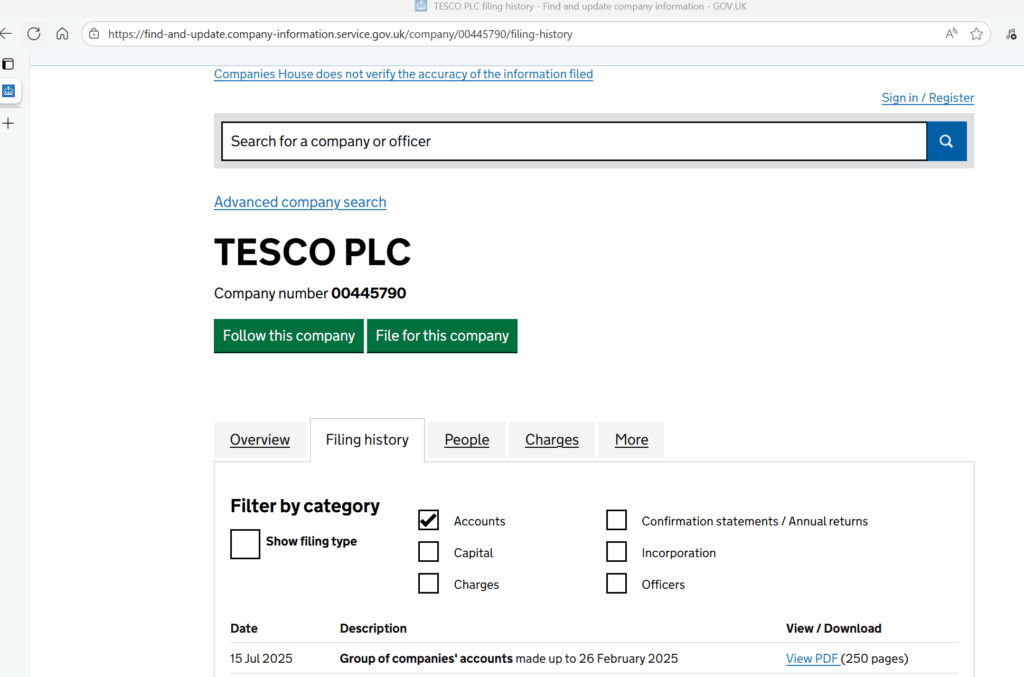
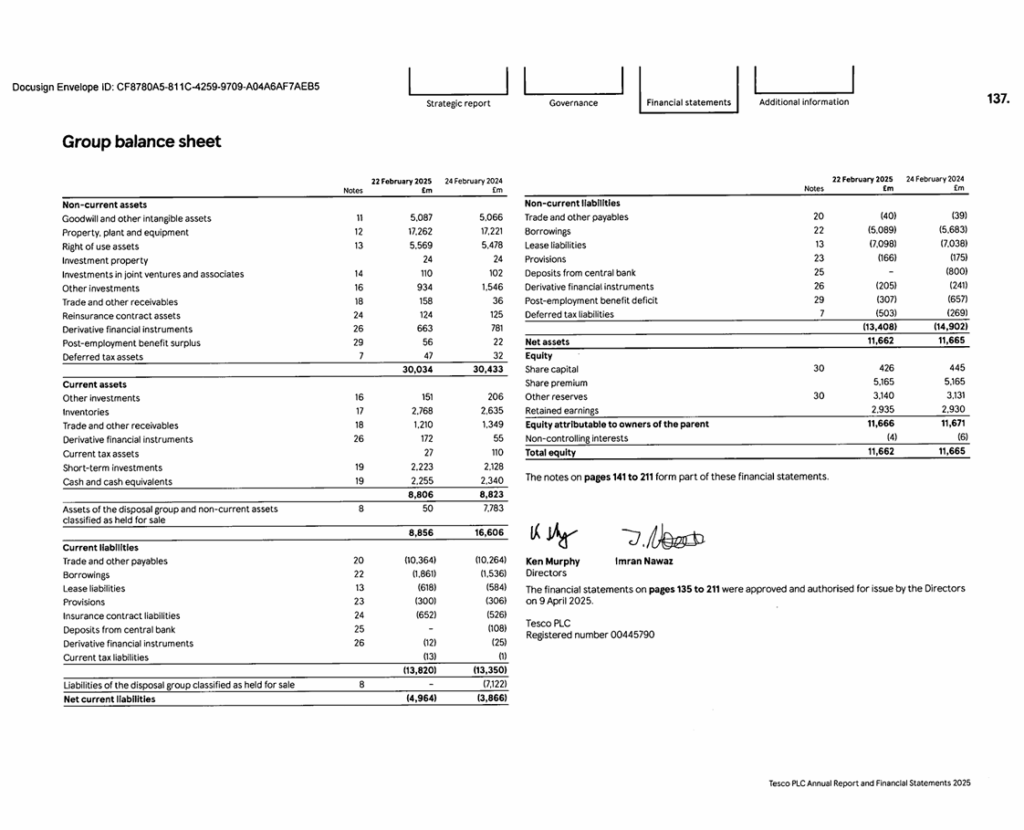
OK so now that i’ve explained to you what a balance sheet actually is, and how it comes about, let’s take a look at some real life examples. I’m going to show you the balance sheet of a well known retailer (Plc). PLC stands for ‘public liability company’. This means anyone can buy its shares. They are traded publicly on an open stock exchange. Let’s take a look at Tesco Plc’s balance sheet for the last year as published…
I’ve gone to the Companies House website in the UK and filtered for Tesco Plc, and then ‘accounts’. Anyone can retrieve this information from Companies House in the UK in respect of UK registered companies. This is free for the UK. However, there will be equivalent registries for companies in the United States etc for which there could be a charge payable.
Here is the link for obtaining this data… note that this search function is not restricted to PLCs. You can also retrieve information about ‘Selfridges’ the retailer on Oxford Street, for example, which is privately owned. You will not find Selfridges in your trading broker account.
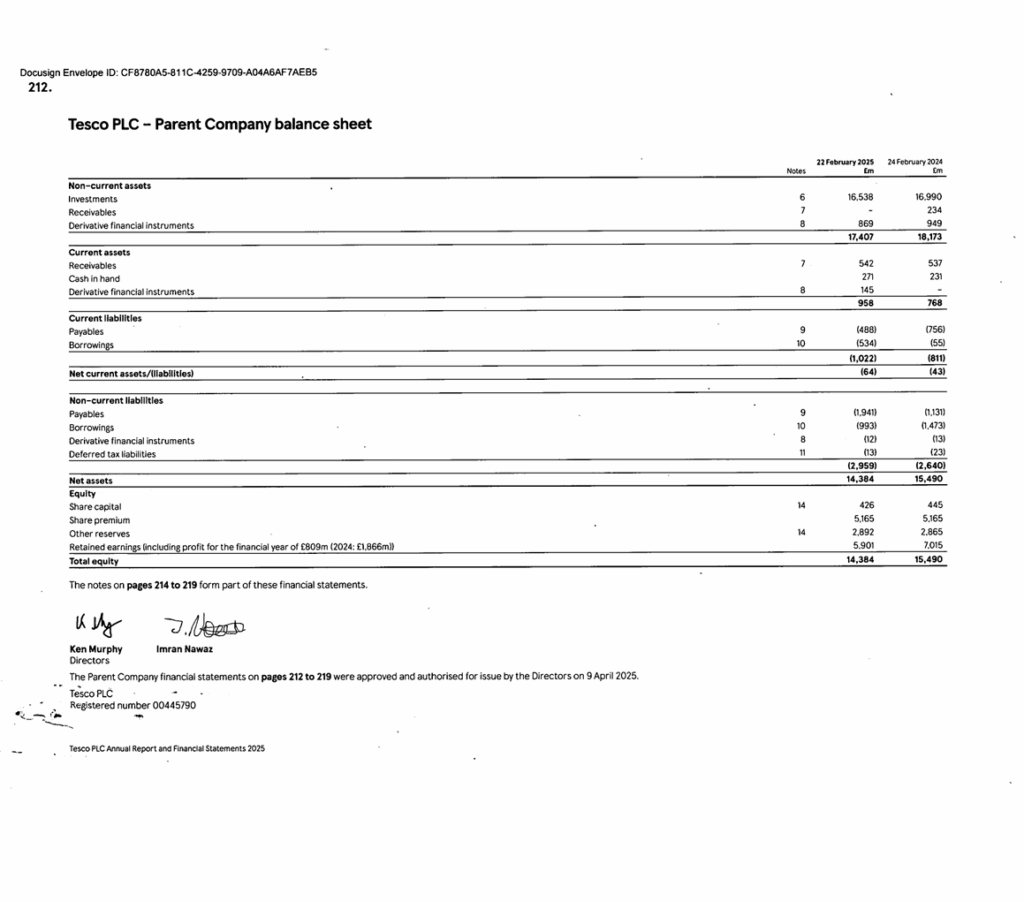
Group balance sheet vs Parent balance sheet – what’s the difference?
OK, so the first thing to note, is that there are two balance sheets… why is this? One of them relates to the ‘parent company’ only. It represents all of the assets and liabilities recorded in relation to the legal entity of Tesco Plc, solely. In contrast, the Group balance sheet, will also include the assets and liabilities of all of the company Tesco Plc’s, ‘SUBSIDIARIES’. Every time Tesco Plc buys another legal entity’s shares, and holds the controlling shareholding (>50%), it will have obligations and rules to follow in terms of reporting what the newly acquired assets and liabilities are in those subsidiaries, along with its own assets and liabilities. In the accounting world, once a parent obtains ‘control’ of another entity, it is viewed, almost like it’s the ‘same company’. Its basically the same people running both. The numbers are presented in group accounts, like it’s the same legal entity therefore.
Health of a company – a quick glance!
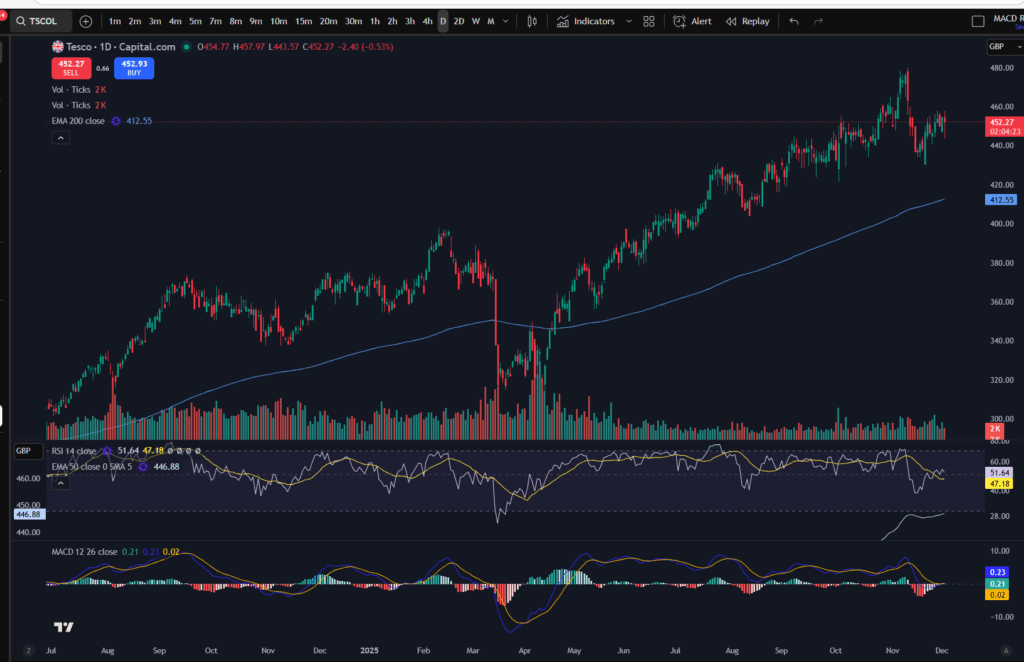
Before we get into what the actual assets and liabilities are, it’s important to note whether the company is in a position of net current ‘assets’ or net current ‘liabilities’. If a company is in a net current liabilities position, this is not a great sign as a start! It means the amount of assets it could convert into cash within the next year, will not cover the amount of liabilities the company is due to pay/discharge within the next year. As you can imagine, a company in this net liabilities position, may be finding things a struggle in terms of meeting liabilities as they fall due. Tesco’s position is that it is in a net liabilities situation, with assets recoverable within one year of £8.8m and it’s liabilities due within one year are £13m! I thought it might be interesting to take a quick glance at the company’s stock chart – when you compare this type of information, this is where it can get interesting! Interestingly, the company’s share price is growing per the daily timeframe below… obviously the net liabilities position is not something you will see simply by looking at the charts… if you are worried about a net liabilities position, you should most certainly check the directors’ statement in relation to ‘Going Concern’ and also the auditor’s statement on this.
Assets
As you can see, Tesco Plc has got a number of assets listed on its balance sheet. I’m going to talk about the group accounts going forward, since any time you buy shares in Tesco Plc, they will be affected by the performance of any of its subsidiaries too.
Let’s run through the items listed on the balance sheet, and I will tell you what they likely relate to…
Non current items:
What do we mean by ‘non current’? These are items which are going to mature/become payable after one year from the date of reporting.
Goodwill – this is an accounting adjustment which recognises and puts a value on, built up trust and reputation in any subsidiaries acquired. You don’t really need to focus on this very much when considering the company’s health.
Property, plant and equipment – this relates to property used in the business (not investment property), plant and machinery – any computers, tools, diggers, cars – basically anything which is purchased for the purpose of ‘running’ the business. Investments are categorised separately. These types of assets are held on the balance sheet at a value which is made up of cost less depreciation. (A regular adjustment is made to reduce the value on the balance sheet to represent the use of the asset over time – and this is known as depreciation).
Rights of Use assets – there was an accounting rule change a few years ago, and any leases now need to be recognised on the balance sheet either as liabilities or assets. In this scenario, the rights of use assets probably related to rented premises.
Investment property – this is where any properties held for investment purposes, where the company is receiving rental income, will be held. The values there represent the market value of these properties.
Investments in joint ventures and associates – these are investments in companies where Tesco Plc does not own the ‘controlling’ shareholding. It does, nevertheless, own some shares in other businesses as you can see.
Other investments – I have not checked the detail of these but note that you can check the notes to the accounts and you will find a ‘balance sheet note’ in respect of each item listed on the balance sheet. If you are unsure of what something relates to, you can check the notes to find out more information.
Trade and other receivables – these assets relate to contracts where other companies and people owe Tesco some money. A typical example is where another retailer may be selling some of Tesco’s goods and they owe Tesco money for items received. It could also relate to money paid on account, by Tesco to its suppliers. Until they ship something to Tesco, the ‘cash’ held at the other supplier company, is still owing to Tesco. ‘Other receivables’ could be staff loans, HMRC balances due to Tesco – for eg. where they have overpaid tax. Note that these items are non current. Typically, trade receivables such as supplier accounts, will fall under the current category (i.e. due within one year).
Reinsurance contract assets – these are amounts which are ‘recoverable’ from insurance companies. They are due to be paid/discharged to Tesco.
Derivative financial instruments – these can be complex financial instruments. It could be where the company has hedged its foreign exchange exposure for example – a ‘forward’ contract guarantees that Tesco can purchase another currency at a particular rate in the future, for a set period of time. This contract is a derivative financial instrument. It can be a liability or an asset, depending on which way the exchange rates have gone compared to the rate achievable under the contract.
Post employment benefits surplus – this is likely an accounting adjustment relating to employee liabilities. It could relate to holiday pay owing to the staff for example.
Current assets
Current assets are items which are payable or will become due, within one year. This is important for your fundamental analysis!!
Some of the items here are self explanatory – inventories for example – how much stock the company holds. The assets under ‘current’ assets are listed in order of liquidity (how quickly they can be converted into cash, with cash at the bottom).
Trade and other receivables – we talked about these above. These ones will be payable/due within one year.
Current tax assets – these are amounts due from the tax man payable within one year.
Short term investments – these are investments which are expected to mature within one year.
Cash and cash equivalents – this is what it says on the tin! It will be the amount of cash in the company’s bank account. Cash equivalents can represent assets which are very liquid and exchangeable almost immediately – like vouchers for example.
Current Liabilities
The liabilities listed under ‘current’, are all payable within one year.
You can see that the company has got some typical liabilities you would expect for a food retailer –
Trade payables – this is the amount due to its suppliers within one year
Borrowings – this will relate to the ‘current’ part of any bank loans payable
Lease liabilities – this could be for plant and equipment or rental premises
Provisions – these can relate to potential law suits or ongoing ones. It is likely that the accountants will ‘assume’ some will be inevitable, and they will estimate an amount each year. They could also relate to expected warranty claims in manufacturing businesses.
We’ve talked about the other current items as assets, so when they appear under the current liabilities section, they represent the amounts Tesco owe to someone else, for the same items.
Non Current liabilities
These represent items which are payable by Tesco after one year’s time. The items listed are self explanatory in light of my notes above.
Equity
This is generally where the share capital and premium goes – if you buy a share in tesco for £1, your £1 share credit will be sitting in this section of the accounts with your name attached! They also pay out dividends from this area.
This area collects profits each year which accumulate (or losses!!). These go under ‘retained earnings’. Note that the company will not legally be allowed to pay out dividends if they have negative reserves.
Other reserves can include adjustments such as uplifts on investment properties when they are revalued at market rates, intermittently.
The Non Controlling Interest section represents the value of any shareholdings held in the subsidiaries which are not owned by the parent company. It may be that Tesco Plc owns 60% of the shares of a company it has consolidated into its group accounts, but the other 40% of shares is owned by ‘Joe Blogs’. His shareholding goes under this NCI section.
Comparative periods
All parts of the financial statements of a company or organisation, will have comparative periods or balance sheet dates. These are very useful if you want to see the ‘direction’ the company has gone in, over the last year. For example, a negative movement on the reserves could mean a company has made a loss, in the absence of any dividend payments. A volatile cash balance may not be a good sign – especially if it’s decreasing year on year to an unhealthy level. Similarly, check out the company’s liabilities – which direction are they headed in? Does their growth, seem healthy? Any company will have a healthy level of debt but note should be made of the scale of this and what direction it’s going in!
Summary
This article was intended to give you a basic fundamental understanding of what a balance sheet is, and I hope it has achieved this. Watch out for subsequent articles on a company’s cash flow statement, balance sheet ratios and profit and loss statement. These will follow soon!
In this article i’m going to talk about different types of financial instruments, what they are, how they can be traded. The markets can be a minefield for new traders so it is hoped this article will shed some light on exactly what it is you are looking at, when you log into a broker account.
What are Financial Instruments?
Financial instruments can be any type of financial asset or liability with an underlying contract present giving rise to the asset or liability rights. For example, if you hold shares, you hold financial instruments. If you owe a loan company some money for the new car you just purchased, this is also a financial instrument. It’s a liability for you, but an asset for the vehicle loan company.
So what about the instruments you can see when you log into a broker account? The types you will see, will depend on whether you are logging into an account with margin, or a regular asset purchase account. I have covered what margin is, separately – please see the links below:
OK, so back to the question at hand! If you log into a margin account, you will see many ‘ETFs’ which are available for trading. This stands for Exchange Traded Fund. They are based on many different types of underlying assets. They are basically funds which track some sort of asset.
Financial Instruments – Indices
Indices are indexes of stocks of particular regions or sectors. For example, note the following indices which are available for trading:
NASDAQ ETF (NASDAQ 100) – this is a fund which tracks the value of the 100 top stocks on the NASDAQ stock exchange in America. It is heavily weighted in the technology sector. For example, you will find Apple, Google, Microsoft listed on this exchange/top 100 list. The ETF tracks the average value of all of these top 100 NASDAQ stocks. To buy into this asset effectively means you are hedging your trade or investment between many different successful companies.
S&P 500 – like the NASDAQ tracks the top 100 stocks, this one tracks the top ‘500’ stocks in America. The stocks relate to many different sectors.
FTSE 100 – the top 100 stocks in the UK – you are starting to get the picture, right?
FTSE 350 – the top 350 stocks in the UK.
These indices track the average value of the stocks listed on them.
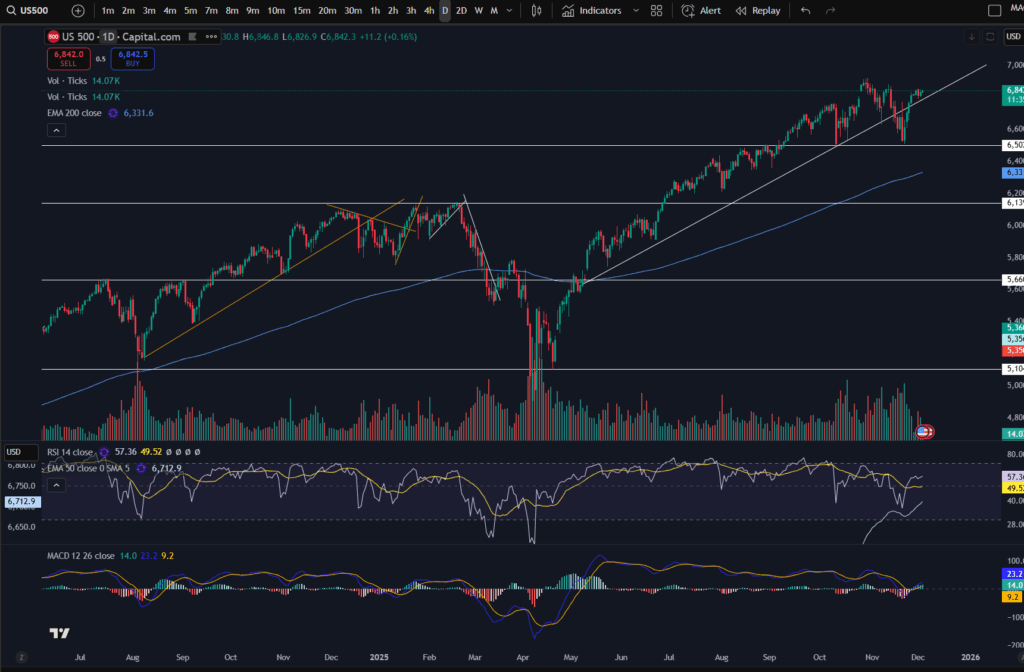
Pictured below is the chart for the S&P 500 via the Trading View application:
ETFs – Commodities
The ETF commodities track the value of an underlying commodity asset. The commodity could be crude or brent oil (priced in USD per barrel), natural gas, wheat, soy… there are many different commodities available for trading. They are typically priced at a recognised unit of measure in the relevant industry – for eg. oil priced per barrel.
ETFs – Metals
Metals can be traded too via ETFs. Some popular metals include:
Gold (XAUUSD)
Silver (XAGUSD)
Copper
Lead
Platinum
Again, the price of these are based on typical units of measure of the underlying assets, usually in USD.
ETFs can be traded via a margin account – either a spreadbetting account, or a ‘CFD’ account (“Contract for Difference”). More on this below.
Ordinary individual stocks
You can purchase shares in a stock and own part of the relevant company. Unlike trading or investing in the ETFs, when you purchase actual stock shares, you own the underlying shares as opposed to just a contract or you making a ‘spread bet’ on the movement (more below on this). These are not purchased through a margin account but instead through a simple investment account.
When you own a stock share, you may receive dividends once or twice per year. If you purchase enough shares in the company, you will literally take control of the company.
The purchase and sale of stocks in the UK are typically subject to capital gains tax. Any dividends received will be taxed as dividend income.
Let’s look at the different types of financial instruments which can be used to open positions on these types of assets
Spread betting account
A spread betting account is used to place bets on the price movements of the underlying asset. You will never own the asset in this scenario. It is literally like making a bet a a book makers. The fee taken from the broker is heavily weighted on the ‘spread’ – the value between the buy and sell prices. The broker takes a cut by adding a bit more to the buy price for you, for example. It works in the opposite way too, when you sell.
Spread betting accounts are typically seen as ‘gambling’ and therefore exempt from personal tax liability, but note there can be some exceptions for professional traders. If you are getting to a point where you are buying and selling and making money without a day job from this method of trading, you are strongly advised to take some tax advice about the implications in the UK.
Please see my article on spread betting here for more information:
Unlike a spread betting account, you will own the underlying asset in a contract for difference account. However, it is not the ‘shares’ or ‘oil’ or ‘gold’ that you will own. You will own a ‘contract’ for the price difference as it plays out in the market. If the price goes up and you purchased the asset, the ‘contract for difference’ will determine that you will be owed some money from the person on the other side of the instrument. The same is true the other way round. If you sell, thinking the price is going to go down, and it does indeed go down, the ‘buyer’ on the other side, will need to pay you, in accordance with the CFD. The broker controls the payments and receipts of all of these exchanges so this is not something for you to worry about – it is just useful for you to understand what it is, you are actually buying or selling.
CFD accounts are typically subject to capital gains tax in the UK, for individuals. (You are strongly encouraged to take your own tax advice on this).
Purchasing shares outright
In this scenario, as I mentioned above, you will own the underlying share, and you will benefit from all voting and dividend rights attached to the share. These are typically subject to capital gains tax in the UK although, as noted above, you should take your own tax advice about the implications of what you are trading, for tax purposes.
I hope you found this article helpful. I also posted a video – maybe you are more of a visual person and it would be helpful to see me talking through these instruments on a screen:
Understand my strategy in full: https://www.patreon.com/Traderpro8320
For more great tips on trading the financial markets, please visit my blog:
In this article i’m going to talk about the key differences between fundamental and technical analysis. Should you use fundamental or technical analysis in your trading? Which one is more profitable? Let’s find out…
Fundamental or technical analysis – what is fundamental analysis?
In a nutshell, traders who perform fundamental analysis look at the ‘fundamentals’ behind a company – they consider the company’s balance sheet and financial statements. The consider directors’ reports and any other information they can get hold of about the company, in order to predict future price movements. This might include using key ratios on the company’s balance sheet, to assess the company’s health or liquidity. The ratios used are not covered in this article. I just want to explain to you what the difference is between these two different approaches to analysing the markets and making trading and investment decisions. Some of the ratios can be used to determine a ‘value’ for a company and therefore, by dividing this value by the number of shares issued, you could derive an estimate of what the company should be priced at in terms of share price, and then see if you can see a discount to this as a purchase opportunity. Such ratios include the company’s P/E ratio. These types of ratios give an idea of how much the company can earn vs the amount of investment you would need to put down to purchase the shares.
It is my intention to post another article explaining some of the key balance sheet ratios and how you can use these to assess the health of a company. Watch out for this.
Fundamental or Technical analysis – what is technical analysis?
Technical analysis does not rely on the financial statements directly and other documents and information. Technical analysis is performed by analysing patterns on the stock charts. The stock charts can give indications of places where there is strong buying or selling pressure by noting patterns of price rejection at these levels. These can be used to predict future price movements. If you would like to understand more about technical analysis, there are plenty of articles on this blog to help you get started. Let’s look at an example of some areas where this price action can be noted:
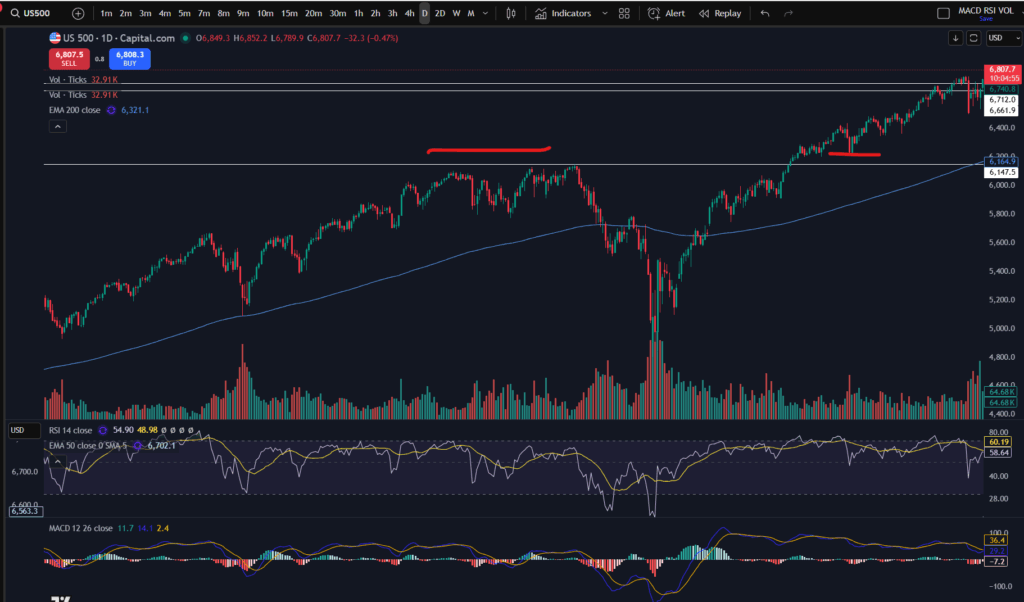
Note on the above chart how the price met some resistance at around 6,164.9 – where I have applied a horizontal support/resistance line in white to the chart. The price bumped on this level a few times and then sailed down very low – what this tells me, as a technical analysis trader, is that the price met a lot of selling pressure at that point. The highs could not be sustained – the buyers became depleted in the market – they did not believe the price was worth more than this level, at that time. This lack of buyers affected the volume of transactions in relation to people ‘buying’ which in turn drove the price down further.
Note that once a price becomes a resistance area, it can, subsequently become a support – note how after the price went past this level some time later, it dipped back down to ‘test’ the level – where I have marked the chart in red, before ascending further up. These patterns are common and can be seen in every stock chart across the markets. So the volume, and demand, which I can see on the chart, tells me a lot about how the share should be priced – it’s almost real time information as opposed to looking at the fundamentals.
So how does one method compare to the other?
Note that I stated technical analysis does not rely ‘directly’ on the fundamental analysis/documentation. However, the price which plays out as patterns on a stock chart, is ‘driven by’ the company’s fundamentals. As a technical analysis trader, I do not perceive these two methods as distinct – I understand that the price patterns I use on the chart, are driven by the fundamentals. I am a qualified chartered accountant by vocation, so although it would be very easy for me to check a company’s fundamentals, I personally, feel that the charts tell me everything I need to know. Therefore, the question of fundamental or technical analysis and which one is better or more profitable, is a bit of a misnomer.
I do keep aware of general major news in the markets and how this may affect what I would like to trade – for example, Trump’s tweets on tariffs and how these have been affecting Apple. However, in the most part, I rely on the technical analysis to give me an idea of when to invest or trade, where to invest or trade and most importantly, when not to!!
One of these methods is not necessarily going to make you more money than the other – it is best for you to become a ‘master’ of what you are doing, and develop skill in either one – this will help you best to make more profit.
I hope you found this helpful in terms of understanding fundamental or technical analysis.
I also published a video on YouTube which you may find helpful:
https://youtu.be/5nnCg5CfOMw
Understand my strategy in full: https://www.patreon.com/Traderpro8320
For more great tips on trading the financial markets, please visit my blog:
In this article i’m going to talk about how you can trail a stop loss to make even more profit when trading the stock market. I’m going to take you through the different types of manual trailing stops you can use, and the types of scenarios they might be useful in. Let’s get straight into it!
How to trail a stop loss – what do we mean by trailing a stop?
When you ‘trail a stop loss’, it means you follow the price at a safe distance, with a stop loss – you move your stop slowly to mimic the price increases on the chart so that if the price descends, you will not lose the profit on the table you have already earned. However, it allows scope for the price to increase further and in this way, you can make profit out of long trends! What’s not to love?
To understand stop losses and risk management, please see our other article, here:
Please also see our YouTube video, here, on managing risk:
How to trail a stop loss – the manual way
There are some automatic ways to trail a stop but please note, they are not covered by this article. I’m going to share with you, how I trail a stop manually here. There are different scenarios which would help me to decide how ‘closely’ to trail a stop. This would depend on how much leverage i’m using, whether I have profit on the table, how far I think the price will go and how much room I believe it needs to breath and fluctuate if I’m trying to catch a long trend.
The way I trail a stop is to look for a support – the support could be either a candle (to trail a stop closely), a low on a trend (perhaps to try and trail a trend for a long time), a support line (either diagonal or horizontal) – you could also use this latter type for long trends and breakouts. I would keep my stop at the most recent support and move it manually once the price moves up into a new zone/level.
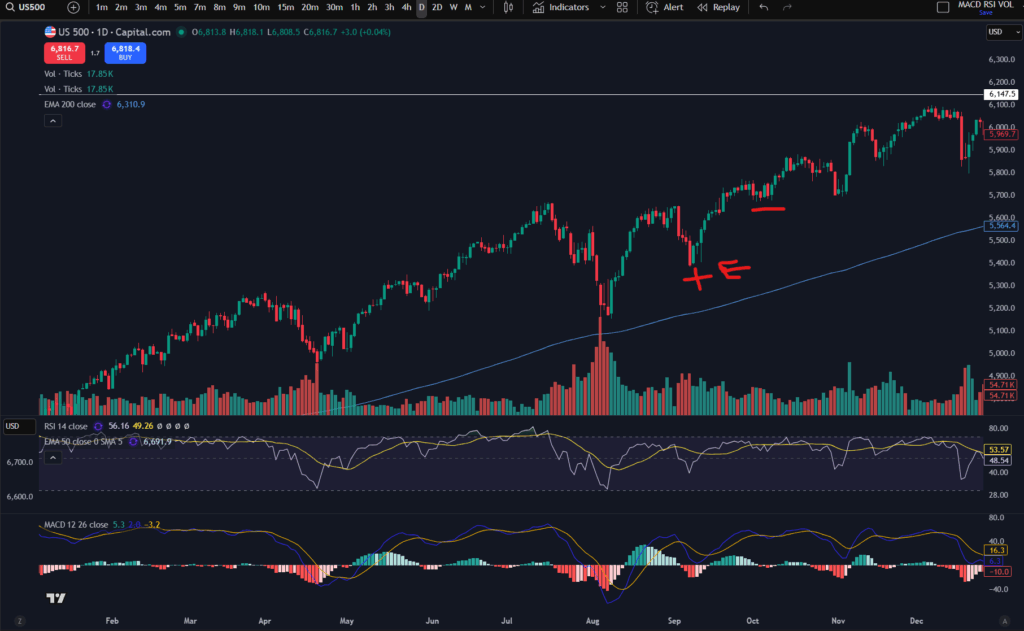
For scenarios where i’ve made a little trade, the price has gone near my target, and I believe there is a chance it could grow a little more, but I don’t want to risk the profit i’ve made already, I would trail a stop very closely, using the candles. This is the type of scenario where I would not be looking to catch a long trend with the trailing stop. Let’s look at an example…
Trailing a stop closely using candles
To get a discount to the Trading View software that I use, please click the link below:
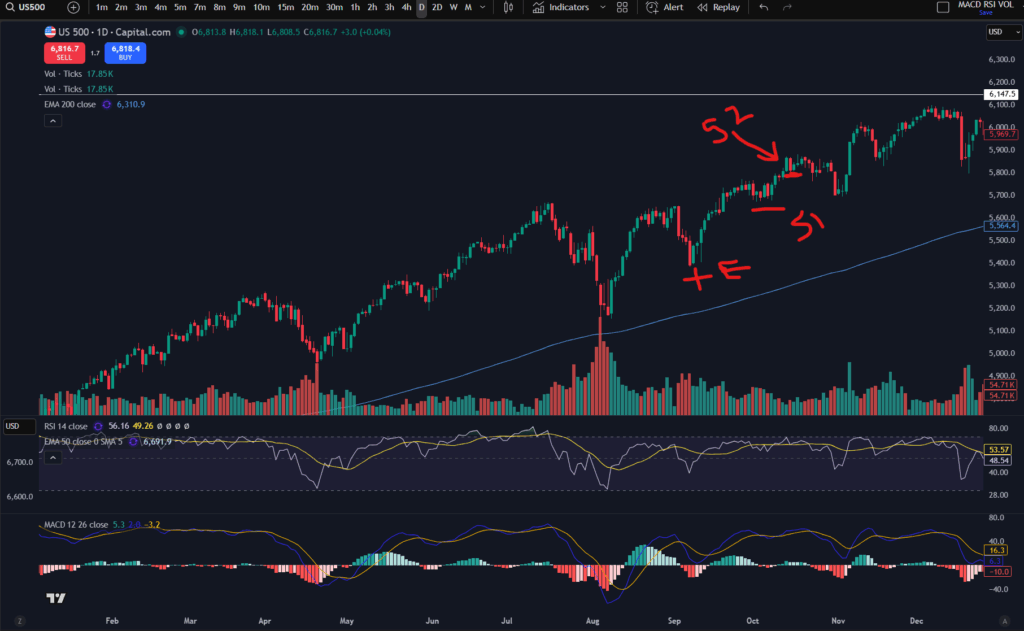
Let’s say you entered the market in the above trend where i’ve marked a + sign and ‘E’. Your initial intention was to take profit near the previous high so you’ve got some profit on the table, but the market is showing no sign of resistance and you are tempted to see if it will keep going…. you can trail a stop underneath one of the red/lowest candles where it has breathed/pulled back slightly. If you placed a stop where i’ve marked the next red line/marker on the chart, the price did indeed carry on going up further until it pulled back again… at this point you could have taken profit off the table. Alternatively, after the initial stop position, if I were in such a trade, I might be tempted to move it up again, just under the next red candle – marked below:
You can see in the chart above, where I have marked ‘S2’ that this was anther red/low candle and it tried to push up further after this, but it then pulled back down. You would have got stopped out at this level which is a nice bit of profit over and above your original target!
Trailing a stop on long trends
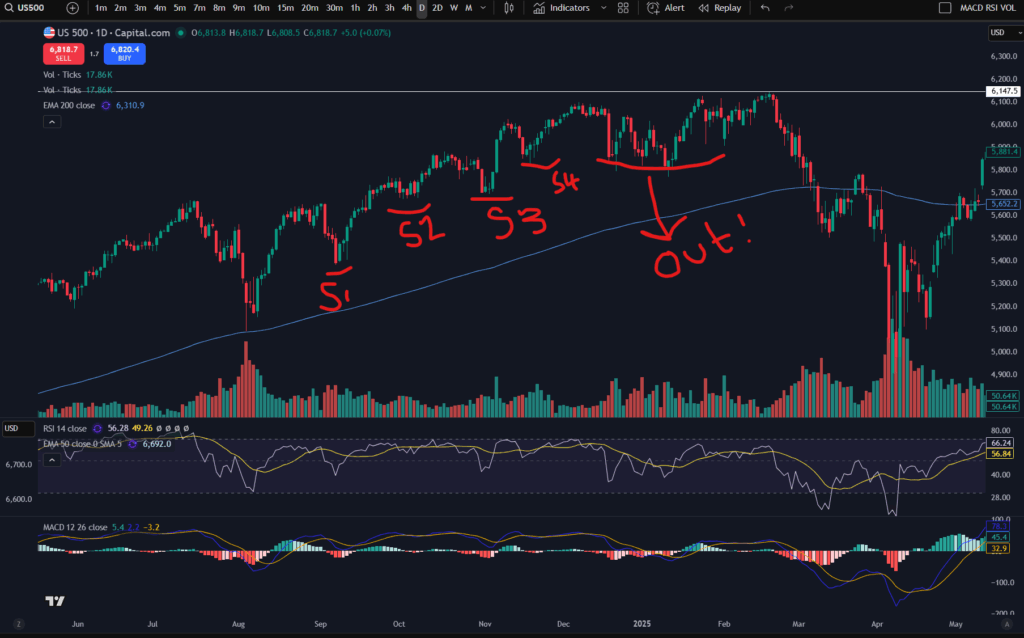
For trailing a long trend, I would instead use the highs and lows of the trend, or diagonal/horizonal support and resistance lines. Let’s take a look at how this could work:
OK, so as you can see in the above chart, i’ve marked out where your stop loss would be moved to manually – every time the trend makes a higher low the stop is moved. I use the MACD indicator to tell me where the highs and lows are in a trend. If you would like to understand this more, please see the following article:
Back to the chart! So you can see that you would have been able to ride this trend up to just before it crashed down and you would have scooped a large amount of profit from the market. You can see that the stop position ‘4’ would have stopped you out in this trade because shortly afterwards the price fell back down to this level.
Trailing a stop in horizontal steps of resistance and support
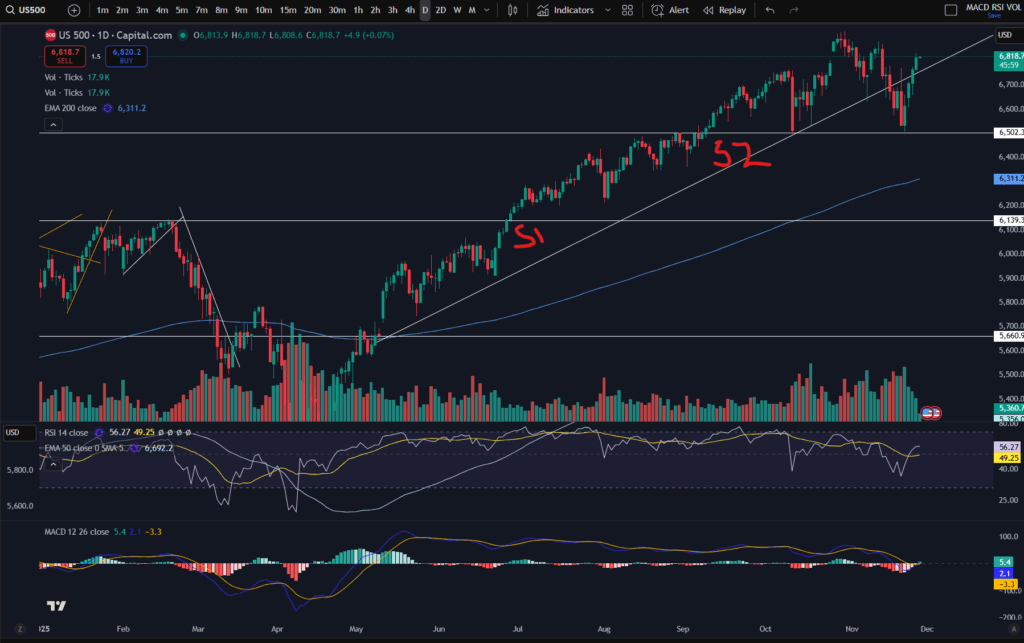
In the same way as you can trail a stop in a diagonal movement, you can also trail it in a horizontal step up movement. If you have got support and resistance lines drawn on your chart, you can move the stop up just under the last support level, every time the price pops up into a new zone. For information on understanding how to draw support and resistance levels, please see this article:
Let’s take a look at what this looks like on the chart:
As you can see, there are major support and resistance levels marked on this chart in white. I’ve added S1 and S2 as suggested places to which the stop loss could be moved, as the price pushes up through these stepped levels.
I hope this helped you understand how you can trail a stop loss and take even more profit from the market. I’ve also shared below my video on this in case you find it easier to digest:
Understand my strategy in full: https://www.patreon.com/Traderpro8320
For more great tips on trading the financial markets, please visit my blog:
In this article i’m going to talk about something which is paramount to your trading – multiple timeframe analysis. This will blow your mind and change the way you trade forever! Multiple timeframe analysis is essential for new traders to learn – it will change the way you trade and see the markets, forever! Let’s get straight into it…
What is multiple timeframe analysis?
Multiple timeframe analysis is what it says on the tin – undertaking analysis on multiple timeframes to get a clearer idea of what’s happening in the markets. So how does this work, and how can it help you in your trading? The basic premise is that you use ‘larger/higher’ timeframes to get a bird’s eye view of the market – where the price is going long term, what the long term trend is, if there is one. Is it in a range long term? Then you can use the smaller timeframes to ‘zoom in’ and plan and execute your trades with greater precision. Let’s take a look at how this might work. It is common for people to use the ‘daily’ timeframe as their higher timeframe. I personally use this timeframe as a higher timeframe, but note that I also refer to the ‘monthly’ timeframe as another level up, to get an even higher ‘birds eye view’ as compared to the daily.
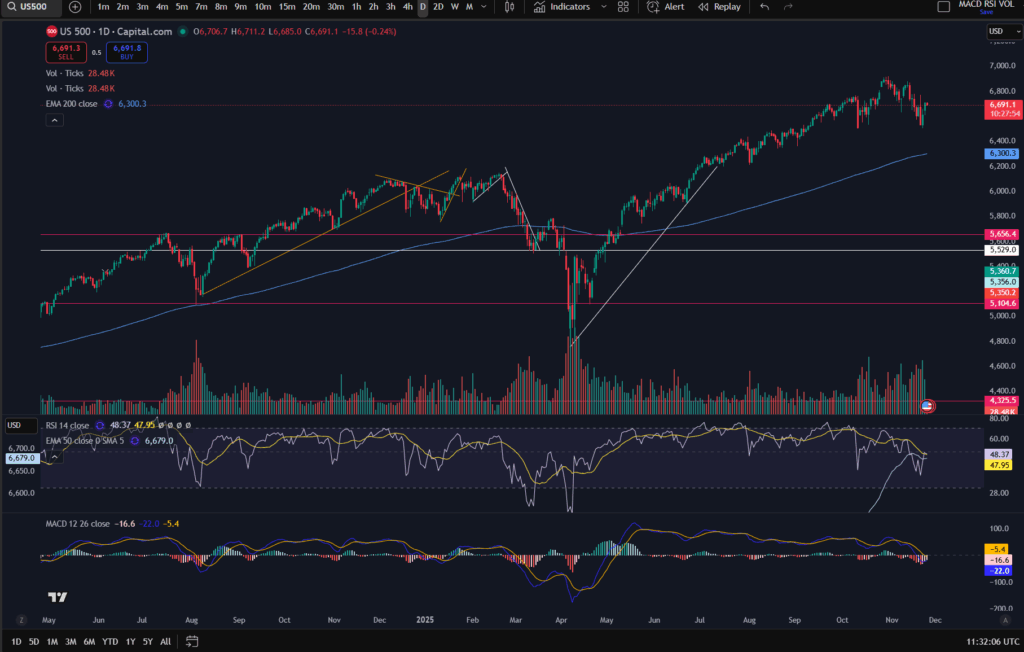
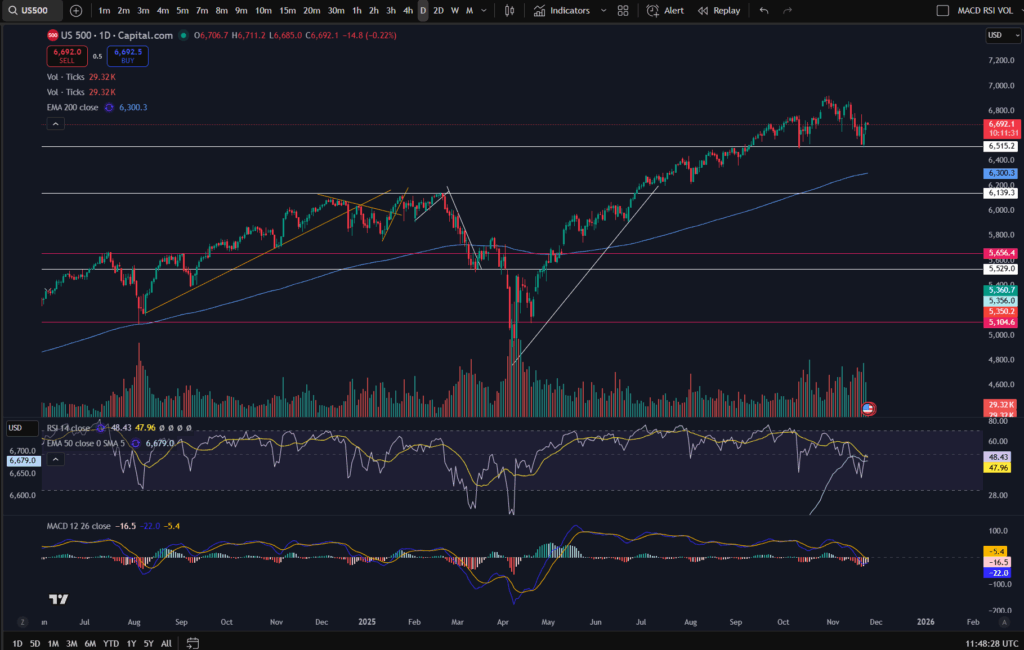
Let’s look at the daily timeframe on the S&P 500 most recently:
You can use the daily/higher timeframe, to mark major support and resistance levels, as below:
You can see that the price has found a support a few times at the white marked horizontal line on the chart (6,515). (If you think you would benefit from using this chart software, I can offer you a discount, through Trading View – please click the link below):
OK, so back to the chart analysis! Why is marking the higher timeframe in this way, important when using multiple timeframe analysis? The higher the timeframe, the more people, hedge funds, big money etc, are noticing the resistance or support level – which gives it more weight! More people are going to be respecting those levels and being mindful of them. More people will get into the market at the higher timeframe support area – meaning there will be a stronger push up from that level as a result of sheer volume and demand.
So you can use the higher timeframe to plan the general ‘area of interest’ in your trade set up. For information on how to plan trades and where to get started, please see our blog article:
Once you have got your general ‘area of interest’ per your bird’s eye view, you can then ‘zoom in’ by using a smaller timeframe. The smaller timeframe should be about 4 timeframes away from your bird’s eye view timeframe. For example, I use the daily timeframe as my bird’s eye view, and the 30 minute timeframe to execute trades, currently. I have combined the daily with the 10 minute and this did work for me, as well.
Smaller timeframe analysis – Zooming in!
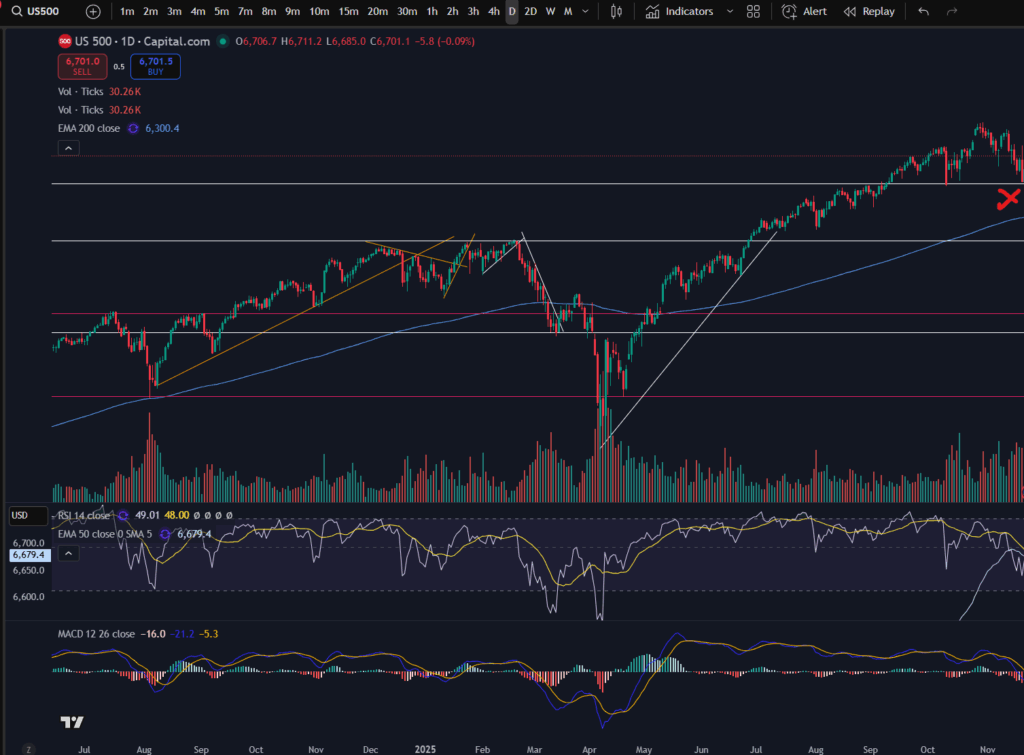
OK, so now that you have your general area of interest per the larger timeframe, you can use the smaller timeframe, under multiple timeframe analysis, to plan how to ‘execute your trade. We established that on the daily timeframe for the S&P 500, there was a general resistance level at around 6,515 price. Let’s say we were just at the red X marked below and we had not gone past this point – we knew that the price typically bounces at this level and we expect it to, because in the past, this area was a resistance, too – see how the price was bumping against it, in mid August on the chart below.
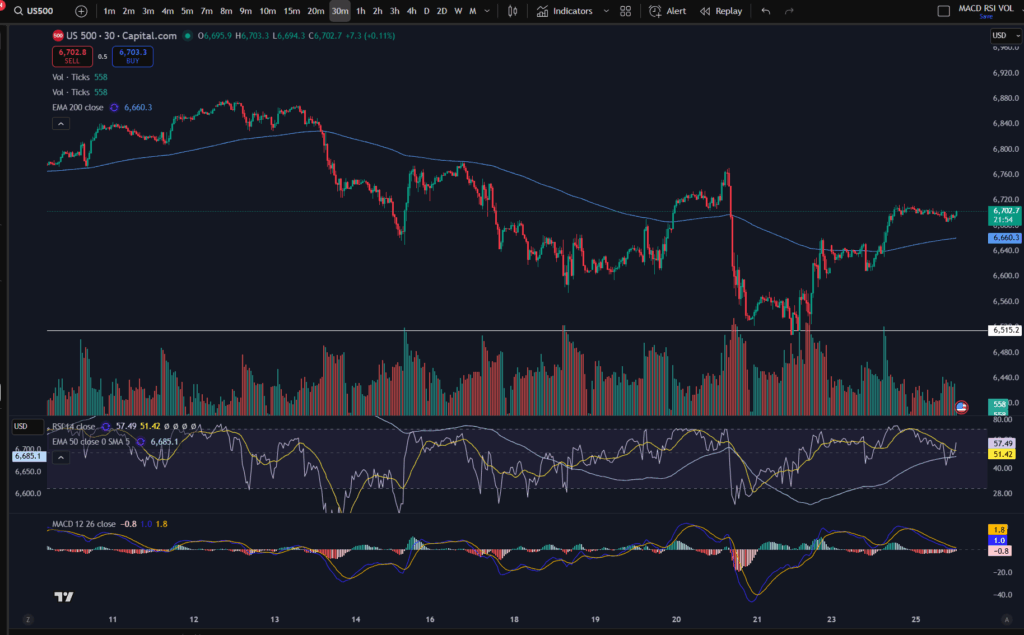
Bearing in mind this is our point of interest, we might want to get into a trade here, at the support. Now let’s take a look at the 30 minute timeframe to plan this possible trade. We are interested in the price at mid November on the 30 minute timeframe. (Usually you will not have to cut off the chart in this way, obviously – i’m just showing you, retrospectively, how you may have planned and executed a trade at this level):
OK, so here we have the zoomed in view of the ‘bounce’ on the daily timeframe. Under my strategy, I would want the price to have popped up over the EMA line before I consider entering a trade. You can see my strategy here:
The point of the lower timeframe is that you can see ‘under a microscope’, what’s happening in the market. You can execute your trade at just the right place on the chart, with extra precision.
IMPORTANT NOTE RE ANALYSIS ON THE HIGHER/LOWER TIMEFRAME:
You can check that the market is ‘uptrending’ on the lower timeframe before entering (i.e. making higher highs and higher lows). If it’s not doing this on the lower timeframe, you can be sure, that it won’t do it on the higher timeframe either – note how the ‘patterns’ that form on the lower timeframe, “MAY” trickle through to the higher timeframe, but it’s not certain they will. However, it is a REQUIREMENT for the pattern to appear on the lower timeframe, before it appears on the higher timeframe. You may wish to read this note carefully again, until it sinks in!
Once the price has started uptrending on the lower timeframe and it meets your criteria for trade execution, you can enter the market. You would be unable to see this detail from your bird’s eye view, timeframe.
You plan and execute your trade including the ‘take profit’ and ‘stop loss’ levels per the smaller timeframe, when using multiple timeframe analysis. Do not set a take profit on the daily timeframe. You have to understand that if you put your take profit at the top of a peak on the daily timeframe, it may take weeks to get there, depending on how many days need to go by, to get up there. This is why we plan and execute per the smaller timeframe – each candle is only 30 minutes, or 10 minutes, or whatever you choose to use. So it could take 12 x 10 minutes = 120 minutes to get to your target on the smaller timeframe of 10 minutes. If you waited for 12 candles on the daily timeframe you would be waiting for 12 days!
I hope you found this helpful. I also created a video on my Youtube Channel which you may like to see on multiple timeframe analysis:
Understand my strategy in full: https://www.patreon.com/Traderpro8320
For more great tips on trading the financial markets, please visit my blog:
Finally, thank you to my existing members on Patreon, and for your likes, comments and subscribes. Happy trading!
Please note any subscriptions taken via my affiliate link with Trading View may result in me earning a small commission.
Nothing in this video should be taken to constitute financial advice. Although we make observations on the current state of the markets, nothing we suggest should be taken as an indication of what they will do next. You are required to carry out your own due diligence before entering any of the markets.
In this article i’m going to talk about what’s happening now on the NASDAQ and give you some technical analysis on the recent price movements. Let’s just get straight into it:
What’s happening now on the NASDAQ? The Monthly Time Frame
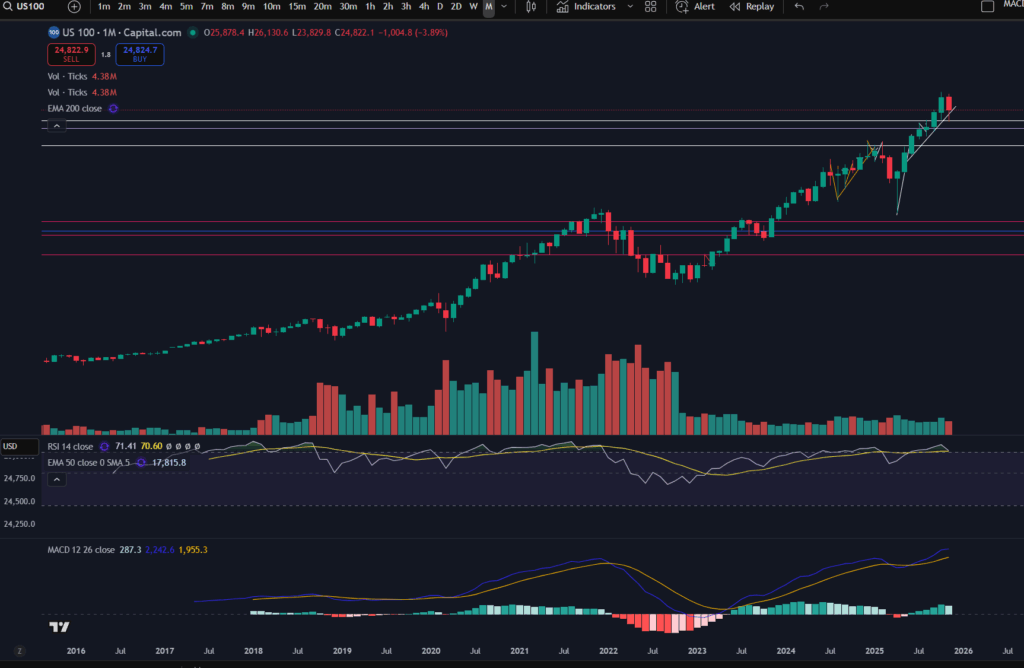
Let’s take a look at the monthly timeframe to remind ourselves of the highs the NASDAQ had reached recently:
As you can see, before this month, marked with the big red, most recent candle on the monthly timeframe, the market had pushed up considerably. The RSI was very overextended and the volume was not significant compared to the periods where significant momentum was noted (see the period between July 2018 and July 2022, for example. The market did look like it was in need of a pull back, at the very least.
Now let’s take a look at the daily timeframe.
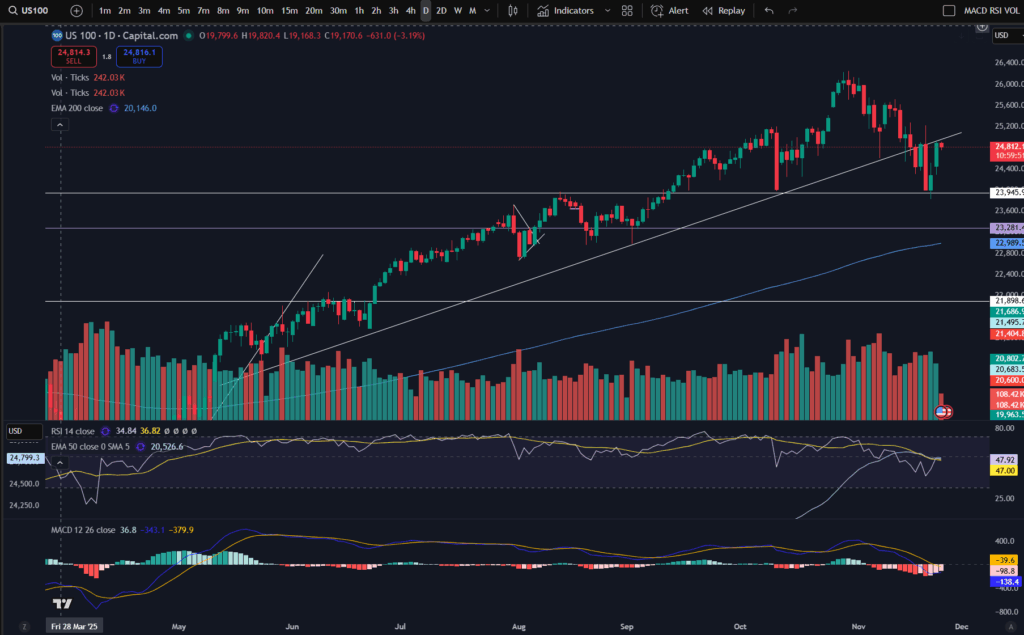
What’s happening now on the NASDAQ? – The Daily Timeframe
As you can see, the market was trending for a lengthy period of time, above the diagonal trend line marked on the chart. (If you would like a discount to the software I use – Trading View, please click the link below). In November the price broke this support and sailed down. It kept going until it reached the next lower level support area marked horizontally on the chart at price 23,945.
Currently the market is at a critical point – it has bounced slightly on the support level, but will it continue to sail away from this area? It’s currently touching the ‘underside’ of the diagonal support, which, as we know, can now be seen as a potential resistance.
Let’s take a look at the ‘zoomed in’ view, on the 30 minute timeframe. By the way, if you would like to understand more about ‘multiple timeframe analysis’, please see the video below:
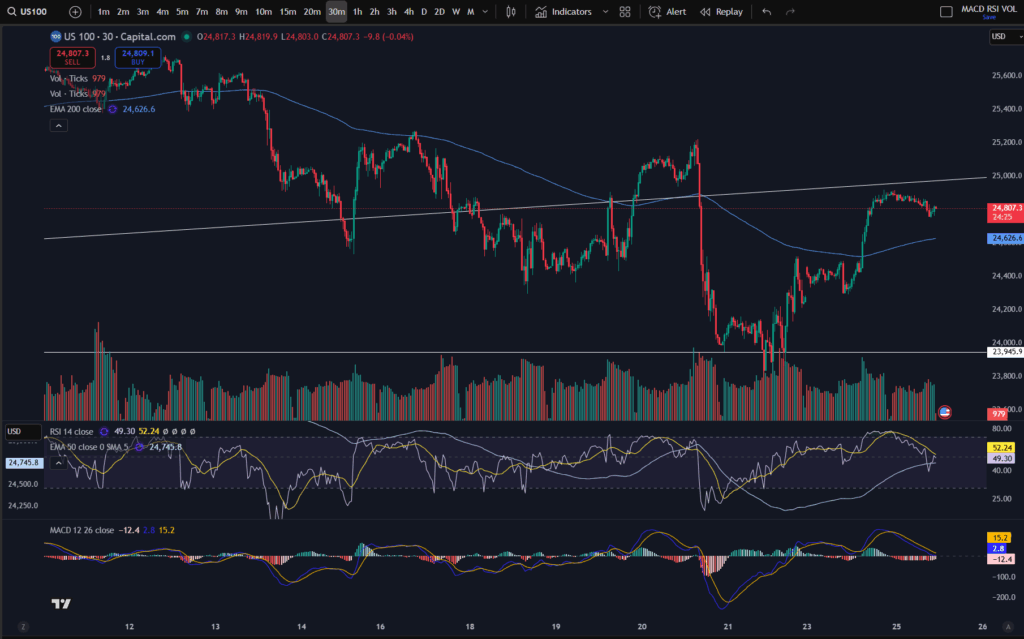
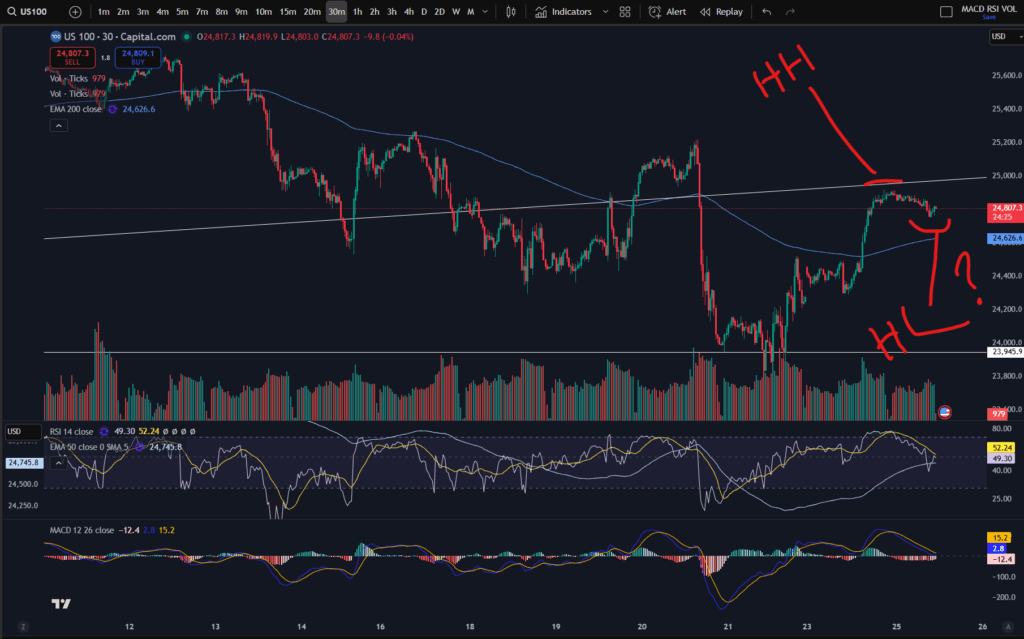
The 30 minute timeframe:
You can see more clearly on the 30 minute timeframe, that the price is currently exactly at the diagonal resistance level. It has just made a ‘higher high’ and it’s currently trying to form a ‘higher low’:
Why does this matter? The market will be considered to be trending ‘up’ once it is making higher highs and higher lows, consistently. It remains to be seen whether this will continue at the moment. As I mentioned in previous videos and posts, it could do the same thing it did previously, and pop back down, below the EMA line – you can see it did this on around the 20th – 21st November and before this, around the 13th to 14th of November.
If you would like to understand more about support and resistance levels, and how to read the markets by identifying highs and lows in a trend, please see my video here and related article:
Highs and lows video:
Blog article to help you spot whether a trend is changing direction:
So ultimately, what’s happening now on the NASDAQ is that the market is trying to recover but patience is required to understand whether it will continue trying to push up. Patience is key for traders who do not short the markets.
Understand my strategy in full: https://www.patreon.com/Traderpro8320
For more great tips on trading the financial markets, please visit my blog:
Finally, thank you to my existing members on Patreon, and for your likes, comments and subscribes. Happy trading!
Please note any subscriptions taken via my affiliate link with Trading View may result in me earning a small commission.
Nothing in this video should be taken to constitute financial advice. Although we make observations on the current state of the markets, nothing we suggest should be taken as an indication of what they will do next. You are required to carry out your own due diligence before entering any of the markets.
Cookie Consent
We use cookies to improve your experience on our site. By using our site, you consent to cookies.
Used by Google Analytics to determine which links on a page are being clicked
30 seconds
_ga_
ID used to identify users
2 years
_gid
ID used to identify users for 24 hours after last activity
24 hours
_gat
Used to monitor number of Google Analytics server requests when using Google Tag Manager
1 minute
__utmt
Used to monitor number of Google Analytics server requests
10 minutes
__utmb
Used to distinguish new sessions and visits. This cookie is set when the GA.js javascript library is loaded and there is no existing __utmb cookie. The cookie is updated every time data is sent to the Google Analytics server.
30 minutes after last activity
__utmc
Used only with old Urchin versions of Google Analytics and not with GA.js. Was used to distinguish between new sessions and visits at the end of a session.
End of session (browser)
__utmz
Contains information about the traffic source or campaign that directed user to the website. The cookie is set when the GA.js javascript is loaded and updated when data is sent to the Google Anaytics server
6 months after last activity
__utmv
Contains custom information set by the web developer via the _setCustomVar method in Google Analytics. This cookie is updated every time new data is sent to the Google Analytics server.
2 years after last activity
__utmx
Used to determine whether a user is included in an A / B or Multivariate test.
18 months
_gac_
Contains information related to marketing campaigns of the user. These are shared with Google AdWords / Google Ads when the Google Ads and Google Analytics accounts are linked together.
90 days
__utma
ID used to identify users and sessions
2 years after last activity
Marketing cookies are used to follow visitors to websites. The intention is to show ads that are relevant and engaging to the individual user.
A video-sharing platform for users to upload, view, and share videos across various genres and topics.
This cookie is used to play YouTube videos embedded on the website.
2 years
VISITOR_PRIVACY_METADATA
Youtube visitor privacy metadata cookie
180 days
GPS
Registers a unique ID on mobile devices to enable tracking based on geographical GPS location.
1 day
VISITOR_INFO1_LIVE
Tries to estimate the users' bandwidth on pages with integrated YouTube videos. Also used for marketing
179 days
PREF
This cookie stores your preferences and other information, in particular preferred language, how many search results you wish to be shown on your page, and whether or not you wish to have Google’s SafeSearch filter turned on.
10 years from set/ update
YSC
Registers a unique ID to keep statistics of what videos from YouTube the user has seen.
Session
DEVICE_INFO
Used to detect if the visitor has accepted the marketing category in the cookie banner. This cookie is necessary for GDPR-compliance of the website.