Stock market today – Everything you Need to Know

Stock market today – Everything you Need to Know

In this article i’m going to talk about the latest technical elements of the NASDAQ and the S&P 500. I want to perform technical analysis on the stock market today, with a view to determining whether I think it’s showing signs of recovery. Let’s take a look!

Stock market today – the NASDAQ long term picture

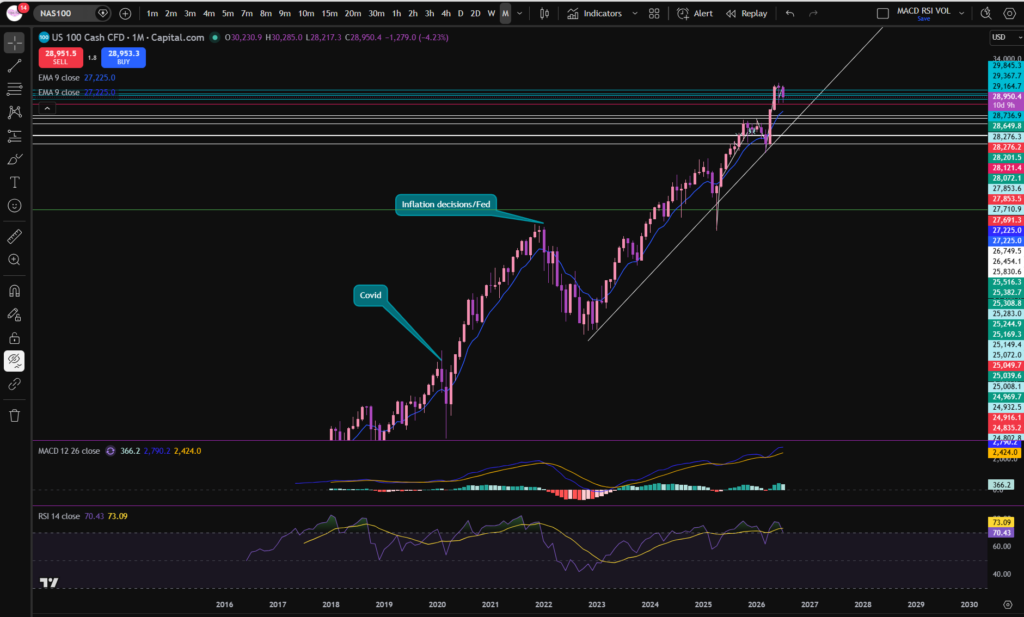
The first thing I like to do when considering the stock market today, is check the monthly timeframe chart of the NASDAQ index. Each candle on this chart shows us one month’s movement, spanning a long period of time:
stock market today

As you can see from the monthly timeframe chart, the price recently pushed away from a long term diagonal trend line. This is a great way to get a birds eye view/idea of what’s happening with the stock market today. However, you can see the market currently on a pull back and has been for the last couple of months. I’ve been waiting to see if the price will continue to pull down or start to recover by pushing up further away from the trend line. Now that we can see the bigger picture, let’s take a look from a slightly more zoomed in perspective – the daily timeframe:

Stock market today – NASDAQ daily timeframe
stock market today

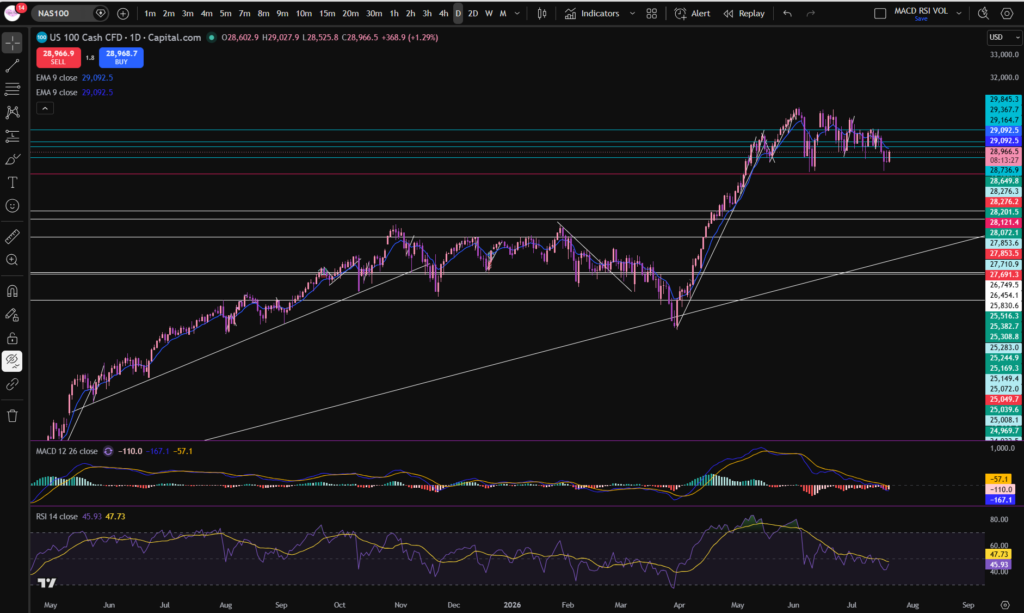
Now you can see the monthly timeframe pattern on a more zoomed in basis. As you can see, the price has been pulling back towards the trendline. It’s reached another major support level (horizontally) marked in red on the chart. It’s forming a light pink candle there – currently meaning the price is higher than where it opened – although note today is not over yet!

The MACD signal and MACD lines have moved under the histogram and they are in the ‘undervalued zone’ currently. The RSI is also very low currently. This is not a guarantee that the price will recover, but it can precede many recoveries.

Notwithstanding the position of the RSI and MACD indicators, the price has not started making higher highs and higher lows on this timeframe, yet.

Note that higher highs and higher lows on the daily timeframe must be preceded by the same pattern on lower timeframes first! So let’s take a peek at the 30 minute timeframe, to get an idea of what’s happening much closer in!

30 minute timeframe – the NASDAQ

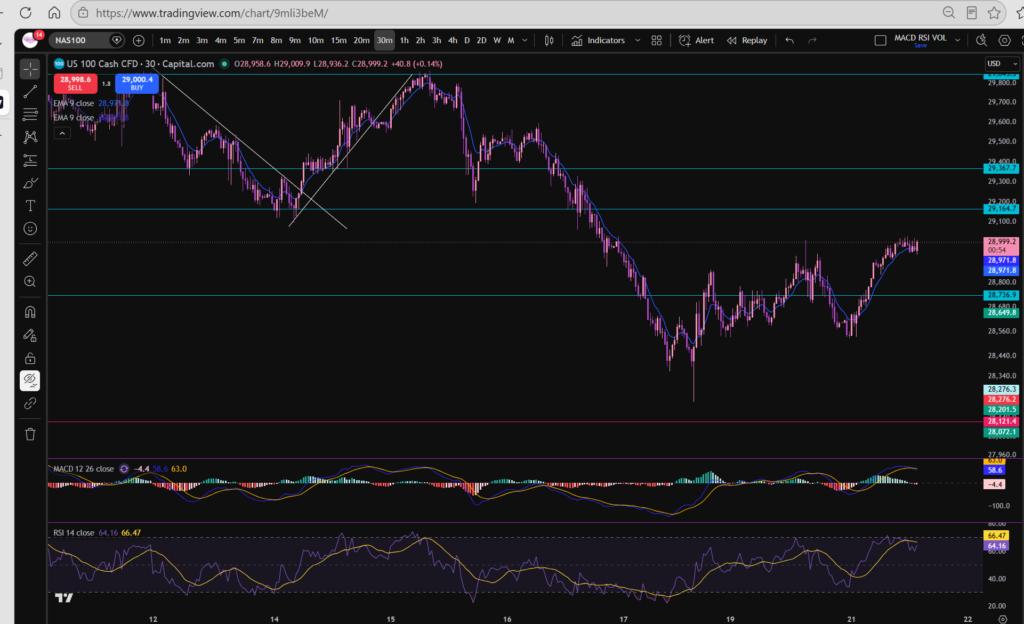
Now you can see the bounce from the horizontal red support line more closely:
stock market today

The candle stick pattern noted here is a hammer – with a very long tail. This means the sellers were in control pushing the price down to the support level but the buyers stepped in and pushed the price back up, confirming that the support line is still very much valid.

In terms of what sort of trend the market is in on the 30 minute timeframe, I tend to follow the ebbs and flows of the MACD indicator to tell me where the highs and lows are. This is not how all trades analyse the markets, but this works for me – so i’m happy to share, but obviously you have no obligation to adopt my approach! Let’s break this down carefully, because it looks very choppy!
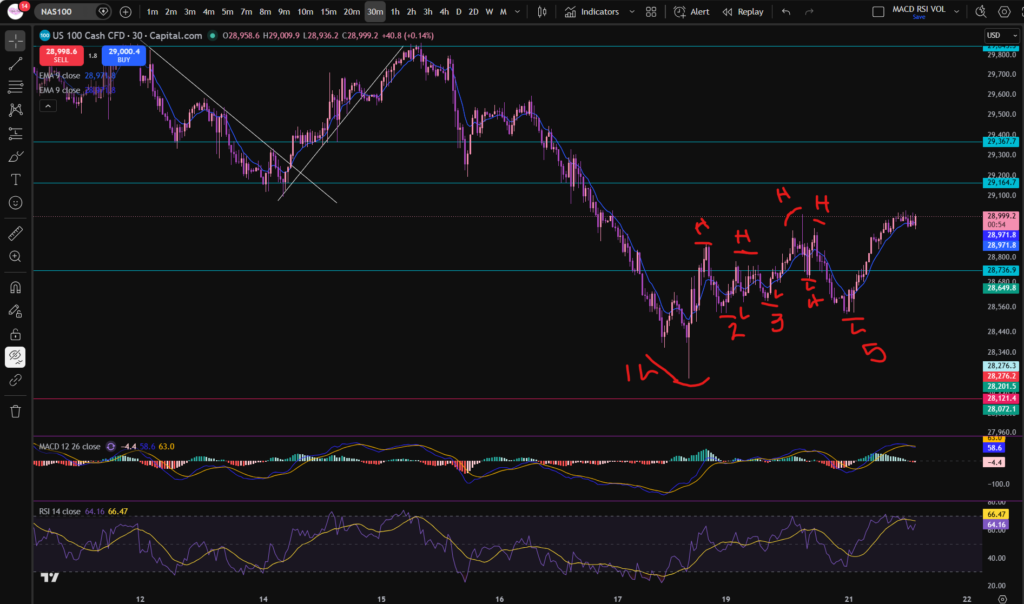
Let’s talk through what’s happening here. The market made it’s very low, low, at the horizontal support. It then made low 2 in a higher position. Low 3 was higher and low 4 was higher. However, take a look at what’s happened to low 5… it’s now lower than the previous one. This to me indicates that the market is not yet sure of where it wants to go.

Similarly look at the highs. The highs were progressing but the one being made currently is still at the same level of the previous ones. Is it now going sideways at this level? This remains to be seen. Sideways often precedes a change in direction! It’s not a guarantee that the market will go back down.

My conclusion at the moment is that the market is not clear. I’m not seeing consistent higher highs and higher lows in the movements noted above. So what now? My position is that I will wait…

Since the NASDAQ has a massive impact on the other stocks on the market including the other ones listed on the S&P 500, I have not considered that here. It is very much likely to be forming the same sort of patterns noted here but less stark/softened by the other stocks included there.

You may also find my blog articles on stock market news helpful, which i’m linking below:

Fundamental Analysis – Sophia Trades – Learn how to Trade the Stock Market

I hope you found this article on the ‘stock market today’ helpful!

Let’s generate wealth independently, together!

Socials:

You Tube:

https://www.youtube.com/channel/UC__AuhOClF8FRudbmT05OKQ

Patreon:

https://www.patreon.com/sophiatrades

To watch me trade live and understand exactly how I make money using my own unique strategy in full, please visit my Patreon page here:

https://www.patreon.com/sophiatrades

Disclaimer!

Nothing on this blog should be taken as financial advice or encouragement for you to enter a trade.  You are expected to speak to a financial adviser or carry out your own due diligence before entering any positions.  Everything on this blog is made for educational purposes and to equip you with the knowledge you need to be able to make your own financial decisions.  I am not regulated by the Financial Conduct Authority.

For more great tips and advice on trading the stock market, please visit:

https://www.sophiatrades.co.uk

Finally, if you would like to receive a discount on the Trading View charting software I use, please click on the relevant link here:

https://www.tradingview.com/?aff_id=117138

Please note any subscriptions taken via my affiliate link with Trading View may result in me earning a small commission.  However, I provide complete transparency on me using Trading View personally – I publish my success on the financial markets via my broker reports and any profits earned were done so by using my own Trading View subscription,  so I genuinely do recommend them and have been using the Trading View charts for many years.

What is the stock market?  Everything you Need to Know

What is the stock market? Everything you Need to Know

Welcome to Sophia Trades! If you’ve ever pondered over the question, what is the stock market, and why does it often feel like the heartbeat of the economy, you’re in the right place. In this article, i’m going to answer the question, what is the stock market and the world of trading – eliminating jargon and giving you the simple method of explaining this so it’s digestible for everyone.

So, what is the stock market? Simply put, it’s a marketplace where people buy and sell shares of ownership in companies. Think of it as a giant market place, but instead of physical items being sold, the goods are pieces of businesses. When you buy a stock, you become a tiny owner of that company, sharing in its successes (and sometimes its challenges). I also prepared a separate article explaining what it means to own a stock or part of one, in a greater depth, which you will find here:

What are stocks? Everything You Need to Know – Sophia Trades – Learn how to Trade the Stock Market

The above article will certainly be another component in helping you to understand the answer to the question, what is the stock market.

When considering the question, what is the stock market, we must understand that the stock market plays a crucial role in our economy. It helps companies raise money to grow by making investments themselves, in new equipment, efficiencies in the businesses etc, and innovation by offering shares (part of the businesses) to investors. For individuals, it’s an opportunity to invest and potentially grow wealth over time. However, the stock market is not just about numbers and trading floors and charts – it’s a complex place which is influenced by major news and investor emotions – how they feel about real world eventualities happening.

Every day, millions of transactions happen on stock exchanges like the New York Stock Exchange (NYSE) or Nasdaq. People and companies are buying and selling stocks. Prices fluctuate as supply and demand change—if more people want to buy a stock, the price goes up; if more want to sell, it goes down. This constant movement makes the stock market exciting and sometimes unpredictable. Many traders make money from the volatility in the stock market. You can learn how to make money from the swings up and down on this blog, by looking at some of the articles, or by joining me on my Patreon account, linked below.

Here are some useful links in the blog for you:

Structured course – how to trade:

Understanding the stock market can empower you to make informed decisions—whether you’re planning to invest, curious about the economy, or just want to impress at your next dinner party. It’s a space where business, psychology, and global trends intersect, making it endlessly intriguing.

I hope you found this article helpful!

Let’s generate wealth independently, together!

Socials:

You Tube:

https://www.youtube.com/channel/UC__AuhOClF8FRudbmT05OKQ

Patreon:

https://www.patreon.com/sophiatrades

To watch me trade live and understand exactly how I make money using my own unique strategy in full, please visit my Patreon page here:

https://www.patreon.com/sophiatrades

Disclaimer!

Nothing on this blog should be taken as financial advice or encouragement for you to enter a trade.  You are expected to speak to a financial adviser or carry out your own due diligence before entering any positions.  Everything on this blog is made for educational purposes and to equip you with the knowledge you need to be able to make your own financial decisions.  I am not regulated by the Financial Conduct Authority.

For more great tips and advice on trading the stock market, please visit:

https://www.sophiatrades.co.uk

Finally, if you would like to receive a discount on the Trading View charting software I use, please click on the relevant link here:

https://www.tradingview.com/?aff_id=117138

Please note any subscriptions taken via my affiliate link with Trading View may result in me earning a small commission.  However, I provide complete transparency on me using Trading View personally – I publish my success on the financial markets via my broker reports and any profits earned were done so by using my own Trading View subscription,  so I genuinely do recommend them and have been using the Trading View charts for many years.

Stock Market Today – Everything You Need to Know

Stock Market Today – Everything You Need to Know

Let’s take a look at the stock market today to see what’s happening. Are the markets recovering? Is AI tech still considered slightly overvalued? Let’s try to answer some of these questions by looking at some charts!

Stock market today – the NASDAQ / AI Tech

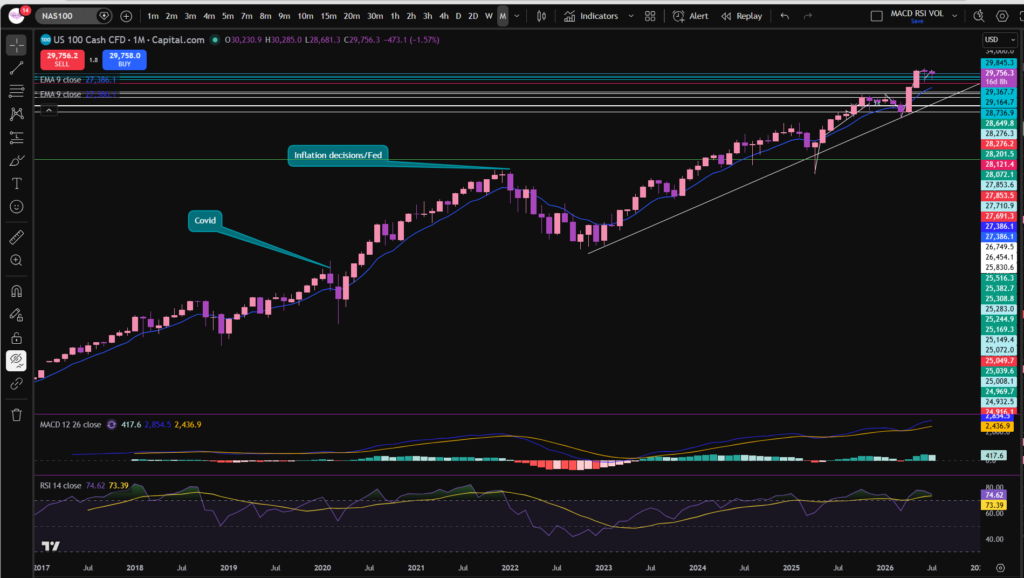
Let’s just jump straight into considering the NASDAQ index chart – this will give us some key information about what’s happening with stocks today. I’m considering the monthly timeframe first:

stock market today

To get a discount to the chart software I use, follow the link below – i’m with Trading View:

As you can see, on the monthly timeframe, the NASDAQ has been dancing around the new highs it reached recently after a strong push up from the long diagonal trend line which has been present on the chart since mid 2023. It looks like it’s taken a bit of a breather in the last few weeks. However, note when you zoom in, that the two purple candles which have formed in the last two months, have got long tails. These types of candles can happen where, initially, sellers push the price down, but then confidence resumes in the market, and the buyers step in and push it up again to the previous level. These candles are called hammer candlestick patterns. You can learn about them here:

Japanese Candlesticks – Sophia Trades – Learn how to Trade the Stock Market

OK, so we can see what’s happening on the monthly timeframe chart… let’s take a look at the daily timeframe:

stock market today

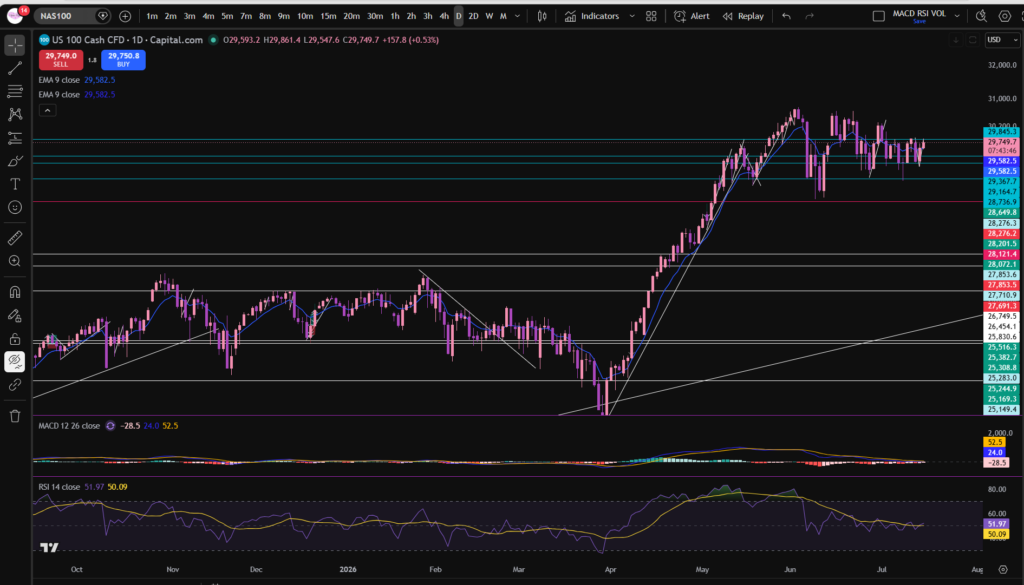
As you can see, the monthly timeframe on the NASDAQ has been extremely choppy, indeed, in terms of the stock market today. It’s been bouncing around the same level since around the beginning of June…. However, note that the MACD and signal lines had moved below the zero level of the histogram and the MACD and signal lines could be due for a cross over to the upside. This is not a guarantee that the price will start recovering, however. The price most recently pushed again away from the horizontal support level you can see above at around 29,542. So prices are holding firm and pushing up slightly from the key support area – meaning they look like they are holding firm, for now.

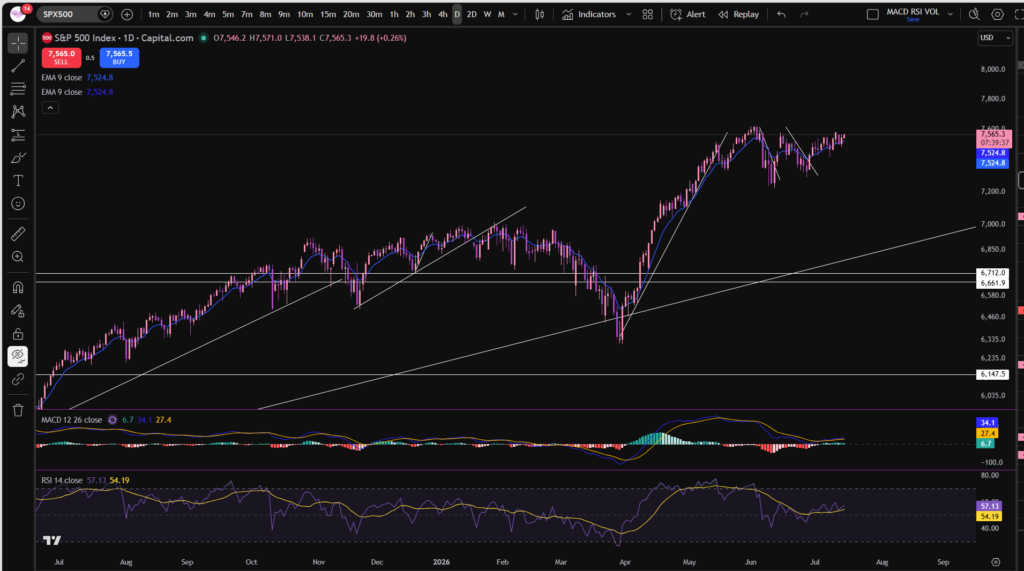
It’s important to consider the S&P 500 when considering the stock market today, to get more of a complete picture of what’s going on… Let’s take a look at the S&P 500 Chart and especially how this has been affected by the volatility on the NASDAQ:

S&P 500 – daily timeframe

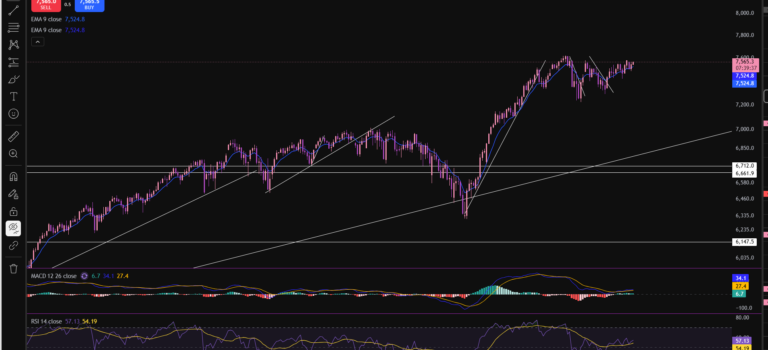
As you can see, it’s following a very similar shape to the shape of the NASDAQ, and this is no surprise, since the NASDAQ contains very large components of the S&P 500 – like Apple, Microsoft, Google etc. So the NASDAQ will continue to have a significant influence on the movements of the S&P 500 Index chart. A key difference to note here is that the MACD and Signal lines have already crossed to the upside on this one, but as you can see, the move was not strong – it’s quite weak… this is probably due to it being held down by the weight of the NASDAQ which hasn’t yet recovered to previous highs. For many traders, this will be a period of waiting… if you are a day trader, it’s possible you could make money in these types of markets, but my own personal trading style is to wait until the markets are pushing up… so i’m going to apply my discipline, and do just that.

I hope you found this article on the stock market today, helpful!

Let’s generate wealth independently, together!

Socials:

You Tube:

https://www.youtube.com/channel/UC__AuhOClF8FRudbmT05OKQ

Patreon:

https://www.patreon.com/sophiatrades

To watch me trade live and understand exactly how I make money using my own unique strategy in full, please visit my Patreon page here:

https://www.patreon.com/sophiatrades

Disclaimer!

Nothing on this blog should be taken as financial advice or encouragement for you to enter a trade.  You are expected to speak to a financial adviser or carry out your own due diligence before entering any positions.  Everything on this blog is made for educational purposes and to equip you with the knowledge you need to be able to make your own financial decisions.  I am not regulated by the Financial Conduct Authority.

For more great tips and advice on trading the stock market, please visit:

https://www.sophiatrades.co.uk

Finally, if you would like to receive a discount on the Trading View charting software I use, please click on the relevant link here:

https://www.tradingview.com/?aff_id=117138

Please note any subscriptions taken via my affiliate link with Trading View may result in me earning a small commission.  However, I provide complete transparency on me using Trading View personally – I publish my success on the financial markets via my broker reports and any profits earned were done so by using my own Trading View subscription,  so I genuinely do recommend them and have been using the Trading View charts for many years.

What is VWAP in Trading – Everything you Need to Know TO EDIT

What is VWAP in Trading – Everything you Need to Know TO EDIT

If you’ve ever wanted to become a successful stock market trader, you’ve probably heard the term VWAP thrown around. But what is VWAP in trading, exactly, and how can it help you make smarter trades? Today, let’s break down the VWAP indicator in a way that’s easy to understand and, more importantly, practical for your trading journey.

what is VWAP in trading

To understand what is VWAP in trading, let’s look at what it stands for – Volume Weighted Average Price. At its core, it’s a tool that gives you the average price of a stock throughout the trading day, but with a twist—it weighs each price by the volume of shares traded at that price. Think of it as a more nuanced average that reflects not just price movement but also how much activity is behind those moves.

So, why should you care about the answer to the question, what is VWAP in trading? For traders, especially day traders and short-term traders, VWAP is like a compass. It helps you gauge whether the current price is overvalued or undervalued relative to the day’s trading activity. Here’s how you can put it to work:

  • Trend Confirmation: If the price is above the VWAP line, it usually signals a strong buying trend. It means buyers are in control, and prices are generally pushing higher.
  • Support and Resistance: VWAP often acts as a dynamic support or resistance level. Prices tend to bounce off or struggle around this line, which can help you decide entry or exit points.
  • Trade Entries: Many traders look to buy when the price dips near or just below the VWAP during an uptrend. Conversely, they might consider selling or shorting when the price rises near the VWAP during a downtrend.
  • Intraday Benchmark: Institutional traders use VWAP to measure how well they’re executing trades compared to the average price weighted by volume. You can use this insight to avoid overpaying or underselling.

When considering what is VWAP in trading, should you combine VWAP with other indicators? Yes! VWAP is most useful when used alongside tools like moving averages, RSI, or candlestick patterns. For example, if the price is above VWAP and RSI shows an oversold condition, it might be a strong buy signal.

You should bear in mind, Keep in mind, VWAP resets at the start of each trading day, so it’s best suited for intraday trading rather than long-term investing. Like any tool, it’s not a fool proof entry or exit signal. Market conditions, news events, and volume spikes can sometimes cause price action to deviate sharply from VWAP. This is why it’s great to combine it with other indicators.

In essence, VWAP is a powerful indicator that blends price and volume, giving you a richer picture of market sentiment during the day. It’s like having a pulse on the market’s true average price, helping you make more informed decisions and manage risk better.

I hope you found this article helpful!

Let’s generate wealth independently, together!

Socials:

You Tube:

https://www.youtube.com/channel/UC__AuhOClF8FRudbmT05OKQ

Patreon:

https://www.patreon.com/sophiatrades

To watch me trade live and understand exactly how I make money using my own unique strategy in full, please visit my Patreon page here:

https://www.patreon.com/sophiatrades

Disclaimer!

Nothing on this blog should be taken as financial advice or encouragement for you to enter a trade.  You are expected to speak to a financial adviser or carry out your own due diligence before entering any positions.  Everything on this blog is made for educational purposes and to equip you with the knowledge you need to be able to make your own financial decisions.  I am not regulated by the Financial Conduct Authority.

For more great tips and advice on trading the stock market, please visit:

https://www.sophiatrades.co.uk

Finally, if you would like to receive a discount on the Trading View charting software I use, please click on the relevant link here:

https://www.tradingview.com/?aff_id=117138

Please note any subscriptions taken via my affiliate link with Trading View may result in me earning a small commission.  However, I provide complete transparency on me using Trading View personally – I publish my success on the financial markets via my broker reports and any profits earned were done so by using my own Trading View subscription,  so I genuinely do recommend them and have been using the Trading View charts for many years.
How to add the Exponential Moving Average indicator in Trading View – Everything you Need to Know

How to add the Exponential Moving Average indicator in Trading View – Everything you Need to Know

In this article i’m going to give you some simple instructions on how to add the Exponential Moving Avearge (EMA) indicator in Trading View. Let’s jump straight into it!

First of all, what is Trading View?

Trading View is a chart package which you can subscribe to. It’s the best one I have ever used. I’m still using it in my own trading – any screen shots I take in the ‘Chart Analysis’ section of my blog, are taken from my Trading View chart package:

Chart analysis – Sophia Trades – Learn how to Trade the Stock Market

Trading View is extremely intuitive as a chart package. You can filter and sort your watchlists in exactly the way you would like to – adding flags, sections – anything that can help with keeping your watchlists organised.

It allows you to log into many different brokers, and I have three different accounts of my own, hooked up on Trading View.

You can set alerts and have it email you when the price reaches a certain position or when particular scenarios occur in relation to your indicators.

I can offer users of my blog, a discount to this amazing software – just click the link below:

Where is the Exponential Moving Average indicator in this chart package?

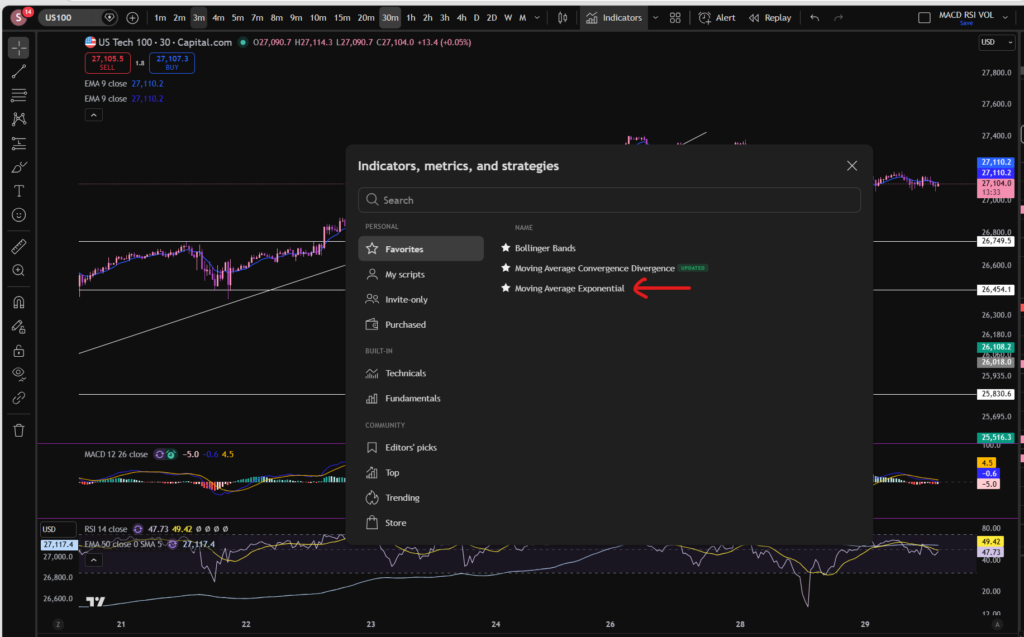
You can find the indicators by going to the indicators tab at the top of the charts. When you click on this tab, you will get a list come up of hundreds of different types of indicators. You can find the Exponential Moving Average indicator by typing in the search box, “Exponential Moving Average”. You will see the indicator appear. Note there are many different versions so you want to select the plain default version – people are building their own indicators in there so you want to avoid any that you are not familiar with:

Trading View

Here is what the plain default indicator looks like:

As you can see, my Exponential Moving Average indicator is in my favourites as this is one of the key indicators I use when implementing my strategy.

Once you have applied this indicator to your chart, you can tailor its settings by following the instructions in a related blog article. Please see the Trading View or Exponential Moving Average sections of the blog:

Best software reviews – Sophia Trades – Learn how to Trade the Stock Market

Technical indicators – Sophia Trades – Learn how to Trade the Stock Market

I hope you found this article helpful!

Socials:

You Tube:

Sophia Trades – YouTube

Patreon:

patreon.com/sophiatrades

Disclaimer!

Nothing on this blog should be taken as financial advice or encouragement for you to enter a trade.  You are expected to speak to a financial adviser or carry out your own due diligence before entering any positions.  Everything on this blog is made for educational purposes and to equip you with the knowledge you need to be able to make your own financial decisions.

For more great tips and advice on trading the stock market, please visit:

https://www.sophiatrades.co.uk

To watch me trade live please visit my patreon page here:

https://www.patreon.com/sophiatrades

Finally, if you would like to receive a discount on the Trading View charting software I use, please click on the relevant link here:

https://www.tradingview.com/?aff_id=117138

Please note any subscriptions taken via my affiliate link with Trading View may result in me earning a small commission.  However, I provide complete transparency on me using Trading View personally – I publish my success on the financial markets via my broker reports and any profits earned were done so by using my own Trading View subscription,  so I genuinely do recommend them and have been using the Trading View charts for many years.
How to add the Bollinger Bands indicator in Trading View – Everything you Need to Know

How to add the Bollinger Bands indicator in Trading View – Everything you Need to Know

In this article i’m going to give you some simple instructions on how to add the Bollinger Bands indicator in Trading View. Let’s jump straight into it!

First of all, what is Trading View?

Trading View is a chart package which you can subscribe to. It’s the best one I have ever used. I’m still using it in my own trading – any screen shots I take in the ‘Chart Analysis’ section of my blog, are taken from my Trading View chart package:

Chart analysis – Sophia Trades – Learn how to Trade the Stock Market

Trading View is extremely intuitive as a chart package. You can filter and sort your watchlists in exactly the way you would like to – adding flags, sections – anything that can help with keeping your watchlists organised.

It allows you to log into many different brokers, and I have three different accounts of my own, hooked up on Trading View.

You can set alerts and have it email you when the price reaches a certain position or when particular scenarios occur in relation to your indicators.

I can offer users of my blog, a discount to this amazing software – just click the link below:

Where is the Bollinger Bands indicator in this chart package?

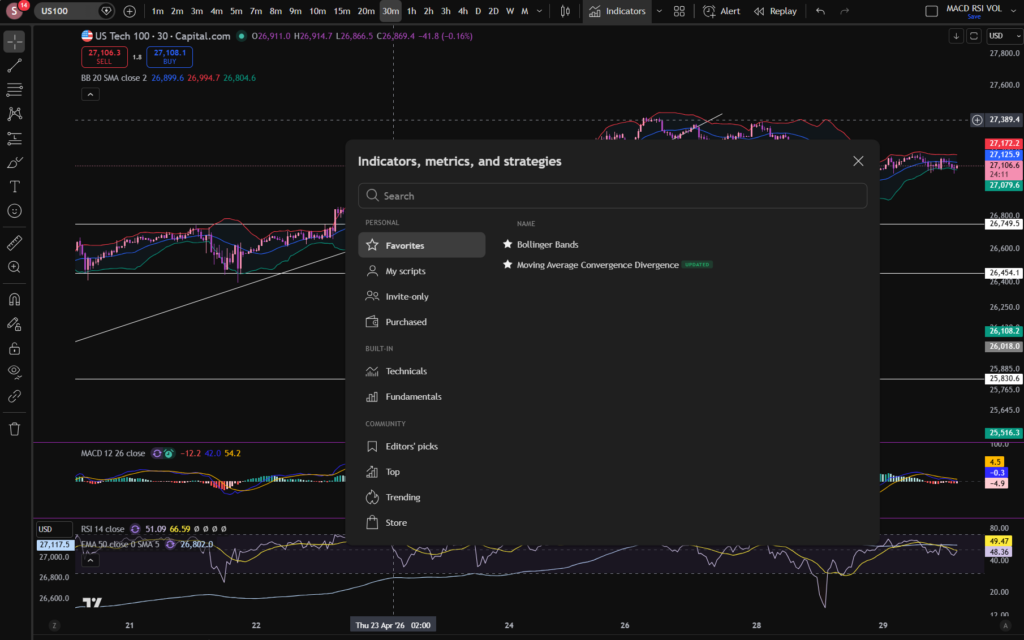
You can find the indicators by going to the indicators tab at the top of the charts. When you click on this tab, you will get a list come up of hundreds of different types of indicators. You can find the Bollinger Bands indicator by typing in the search box, “Bollinger Band”. You will see the indicator appear. Note there are many different versions so you want to select the plain default version – people are building their own indicators in there so you want to avoid any that you are not familiar with:

Trading View

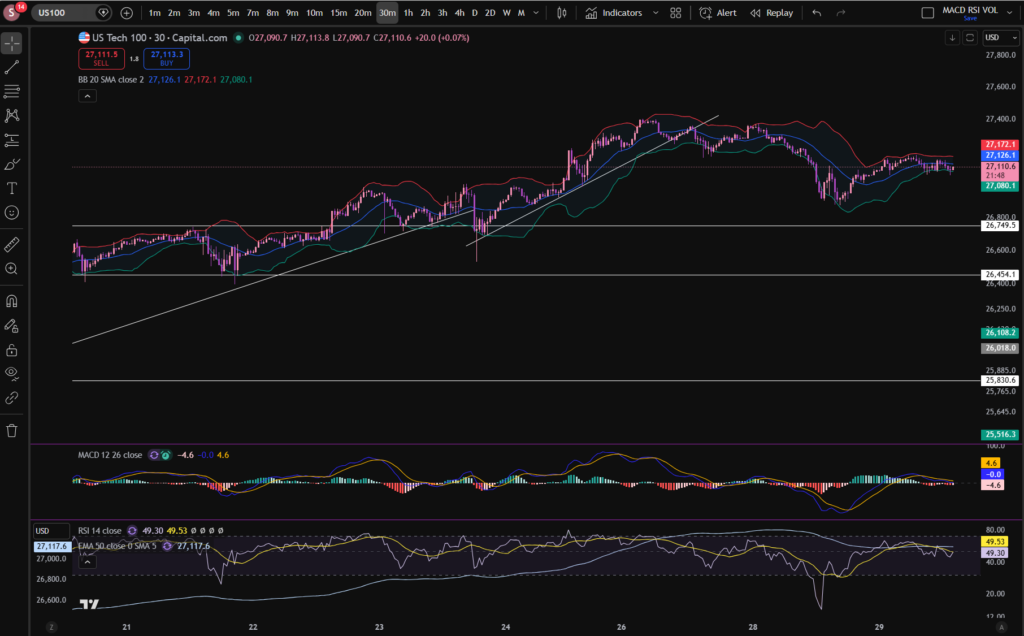
Here is what the plain default indicator looks like:

As you can see, my Bollinger Band indicator is in my favourites as this is one of the key indicators I use when implementing my strategy.

Once you have applied this indicator to your chart, you can tailor its settings by following the instructions in a related blog article. Please see the Trading View or Bollinger Bands sections of the blog:

Best software reviews – Sophia Trades – Learn how to Trade the Stock Market

Technical indicators – Sophia Trades – Learn how to Trade the Stock Market

I hope you found this article helpful!

Disclaimer!

Nothing on this blog should be taken as financial advice or encouragement for you to enter a trade.  You are expected to speak to a financial adviser or carry out your own due diligence before entering any positions.  Everything on this blog is made for educational purposes and to equip you with the knowledge you need to be able to make your own financial decisions.

For more great tips and advice on trading the stock market, please visit:

https://www.sophiatrades.co.uk

To watch me trade live please visit my patreon page here:

https://www.patreon.com/sophiatrades

Finally, if you would like to receive a discount on the Trading View charting software I use, please click on the relevant link here:

https://www.tradingview.com/?aff_id=117138

Please note any subscriptions taken via my affiliate link with Trading View may result in me earning a small commission.  However, I provide complete transparency on me using Trading View personally – I publish my success on the financial markets via my broker reports and any profits earned were done so by using my own Trading View subscription,  so I genuinely do recommend them and have been using the Trading View charts for many years.
How to Change the MACD settings on Trading View

How to Change the MACD settings on Trading View

In this article i’m going to talk about how you can change the MACD settings in Trading View, to suit your trading style and strategy. I’m going to talk about the length of the MACD and signal lines, and the colours of the histogram and the lines. Let’s jump straight into it!

First of all, what is the MACD indicator?

‘MACD’ stands for Moving Average Convergence Divergence. It does what it says on the tin! It’s the consecutive convergence and divergence of two moving averages. I published a separate blog article, explaining how you can use the MACD indicator to make more money in your trading, linked below, so I won’t go into that here. However, I do want to explain to you how you can change the settings on the indicator.

How to change the settings on the MACD indicator in Trading View

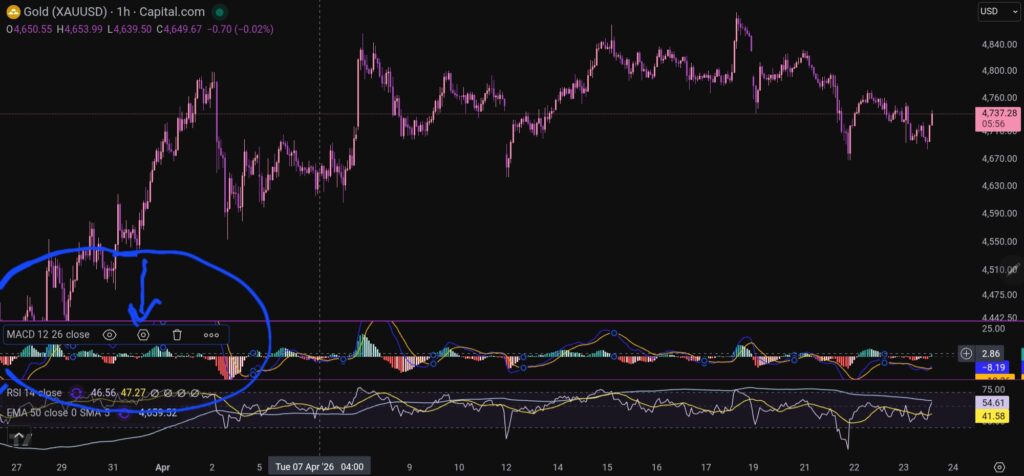
OK, so now i’m going to share with you how you can change the settings on the MACD indicator. To change the length of the moving average lines, tap anywhere on the MACD indicator, and you will see the settings menu come up – it appears on the leeft of the sceen, as shown below:

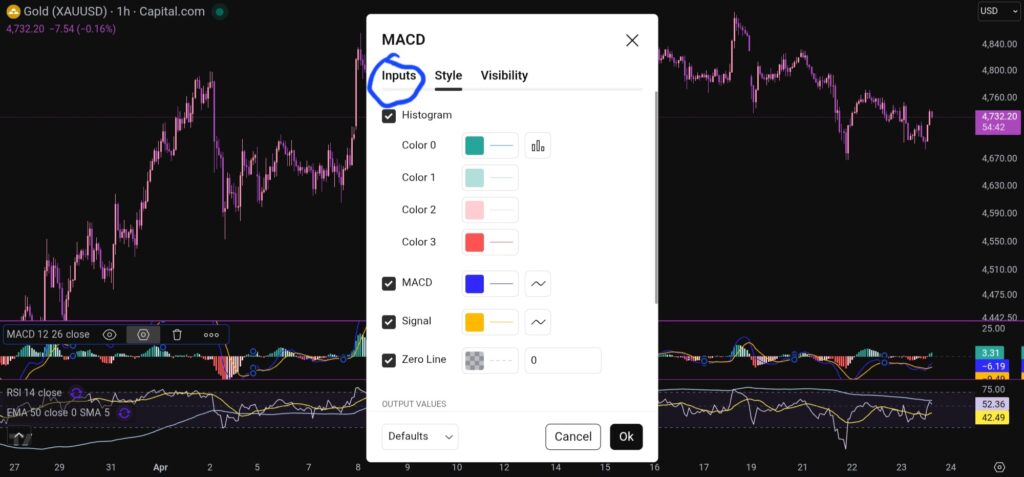
When you click on the little hexagon shape, it will bring up a menu, as follow:

Trading View

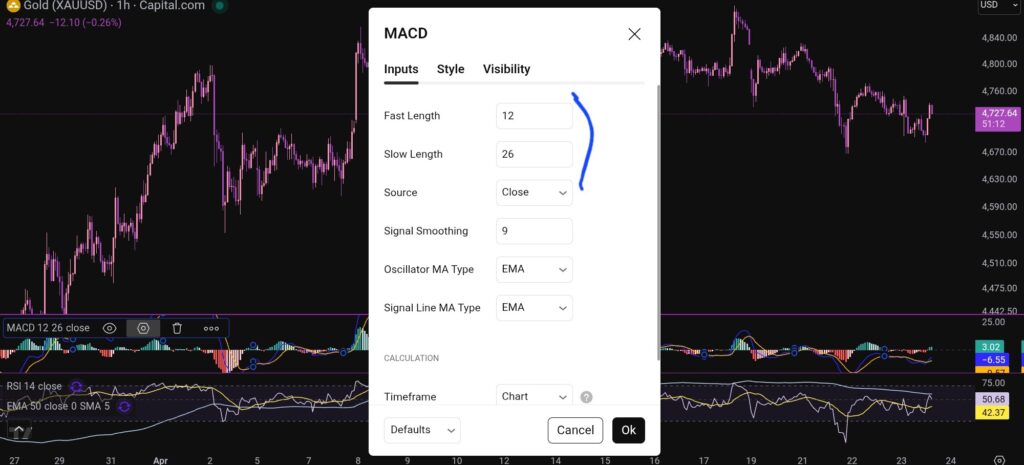
You want to click next on the ‘inputs’ tab as shown above, and you will see this screen next:

Trading View

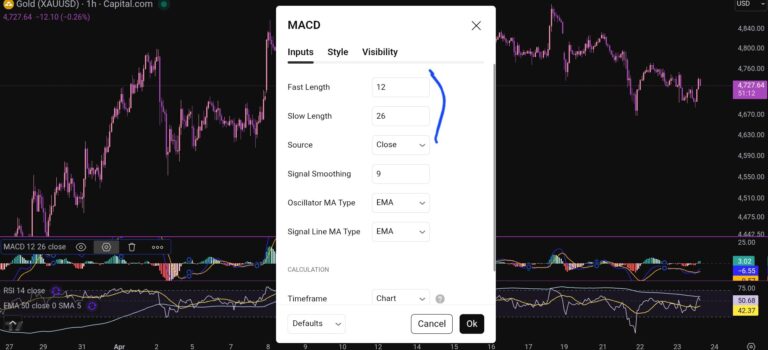
As you can see, you can alter the lengths of the moving averages here by changing the values in the field boxes.

How do you change the colour scheme of the MACD indicator?

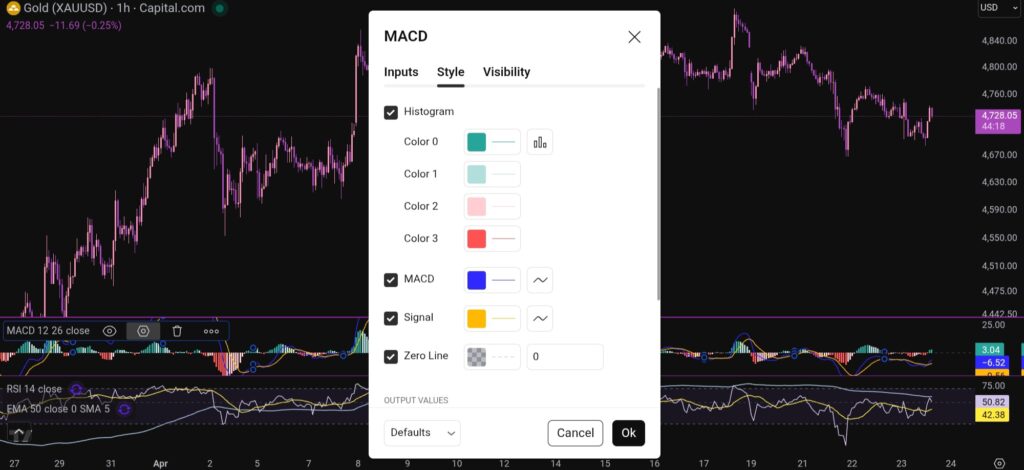
Changing the colour scheme of the MACD indicator in Trading View is just as easy as changing the moving averages. You simply click on settings with the hexagonal shape again, and the first box which comes up, is the menu where you have the option to change the colours of the MACD indicator:

Trading View

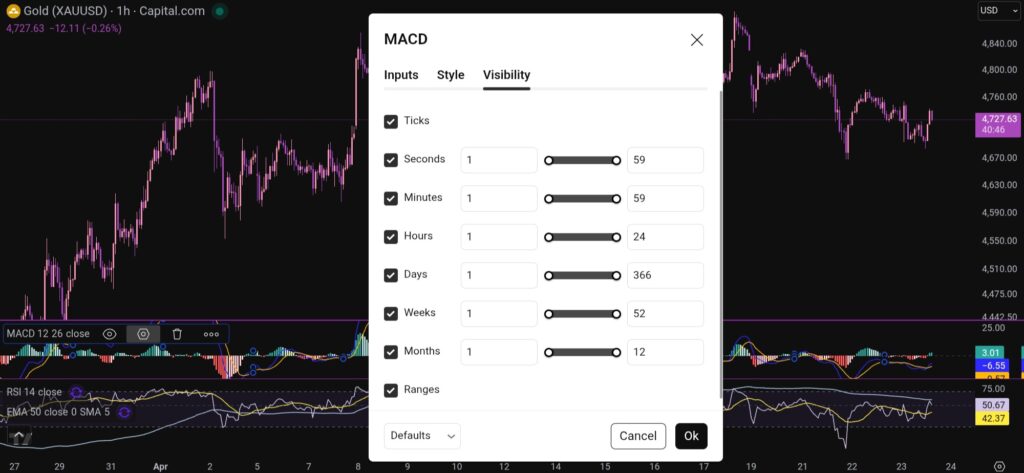
You can also change the visibility of the MACD indicator by clicking on the tab for this, and you will see this menu:

Trading View

I hope you found this article helpful!

Disclaimer!

Nothing on this blog should be taken as financial advice or encouragement for you to enter a trade.  You are expected to speak to a financial adviser or carry out your own due diligence before entering any positions.  Everything on this blog is made for educational purposes and to equip you with the knowledge you need to be able to make your own financial decisions.

For more great tips and advice on trading the stock market, please visit:

https://www.sophiatrades.co.uk

To watch me trade live please visit my patreon page here:

https://www.patreon.com/sophiatrades

Finally, if you would like to receive a discount on the Trading View charting software I use, please click on the relevant link here:

https://www.tradingview.com/?aff_id=117138

Please note any subscriptions taken via my affiliate link with Trading View may result in me earning a small commission.  However, I provide complete transparency on me using Trading View personally – I publish my success on the financial markets via my broker reports and any profits earned were done so by using my own Trading View subscription,  so I genuinely do recommend them and have been using the Trading View charts for many years.
Best stocks to buy now – Everything you Need to Know

Best stocks to buy now – Everything you Need to Know

In this article i’m going to have a look at what’s happening on some of the major indices, with a view to answering the question, ‘what are the best stocks to buy now?’. Let’s jump straight into it!

What’s happening on the NASDAQ today – best stocks to buy now

Best stocks to buy now

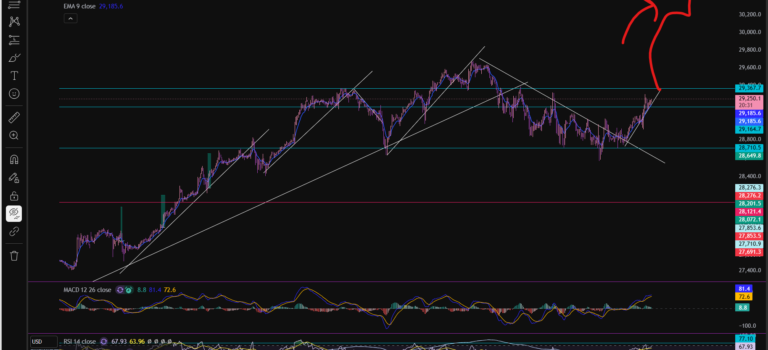
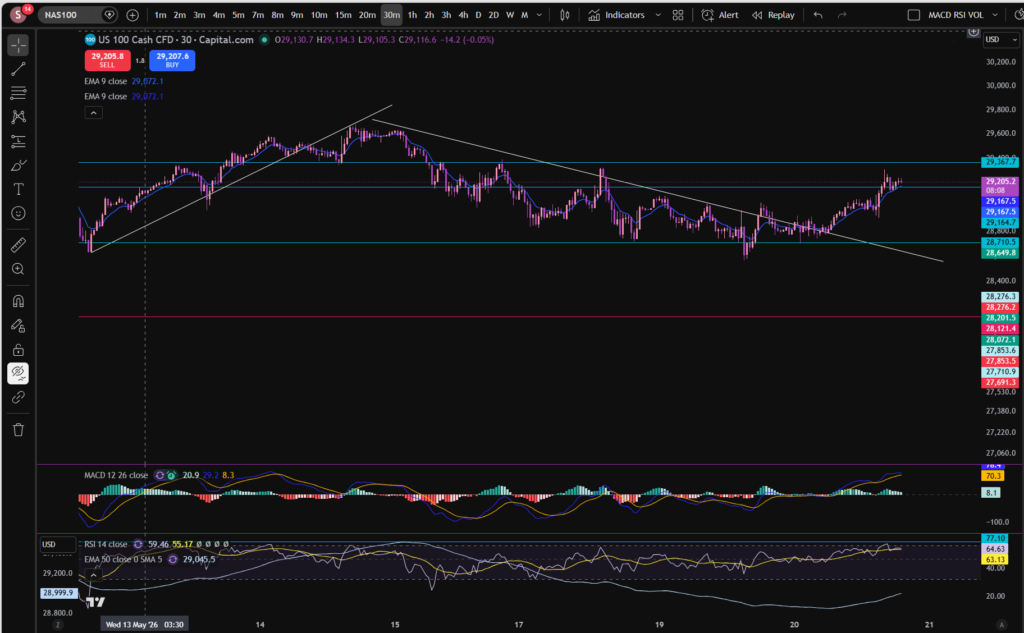
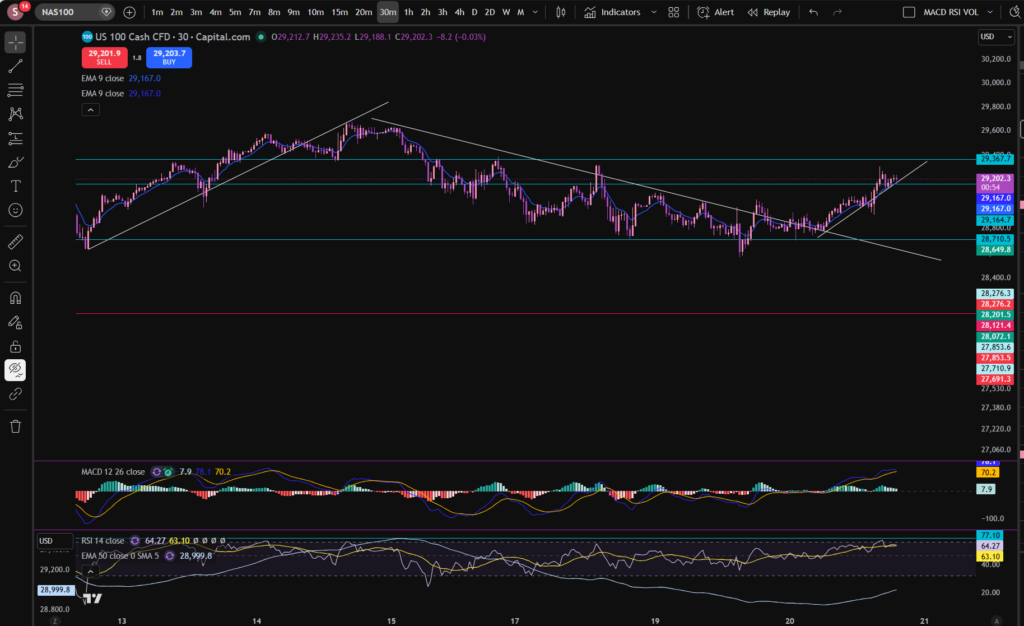
I mentioned a few days ago that the market was downtrending and the old diagonal support had become a resistance. This followed the same pattern, until today, when the market broke through the diagonal resistance line, on the 30 minute timeframe, as you can see, above. The market is now forming a new pattern – let’s mark it on the chart:

Best stocks to buy now

As you can see, the price has been bouncing off the diagonal trend line above since earlier today. It does appear to be uptrending again with a new low having formed at a higher price than the previous one.

I can’t consider the best stocks to buy now, without also considering the bird’s eye view of the NASDAQ. Let’s look at the daily timeframe:

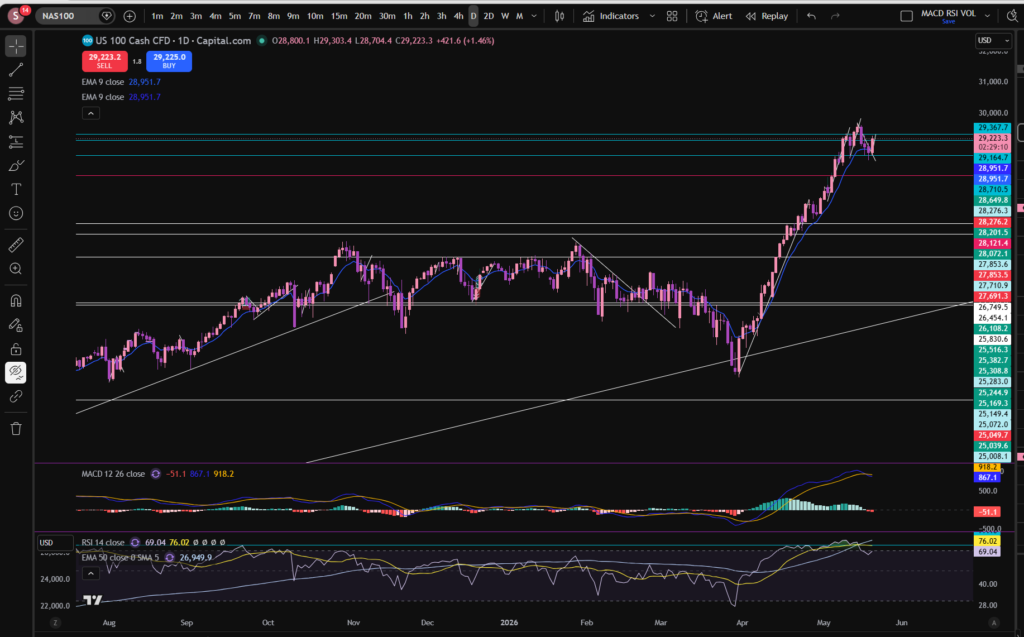
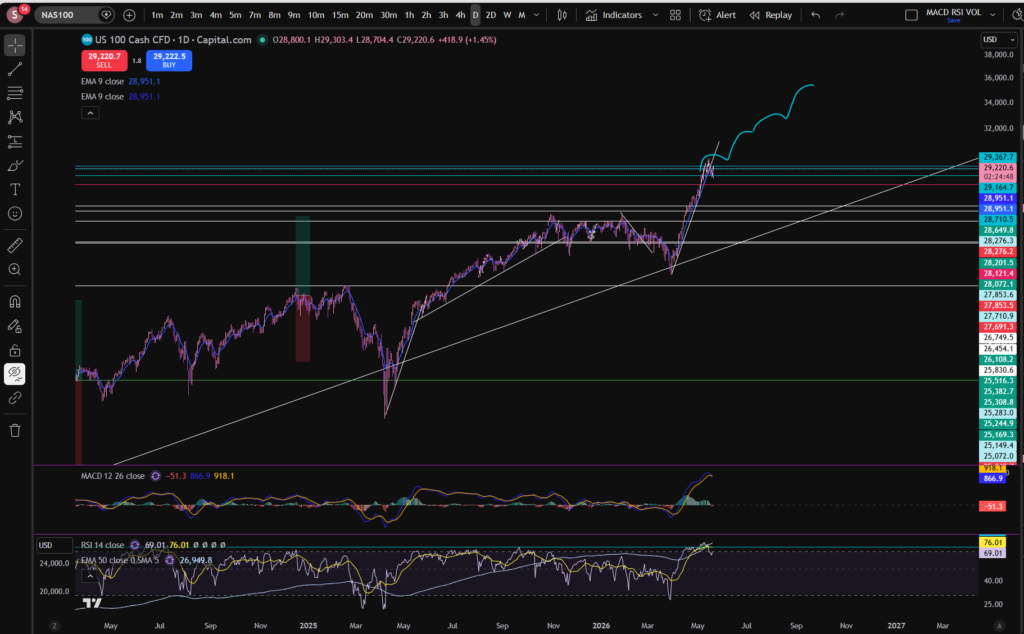
As you can see on the daily timeframe, the histogram bars have turned red. However, the RSI has pulled back quite a bit from where it peaked, marked above with the turquoise horizontal line. It is not clear to me currently, whether it will keep pushing up again or pull back some more… Ultimately, I think the type of shape such as the one drawn below, would be reasonable, in circumstances where it’s going to keep on pushing up:

You can see it has made this pattern a number of times before, when moving away from the enormous diagonal support which it bounces on from the point of view of the daily/monthly timeframe.

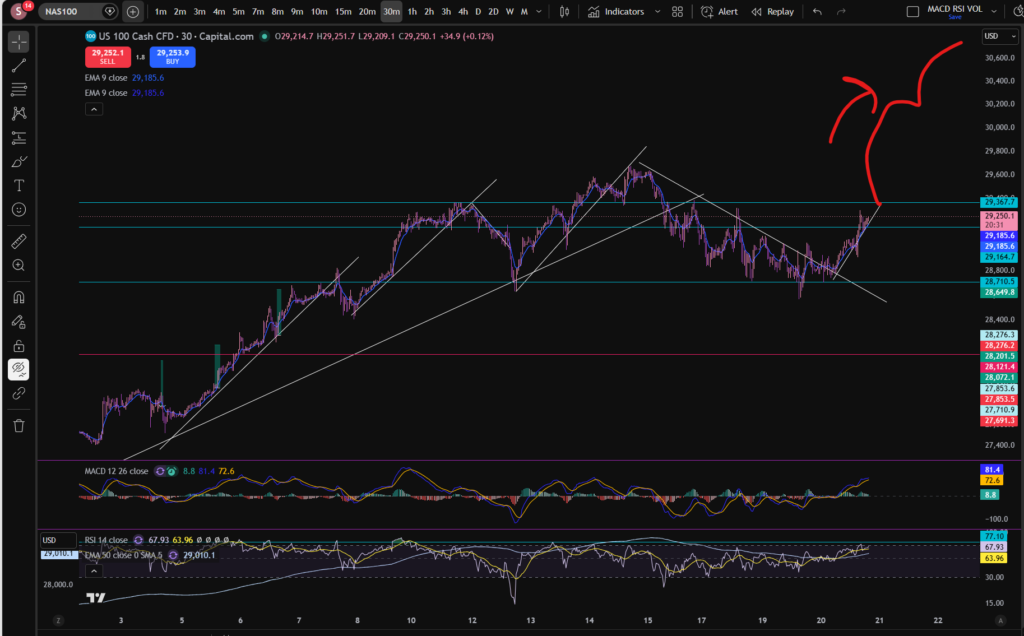
How can we know whether it has finished pulling back? Well… the fact it’s making higher highs and higher lows on the 30 minute timeframe, is a good sign. If it pushes up past the old all time high, this would be another good sign…Let’s take a look at that timeframe again:

Once it starts bumping up above the other previous all time high as illustrated above, this would give me a bit more confidence but i’m always keeping an eye on the bird’s eye view as well, and the RSI indicator, on all timeframes.

As of right now, I think i’m going to wait a little longer…

I hope you found this article on the best stocks to buy now, helpful!

Let’s generate wealth independently, together!

Socials:

You Tube:

https://www.youtube.com/channel/UC__AuhOClF8FRudbmT05OKQ

Patreon:

https://www.patreon.com/sophiatrades

To watch me trade live and understand exactly how I make money using my own unique strategy in full, please visit my Patreon page here:

https://www.patreon.com/sophiatrades

Disclaimer!

Nothing on this blog should be taken as financial advice or encouragement for you to enter a trade.  You are expected to speak to a financial adviser or carry out your own due diligence before entering any positions.  Everything on this blog is made for educational purposes and to equip you with the knowledge you need to be able to make your own financial decisions.

For more great tips and advice on trading the stock market, please visit:

https://www.sophiatrades.co.uk

Finally, if you would like to receive a discount on the Trading View charting software I use, please click on the relevant link here:

https://www.tradingview.com/?aff_id=117138

Please note any subscriptions taken via my affiliate link with Trading View may result in me earning a small commission.  However, I provide complete transparency on me using Trading View personally – I publish my success on the financial markets via my broker reports and any profits earned were done so by using my own Trading View subscription,  so I genuinely do recommend them and have been using the Trading View charts for many years.

Best stocks to buy now – Everything You Need to Know

Best stocks to buy now – Everything You Need to Know

In this article i’m going to consider the best stocks to buy now. I’m going to take you through what’s happening on the markets in general as an initial step, to check whether the markets are suitable for a buy entry, currently. Let’s get straight into it!

Best stocks to buy now – let’s see what’s happening on the NASDAQ index chart, first…

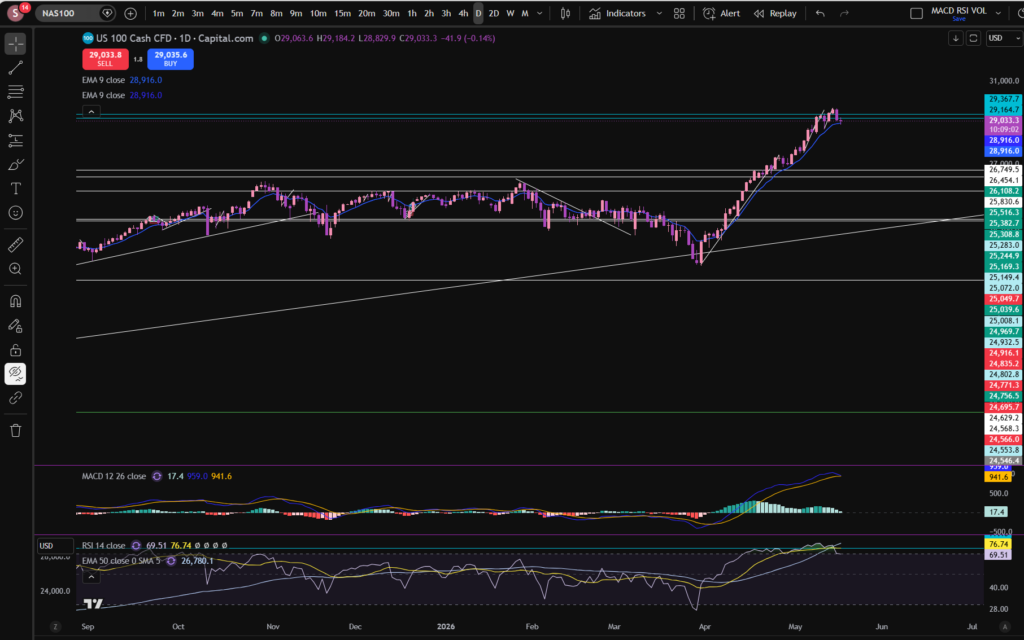
My first step in determining the best stocks to buy now, is to have a look at the high level, bird’s eye view, picture. I’ve grabbed a screen print of the NASDAQ’s daily timeframe chart, using my favourite software tool, Trading View:

best stocks to buy now

OK, as you can see, per the daily timeframe, the MACD indicator’s histogram, looks like it’s shrinking in size, and it’s turned to a very pale green colour. This means the price is losing momentum in the upwards push. If we consider the RSI indicator, the level has pulled back quite a bit from where it was – it’s currently sitting at 69.51 but it had reached a level which has acted as an RSI resistance, previously, at around 77.5 – you can see this level marked in a turquoise colour on the RSI indicator. I added this mark last week when analysing the markets – and it was my suggestion that when it reaches this level, the history is that it has typically pulled back from there. This suggestion is now playing out on the chart – as you can see above. It is important to get a good bird’s eye view, in this way, when considering the best stocks to buy now.

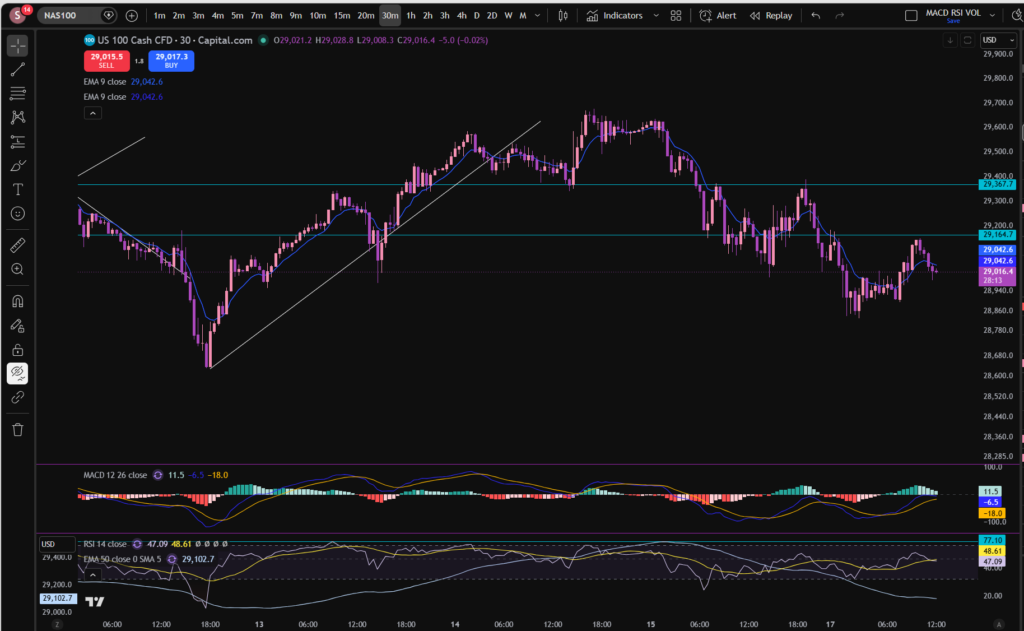
The turquoise lines at the top of the chart marked very close together, were some resistance and support levels I had marked on the chart last week on the 30 minute timeframe. Let’s zoom in and see what’s happening more closely…

NASDAQ 30 minute timeframe

best stocks to buy now

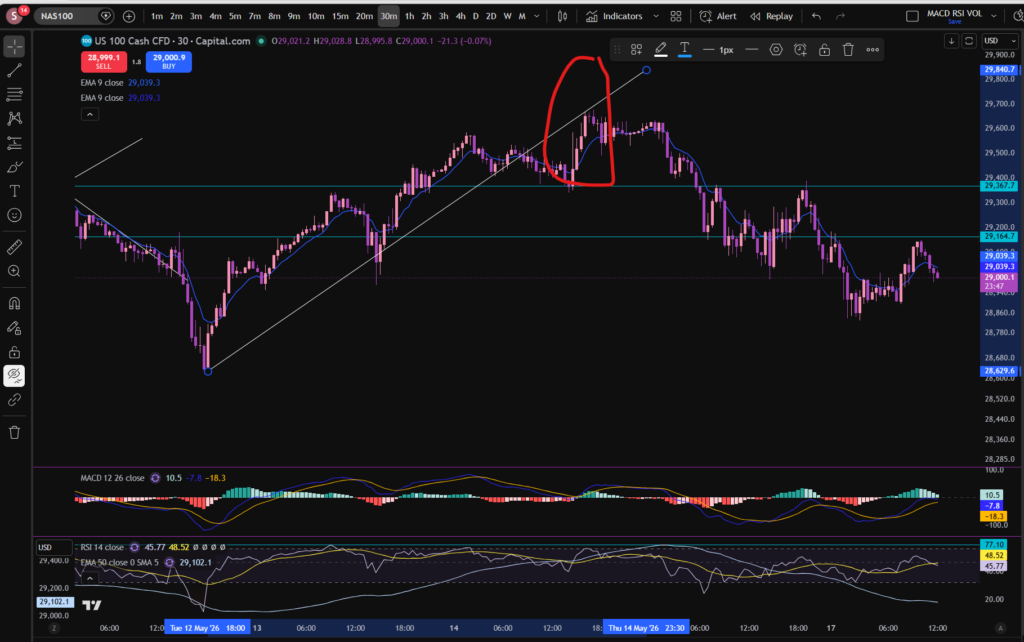
As you can see, from around the 15th of May, the market has been strongly pulling back per the 30 minute timeframe. The price broke a diagonal support level which had formed and this became the resistance, here:

best stocks to buy now

Now the price is descending. It looks like the momentum is still strong because even on this 30 minute timeframe, the MACD is just about to cross over to the downside, over the signal line – the histogram is about to turn red. It remains to be seen how long the pull back will go on for. On the daily timeframe, the RSI is now at a level which has previously acted as a support but we will need to see whether it starts to recover or comes down a bit more.

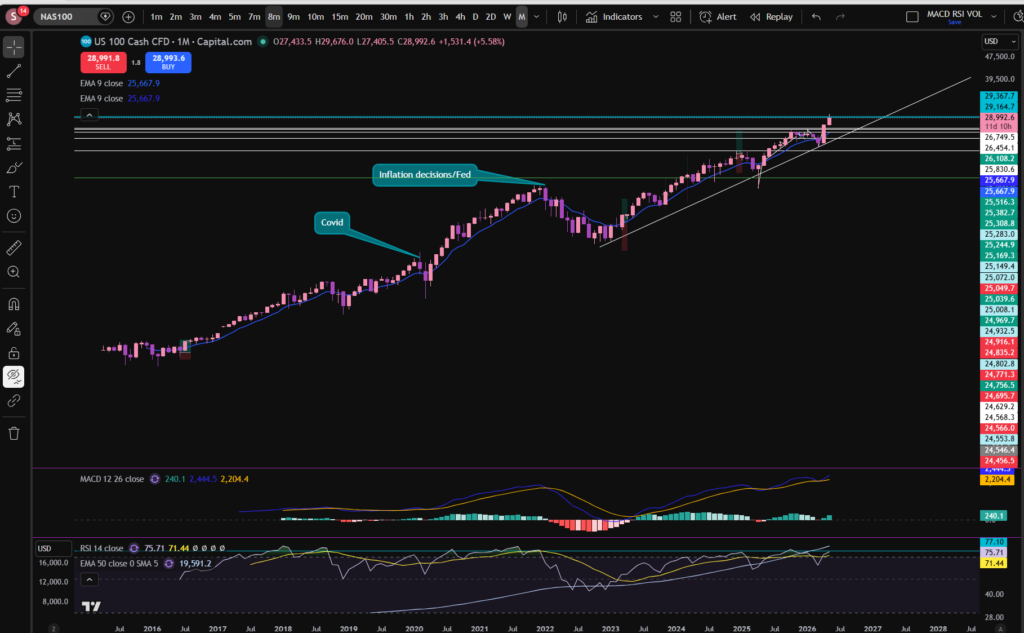
The final timeframe I want to consider, is the monthly timeframe:

I mentioned last week that the price had recently bounced from a long term diagonal support. The MACD histogram here, is dark green and growing although the RSI is still quite high.

When considering best stocks to buy now, I consider these charts very carefully to determine which direction the markets might be headed in, in the short term. Nobody can know the answer for sure, but what would I be wanting to see, before jumping into any trades? I want to see the 30 minute timeframe recovering – making higher highs and higher lows. It is not in this position, currently. Note that any future patterns will form on the lower timeframes first – the smaller timeframes are like a glimpse into the potential future…

Given what’s happening on the NASDAQ and that this in turn actually heavily influences the performance of its constituents and those of the S&P 500, I will be patiently waiting for now. I know this is not what some traders want to hear, especially when they are new to trading. However, one of the biggest lessons you must learn in trading, is when to exercise some restraint. Obviously, what I say here, is relevant to my own personal style of trading – I do not short the markets. I only buy into them.

I hope you found this article helpful on the best stocks to buy now!

Disclaimer!

Nothing on this blog should be taken as financial advice or encouragement for you to enter a trade.  You are expected to speak to a financial adviser or carry out your own due diligence before entering any positions.  Everything on this blog is made for educational purposes and to equip you with the knowledge you need to be able to make your own financial decisions.

For more great tips and advice on trading the stock market, please visit:

https://www.sophiatrades.co.uk

To watch me trade live please visit my patreon page here:

https://www.patreon.com/sophiatrades

Finally, if you would like to receive a discount on the Trading View charting software I use, please click on the relevant link here:

https://www.tradingview.com/?aff_id=117138

Please note any subscriptions taken via my affiliate link with Trading View may result in me earning a small commission.  However, I provide complete transparency on me using Trading View personally – I publish my success on the financial markets via my broker reports and any profits earned were done so by using my own Trading View subscription,  so I genuinely do recommend them and have been using the Trading View charts for many years.
Stocks today – Everything you Need to Know

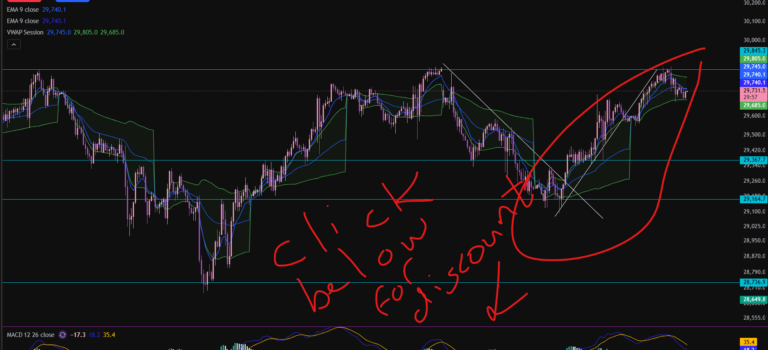
Stocks today – Everything you Need to Know

In this article i’m going to consider stocks today by examining what’s been happening on the NASDAQ. As always any chart analysis which is performed is to help you understand how to make your own decisions about where you think the markets might go next. Let’s get straight into it!

Stocks today – NASDAQ

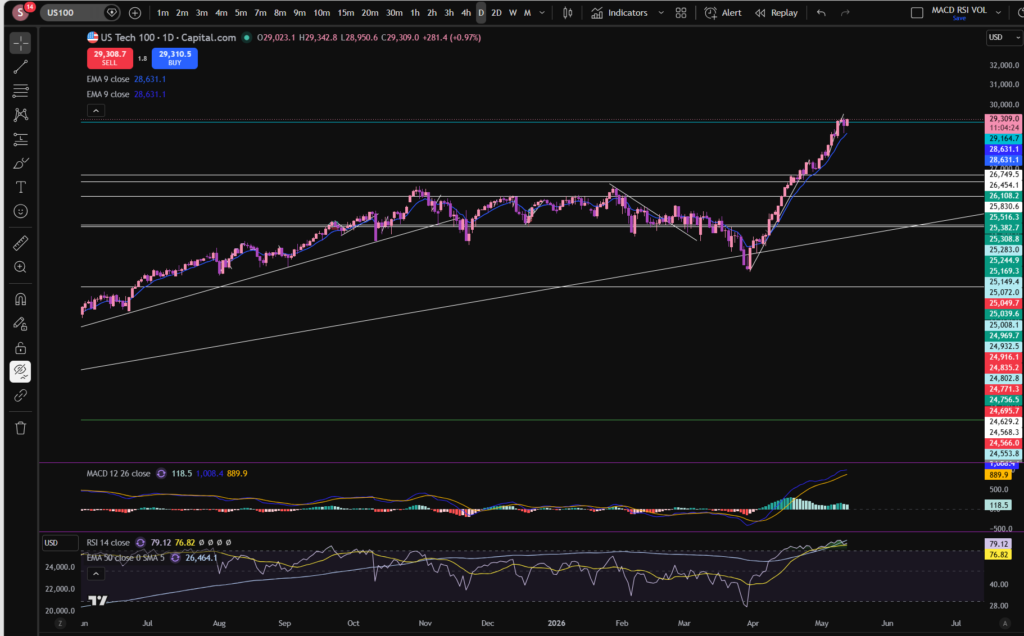
One of the first things I look at when considering stocks today, is I check what’s happening on the birds eye view of the NASDAQ daily timeframe:

stocks today

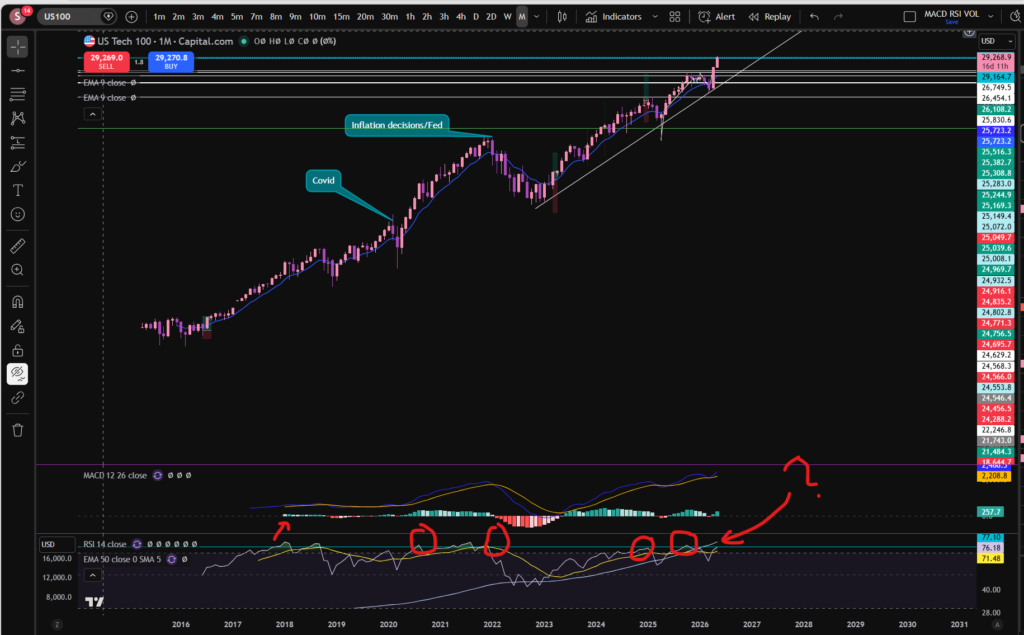
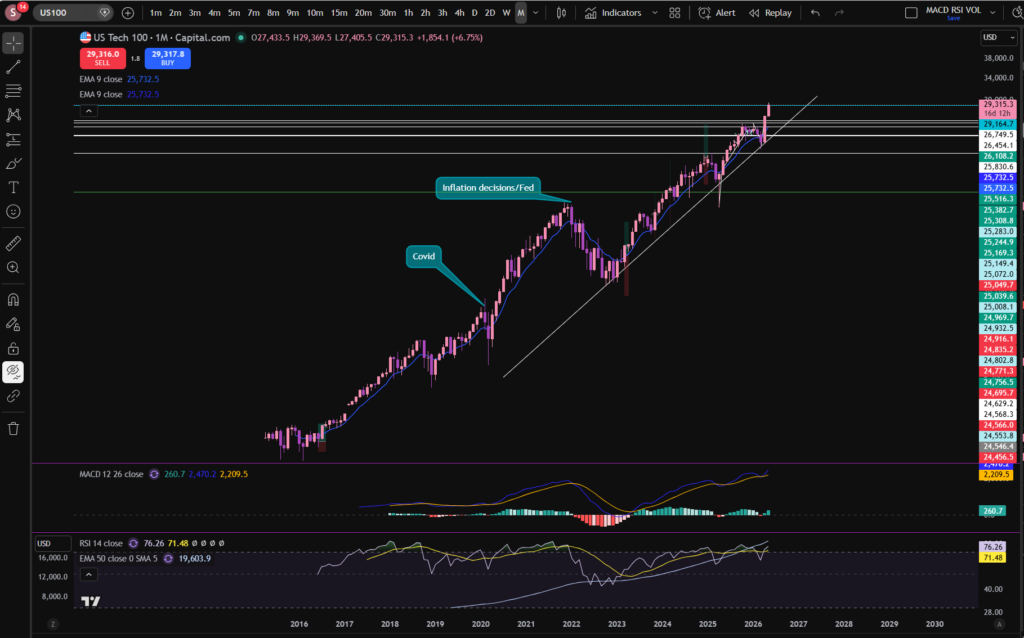
As you can see, the NASDAQ index, pushed away from a major diagonal support line in around April. The price has been pushing up strongly since then, but we did experience a little pull back in the last week or so. It’s good when looking at stocks today, to consider the ‘even bigger’ picture, by considering the monthly timeframe, so you can get the diagonal trendline into perspective:

stocks today

I’ve left a link to a discount to the Trading View chart software I use, above – this is a great tool to help you on your trading journey. I use this software every single day, to analyse stocks today.

It’s good as a technical analysis trader, to switch between different time frames to either zoom in, or out. I have published a separate blog article on this, to help you to understand it in detail. Please see the link below:

Multiple Timeframe Analysis – mind blowing knowledge that will change everything! – Sophia Trades – Learn how to Trade the Stock Market

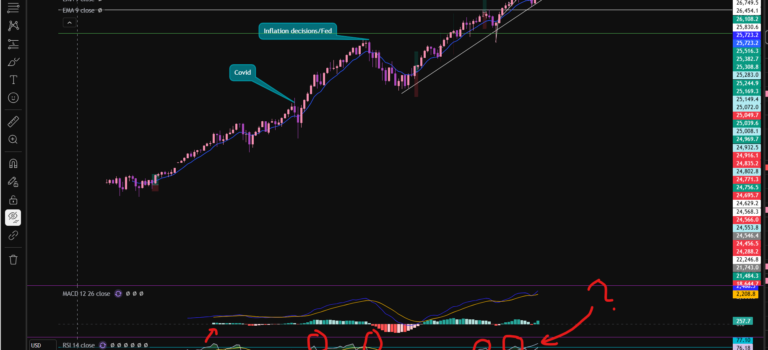
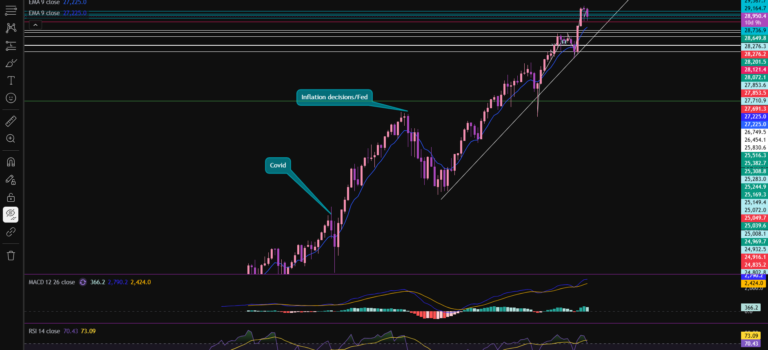
OK, so back to our analysis! As you can see from the above monthly timeframe chart, the price of the NASDAQ has been bouncing, steadily against the diagonal trend line which I marked on the chart, for a long time – this dates back to 2022! Even before that, another trend line can be seen just from looking at the chart, dating back to 2016! This was when it then ended with a large pull back due to the FED’s decisions to increase the interest rates in the US.

OK, so with all that in mind, you can see that the price has quite recently pushed away from this trend line once again. The RSI is showing as quite high on the monthly timeframe. It looks like the usual pattern of it pushing away from this trend line is that it goes for quite a while, but there are minor ‘price corrections’ along the way where it pulls back to breath. The price did pull back slightly last week on the 30 minute timeframe. Notwithstanding this, the RSI is still quite high on the monthly timeframe. Does it need a bit more of a pull back? The answer to this question, remains to be seen. Let’s take a look at the 30 minute timeframe, to zoom in:

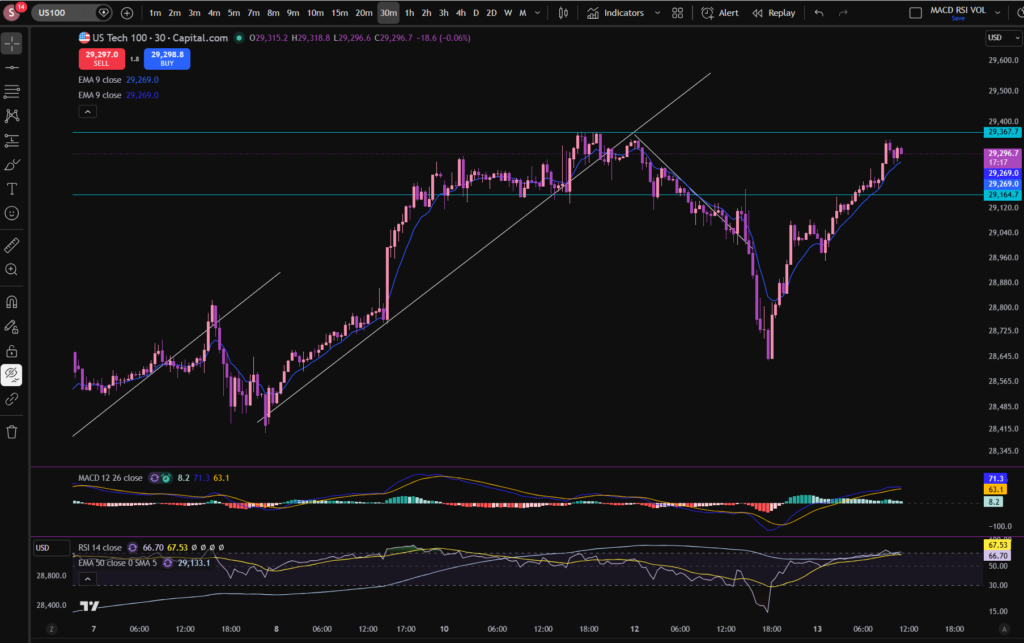
stocks today

As you can see, we saw a huge gouge down from the point of view of the 30 minute timeframe. However, the price has since pushed up again, strongly. At the current moment, the price has almost recovered to where it was originally, but the RSI on the monthly timeframe is still very high. Let’s consider what typically happens in this scenario on the monthly timeframe:

This is what I love about Trading View. I’ve drawn a line, on the RSI indicator where the price touches and rebounds most of the time. You can see for yourself what typically happens. Now look at where it sits currently? There are some instances where it pushed beyond this line but those do not happen regularly.
So what will happen next? I can’t tell you the answer to this, but perhaps my analysis can help you to decide for yourself?

The idea of this analysis is to set you up to be able to identify patterns yourself in the previous price movements and these patterns can help you to identify best places to trade.

I hope you found this article helpful!

Disclaimer!

Nothing on this blog should be taken as financial advice or encouragement for you to enter a trade.  You are expected to speak to a financial adviser or carry out your own due diligence before entering any positions.  Everything on this blog is made for educational purposes and to equip you with the knowledge you need to be able to make your own financial decisions.

For more great tips and advice on trading the stock market, please visit:

https://www.sophiatrades.co.uk

To watch me trade live please visit my patreon page here:

https://www.patreon.com/sophiatrades

Finally, if you would like to receive a discount on the Trading View charting software I use, please click on the relevant link here:

https://www.tradingview.com/?aff_id=117138

Please note any subscriptions taken via my affiliate link with Trading View may result in me earning a small commission.  However, I provide complete transparency on me using Trading View personally – I publish my success on the financial markets via my broker reports and any profits earned were done so by using my own Trading View subscription,  so I genuinely do recommend them and have been using the Trading View charts for many years.