Let’s take a look at the stock market today to see what’s happening. Are the markets recovering? Is AI tech still considered slightly overvalued? Let’s try to answer some of these questions by looking at some charts!
Stock market today – the NASDAQ / AI Tech
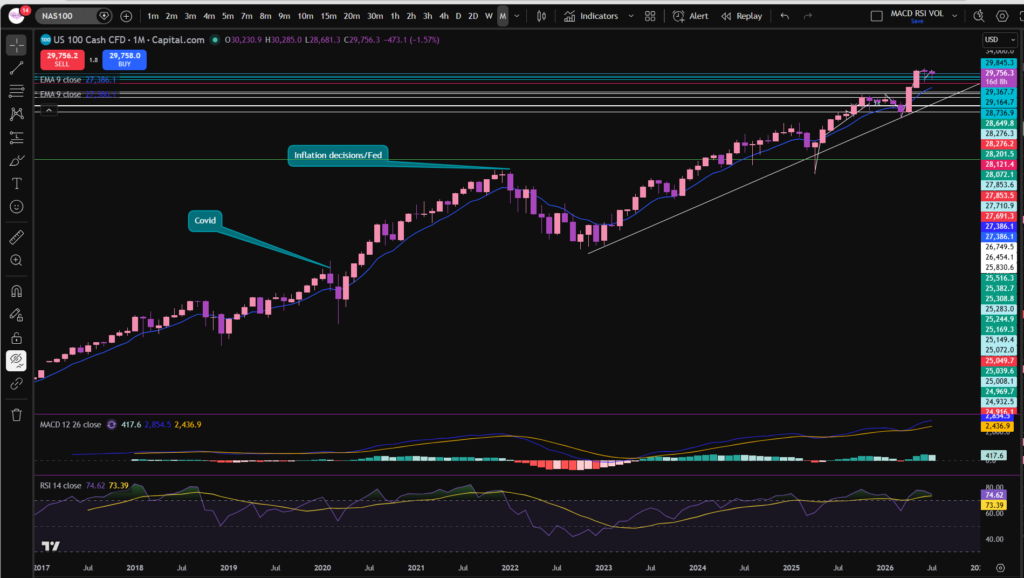
Let’s just jump straight into considering the NASDAQ index chart – this will give us some key information about what’s happening with stocks today. I’m considering the monthly timeframe first:
To get a discount to the chart software I use, follow the link below – i’m with Trading View:
As you can see, on the monthly timeframe, the NASDAQ has been dancing around the new highs it reached recently after a strong push up from the long diagonal trend line which has been present on the chart since mid 2023. It looks like it’s taken a bit of a breather in the last few weeks. However, note when you zoom in, that the two purple candles which have formed in the last two months, have got long tails. These types of candles can happen where, initially, sellers push the price down, but then confidence resumes in the market, and the buyers step in and push it up again to the previous level. These candles are called hammer candlestick patterns. You can learn about them here:
Japanese Candlesticks – Sophia Trades – Learn how to Trade the Stock Market
OK, so we can see what’s happening on the monthly timeframe chart… let’s take a look at the daily timeframe:
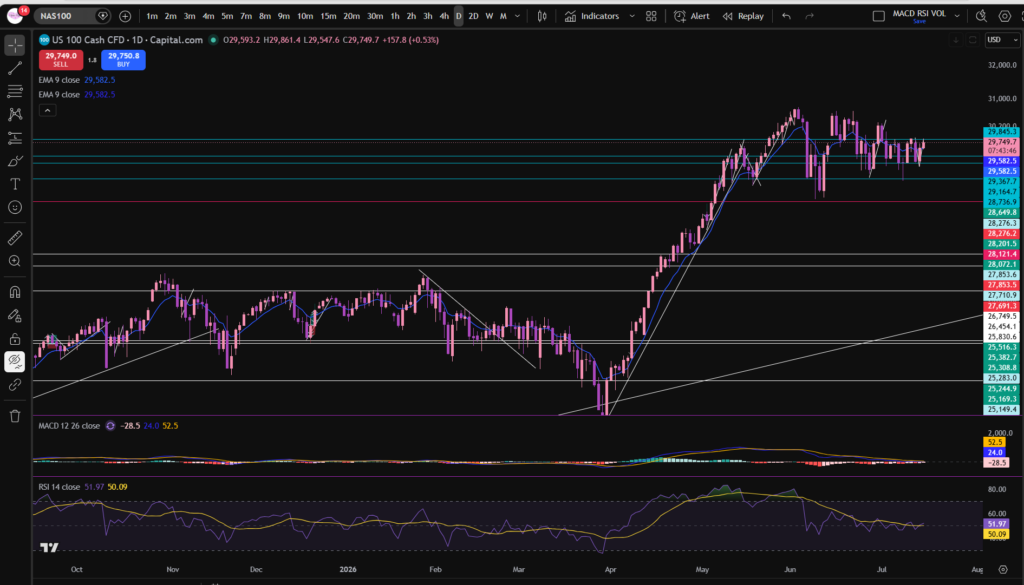
As you can see, the monthly timeframe on the NASDAQ has been extremely choppy, indeed, in terms of the stock market today. It’s been bouncing around the same level since around the beginning of June…. However, note that the MACD and signal lines had moved below the zero level of the histogram and the MACD and signal lines could be due for a cross over to the upside. This is not a guarantee that the price will start recovering, however. The price most recently pushed again away from the horizontal support level you can see above at around 29,542. So prices are holding firm and pushing up slightly from the key support area – meaning they look like they are holding firm, for now.
It’s important to consider the S&P 500 when considering the stock market today, to get more of a complete picture of what’s going on… Let’s take a look at the S&P 500 Chart and especially how this has been affected by the volatility on the NASDAQ:
S&P 500 – daily timeframe
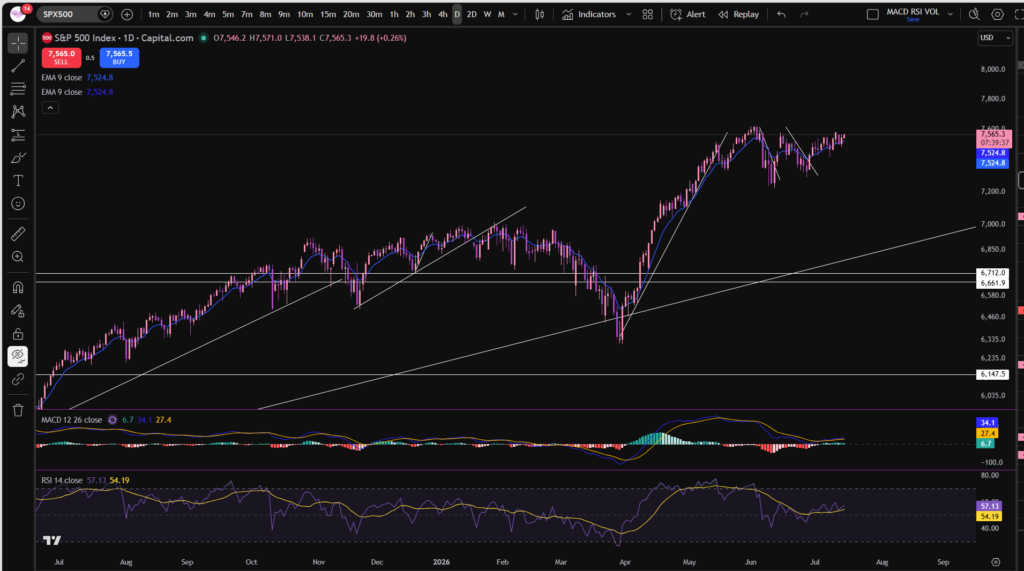
As you can see, it’s following a very similar shape to the shape of the NASDAQ, and this is no surprise, since the NASDAQ contains very large components of the S&P 500 – like Apple, Microsoft, Google etc. So the NASDAQ will continue to have a significant influence on the movements of the S&P 500 Index chart. A key difference to note here is that the MACD and Signal lines have already crossed to the upside on this one, but as you can see, the move was not strong – it’s quite weak… this is probably due to it being held down by the weight of the NASDAQ which hasn’t yet recovered to previous highs. For many traders, this will be a period of waiting… if you are a day trader, it’s possible you could make money in these types of markets, but my own personal trading style is to wait until the markets are pushing up… so i’m going to apply my discipline, and do just that.
I hope you found this article on the stock market today, helpful!
Let’s generate wealth independently, together!

Socials:
You Tube:
https://www.youtube.com/channel/UC__AuhOClF8FRudbmT05OKQ
Patreon:
https://www.patreon.com/sophiatrades
To watch me trade live and understand exactly how I make money using my own unique strategy in full, please visit my Patreon page here:
https://www.patreon.com/sophiatrades
Disclaimer!
Nothing on this blog should be taken as financial advice or encouragement for you to enter a trade. You are expected to speak to a financial adviser or carry out your own due diligence before entering any positions. Everything on this blog is made for educational purposes and to equip you with the knowledge you need to be able to make your own financial decisions. I am not regulated by the Financial Conduct Authority.
For more great tips and advice on trading the stock market, please visit:
https://www.sophiatrades.co.uk
Finally, if you would like to receive a discount on the Trading View charting software I use, please click on the relevant link here:
https://www.tradingview.com/?aff_id=117138
Please note any subscriptions taken via my affiliate link with Trading View may result in me earning a small commission. However, I provide complete transparency on me using Trading View personally – I publish my success on the financial markets via my broker reports and any profits earned were done so by using my own Trading View subscription, so I genuinely do recommend them and have been using the Trading View charts for many years.