In this article i’m going to consider the best stocks to buy now. I’m going to take you through what’s happening on the markets in general as an initial step, to check whether the markets are suitable for a buy entry, currently. Let’s get straight into it!
Best stocks to buy now – let’s see what’s happening on the NASDAQ index chart, first…
My first step in determining the best stocks to buy now, is to have a look at the high level, bird’s eye view, picture. I’ve grabbed a screen print of the NASDAQ’s daily timeframe chart, using my favourite software tool, Trading View:
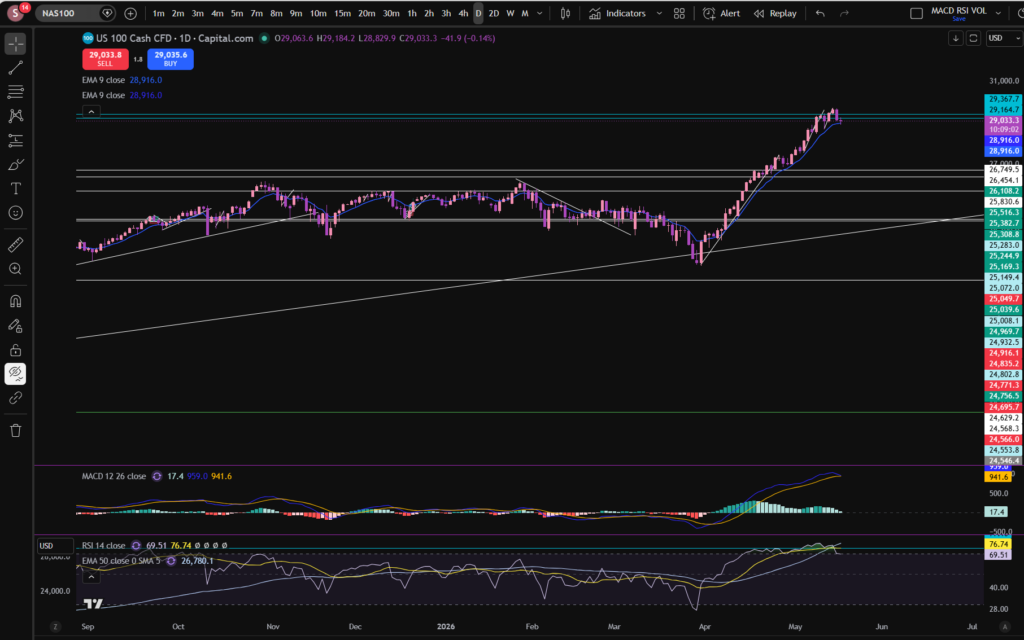
OK, as you can see, per the daily timeframe, the MACD indicator’s histogram, looks like it’s shrinking in size, and it’s turned to a very pale green colour. This means the price is losing momentum in the upwards push. If we consider the RSI indicator, the level has pulled back quite a bit from where it was – it’s currently sitting at 69.51 but it had reached a level which has acted as an RSI resistance, previously, at around 77.5 – you can see this level marked in a turquoise colour on the RSI indicator. I added this mark last week when analysing the markets – and it was my suggestion that when it reaches this level, the history is that it has typically pulled back from there. This suggestion is now playing out on the chart – as you can see above. It is important to get a good bird’s eye view, in this way, when considering the best stocks to buy now.
The turquoise lines at the top of the chart marked very close together, were some resistance and support levels I had marked on the chart last week on the 30 minute timeframe. Let’s zoom in and see what’s happening more closely…
NASDAQ 30 minute timeframe
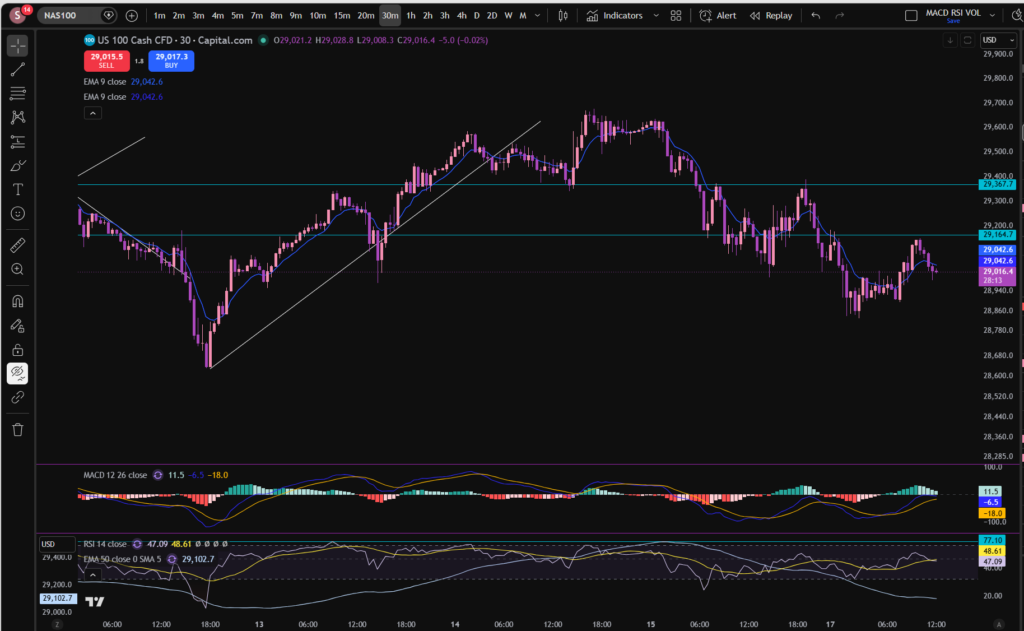
As you can see, from around the 15th of May, the market has been strongly pulling back per the 30 minute timeframe. The price broke a diagonal support level which had formed and this became the resistance, here:
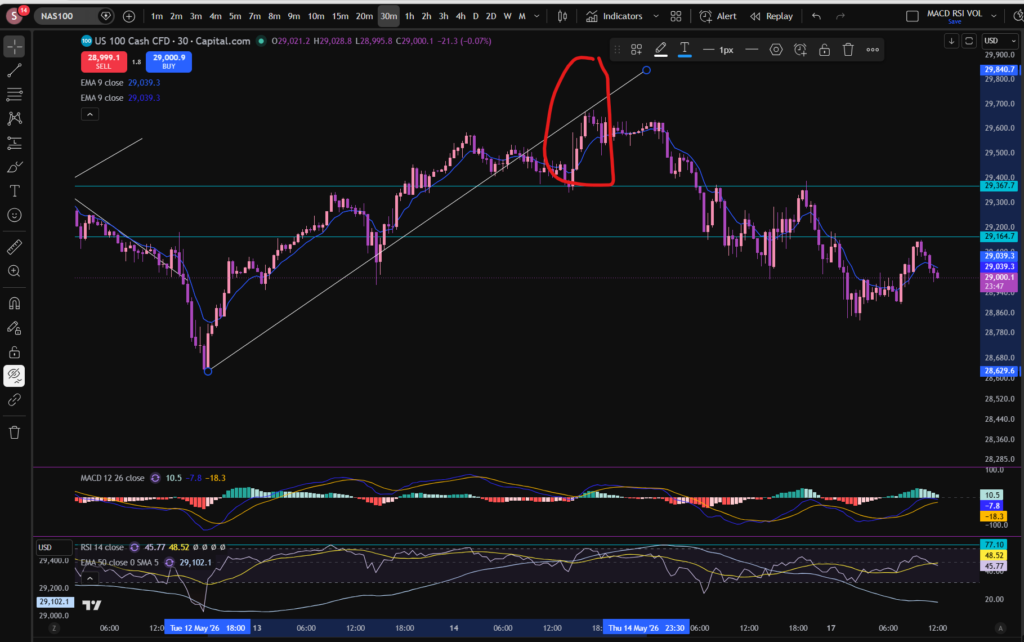
Now the price is descending. It looks like the momentum is still strong because even on this 30 minute timeframe, the MACD is just about to cross over to the downside, over the signal line – the histogram is about to turn red. It remains to be seen how long the pull back will go on for. On the daily timeframe, the RSI is now at a level which has previously acted as a support but we will need to see whether it starts to recover or comes down a bit more.
The final timeframe I want to consider, is the monthly timeframe:
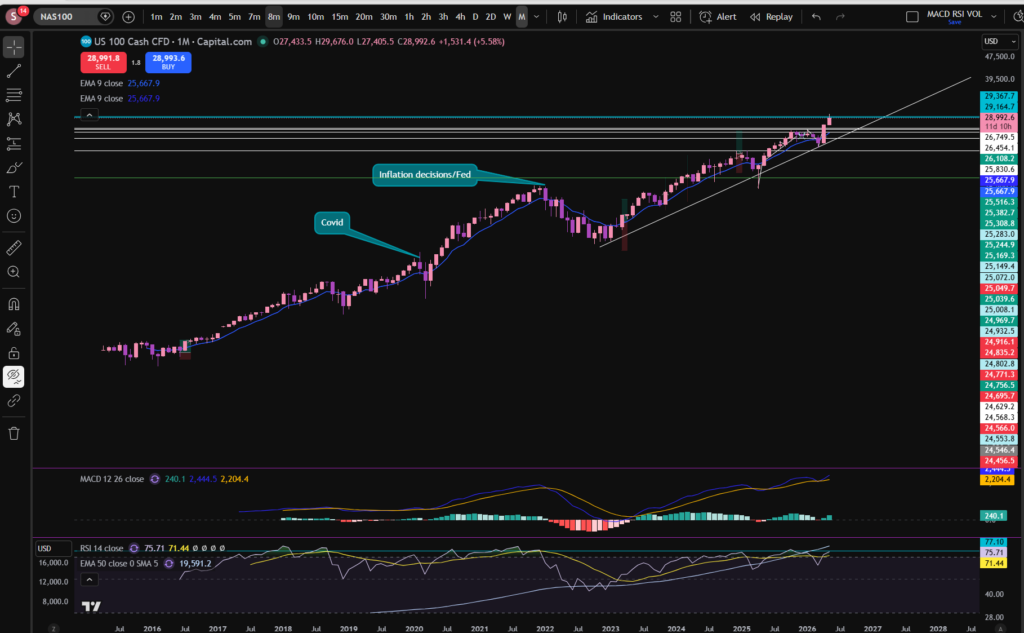
I mentioned last week that the price had recently bounced from a long term diagonal support. The MACD histogram here, is dark green and growing although the RSI is still quite high.
When considering best stocks to buy now, I consider these charts very carefully to determine which direction the markets might be headed in, in the short term. Nobody can know the answer for sure, but what would I be wanting to see, before jumping into any trades? I want to see the 30 minute timeframe recovering – making higher highs and higher lows. It is not in this position, currently. Note that any future patterns will form on the lower timeframes first – the smaller timeframes are like a glimpse into the potential future…
Given what’s happening on the NASDAQ and that this in turn actually heavily influences the performance of its constituents and those of the S&P 500, I will be patiently waiting for now. I know this is not what some traders want to hear, especially when they are new to trading. However, one of the biggest lessons you must learn in trading, is when to exercise some restraint. Obviously, what I say here, is relevant to my own personal style of trading – I do not short the markets. I only buy into them.
I hope you found this article helpful on the best stocks to buy now!
Disclaimer!
Nothing on this blog should be taken as financial advice or encouragement for you to enter a trade. You are expected to speak to a financial adviser or carry out your own due diligence before entering any positions. Everything on this blog is made for educational purposes and to equip you with the knowledge you need to be able to make your own financial decisions.
For more great tips and advice on trading the stock market, please visit:
https://www.sophiatrades.co.uk
To watch me trade live please visit my patreon page here:
https://www.patreon.com/sophiatrades
Finally, if you would like to receive a discount on the Trading View charting software I use, please click on the relevant link here:
https://www.tradingview.com/?aff_id=117138
Please note any subscriptions taken via my affiliate link with Trading View may result in me earning a small commission. However, I provide complete transparency on me using Trading View personally – I publish my success on the financial markets via my broker reports and any profits earned were done so by using my own Trading View subscription, so I genuinely do recommend them and have been using the Trading View charts for many years.