In this article i’m going to consider stocks today by examining what’s been happening on the NASDAQ. As always any chart analysis which is performed is to help you understand how to make your own decisions about where you think the markets might go next. Let’s get straight into it!
Stocks today – NASDAQ
One of the first things I look at when considering stocks today, is I check what’s happening on the birds eye view of the NASDAQ daily timeframe:
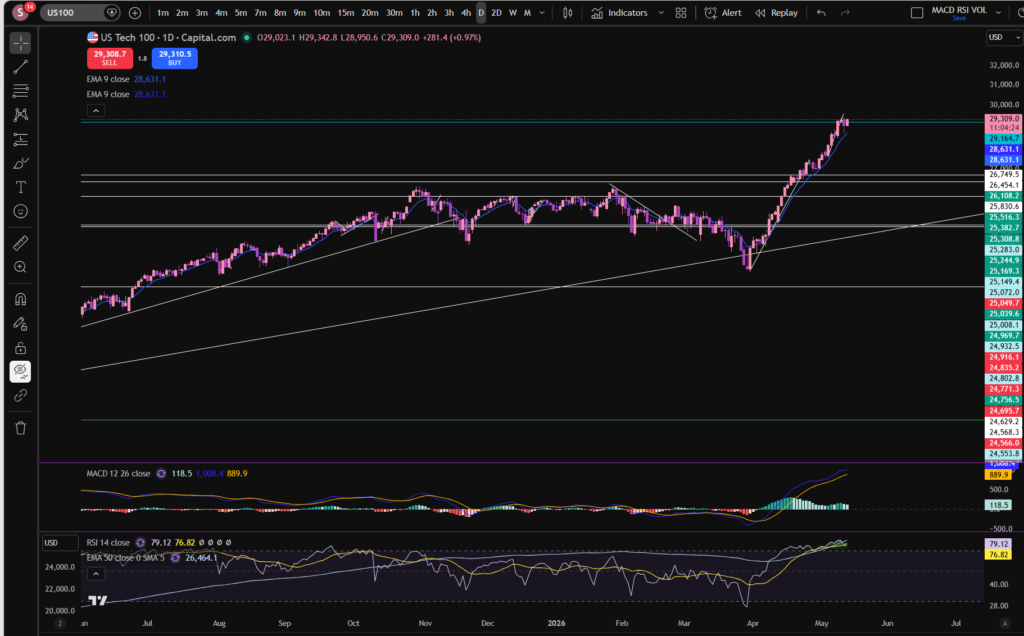
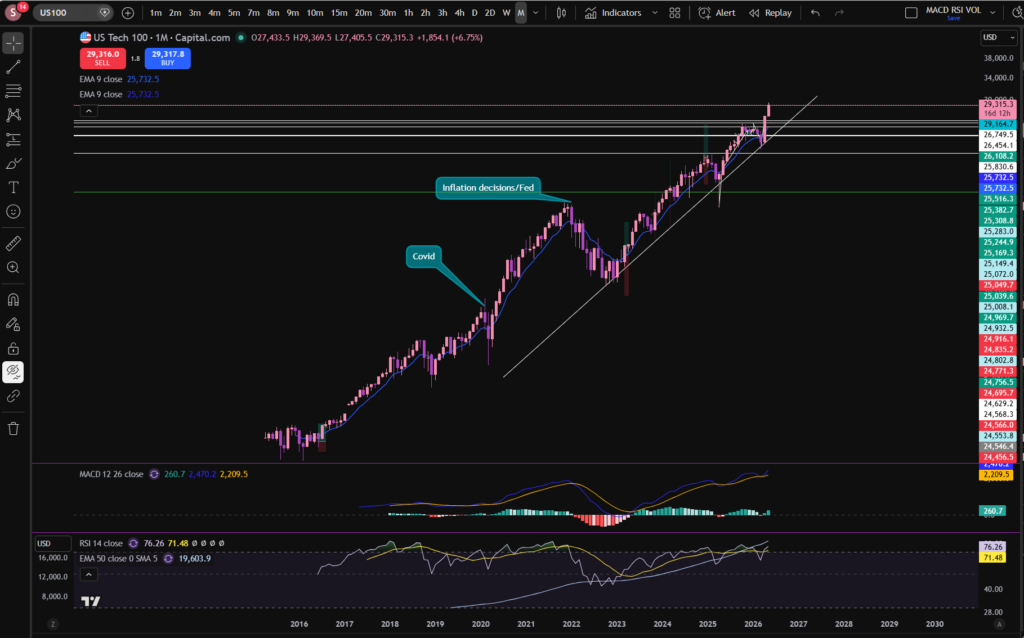
As you can see, the NASDAQ index, pushed away from a major diagonal support line in around April. The price has been pushing up strongly since then, but we did experience a little pull back in the last week or so. It’s good when looking at stocks today, to consider the ‘even bigger’ picture, by considering the monthly timeframe, so you can get the diagonal trendline into perspective:
I’ve left a link to a discount to the Trading View chart software I use, above – this is a great tool to help you on your trading journey. I use this software every single day, to analyse stocks today.
It’s good as a technical analysis trader, to switch between different time frames to either zoom in, or out. I have published a separate blog article on this, to help you to understand it in detail. Please see the link below:
OK, so back to our analysis! As you can see from the above monthly timeframe chart, the price of the NASDAQ has been bouncing, steadily against the diagonal trend line which I marked on the chart, for a long time – this dates back to 2022! Even before that, another trend line can be seen just from looking at the chart, dating back to 2016! This was when it then ended with a large pull back due to the FED’s decisions to increase the interest rates in the US.
OK, so with all that in mind, you can see that the price has quite recently pushed away from this trend line once again. The RSI is showing as quite high on the monthly timeframe. It looks like the usual pattern of it pushing away from this trend line is that it goes for quite a while, but there are minor ‘price corrections’ along the way where it pulls back to breath. The price did pull back slightly last week on the 30 minute timeframe. Notwithstanding this, the RSI is still quite high on the monthly timeframe. Does it need a bit more of a pull back? The answer to this question, remains to be seen. Let’s take a look at the 30 minute timeframe, to zoom in:
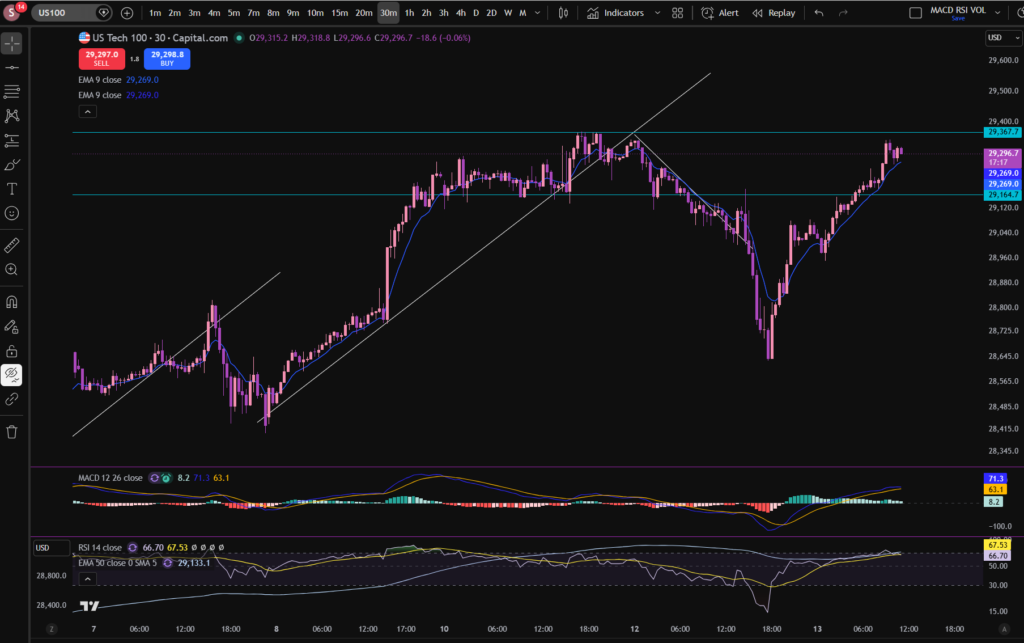
As you can see, we saw a huge gouge down from the point of view of the 30 minute timeframe. However, the price has since pushed up again, strongly. At the current moment, the price has almost recovered to where it was originally, but the RSI on the monthly timeframe is still very high. Let’s consider what typically happens in this scenario on the monthly timeframe:
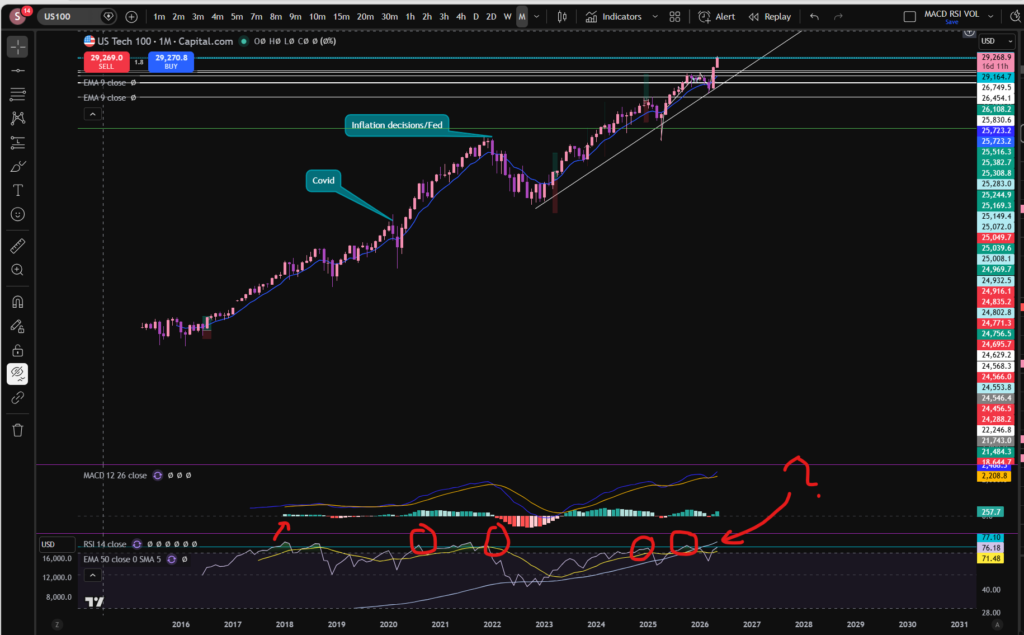
This is what I love about Trading View. I’ve drawn a line, on the RSI indicator where the price touches and rebounds most of the time. You can see for yourself what typically happens. Now look at where it sits currently? There are some instances where it pushed beyond this line but those do not happen regularly.
So what will happen next? I can’t tell you the answer to this, but perhaps my analysis can help you to decide for yourself?
The idea of this analysis is to set you up to be able to identify patterns yourself in the previous price movements and these patterns can help you to identify best places to trade.
I hope you found this article helpful!
Disclaimer!
Nothing on this blog should be taken as financial advice or encouragement for you to enter a trade. You are expected to speak to a financial adviser or carry out your own due diligence before entering any positions. Everything on this blog is made for educational purposes and to equip you with the knowledge you need to be able to make your own financial decisions.
For more great tips and advice on trading the stock market, please visit:
https://www.sophiatrades.co.uk
To watch me trade live please visit my patreon page here:
https://www.patreon.com/sophiatrades
Finally, if you would like to receive a discount on the Trading View charting software I use, please click on the relevant link here:
https://www.tradingview.com/?aff_id=117138
Please note any subscriptions taken via my affiliate link with Trading View may result in me earning a small commission. However, I provide complete transparency on me using Trading View personally – I publish my success on the financial markets via my broker reports and any profits earned were done so by using my own Trading View subscription, so I genuinely do recommend them and have been using the Trading View charts for many years.