In this article i’m going to talk about how to use technical indicators. I will share how you can tailor some of the key indicators in Trading View. Trading View is a trading platform which is fully customisable. The paramaters and settings for the technical indicators you are likely to be using, are fully adjustable. I use Trading View for my own trading, and I feel strongly that it’s an asset to my trading and success in the financial markets. I hope you find this article helpful.
How to use technical indicators – Changing the technical settings
Let’s just jump right into how to use technical indicators in Trading View. With almost all technical indicators in Trading View, we can change the technical settings. Let’s consider the MACD (Moving Average Convergence Divergence) indicator, first.
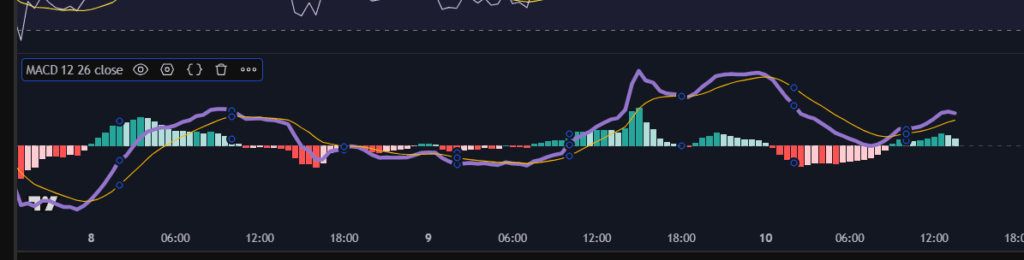
I selected the MACD line by left clicking until I could see the little circles (in blue below). This meant I had selected the indicator.
Next, click on the little hexagon shape with the circle in the middle, shown here with a red arrow:
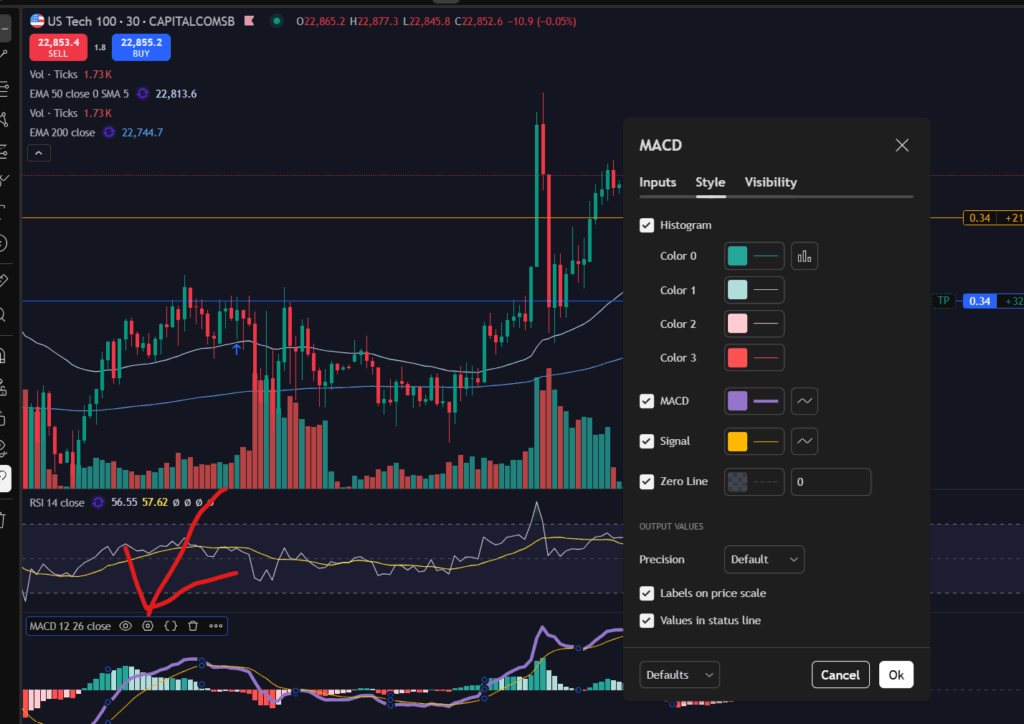
Once you click on this, the options menu for the MACD indicator will appear as shown above. You can change the ‘technical settings’ of this indicator by clicking on the ‘Inputs’ tab of this pop up menu:
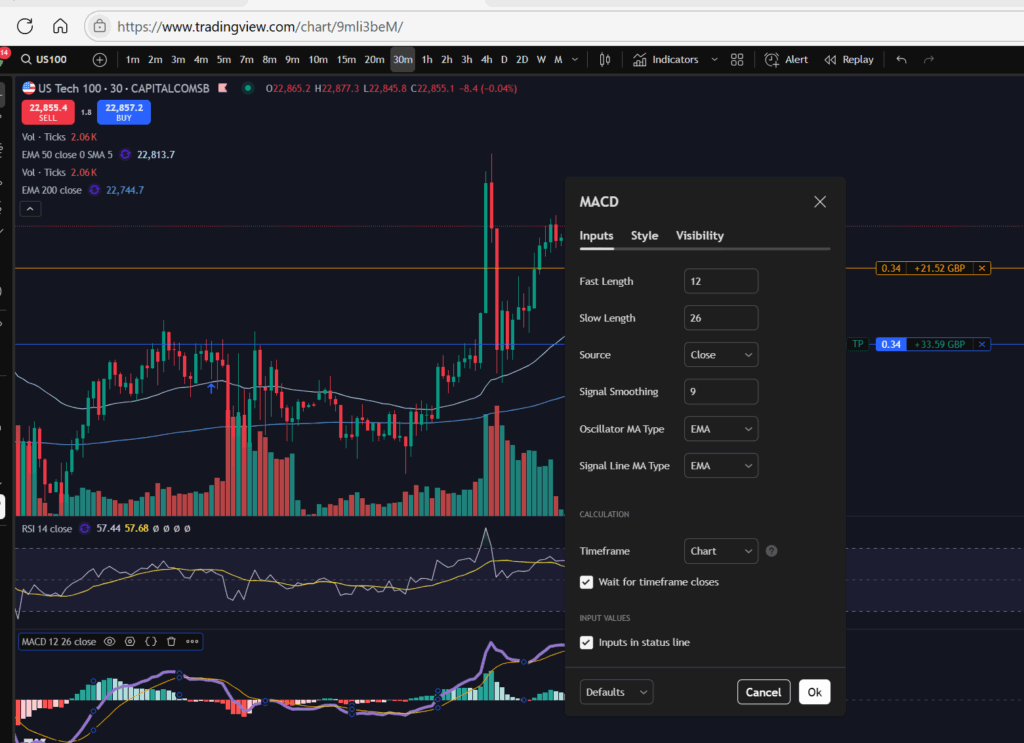
The settings are set to the ‘defaults’ as shown above, but you can change the length of the periods which control the MACD and signal lines using the input boxes above.
As you probably noticed from the earlier screen shot, you can also change the colours of the MCAD indicator. I like to use Dark Mode on Trading View, so I find it helpful to have a thick mauve line for the MACD indicator as I can see this more easily when using dark mode, especially as it crosses the histogram. If left to the default settings, it can be difficult to see the lines against a light histogram bar background. By the way, the histogram colours can also be changed by changing the drop downs boxes on the ‘Style’ tab of this pop up menu, too:
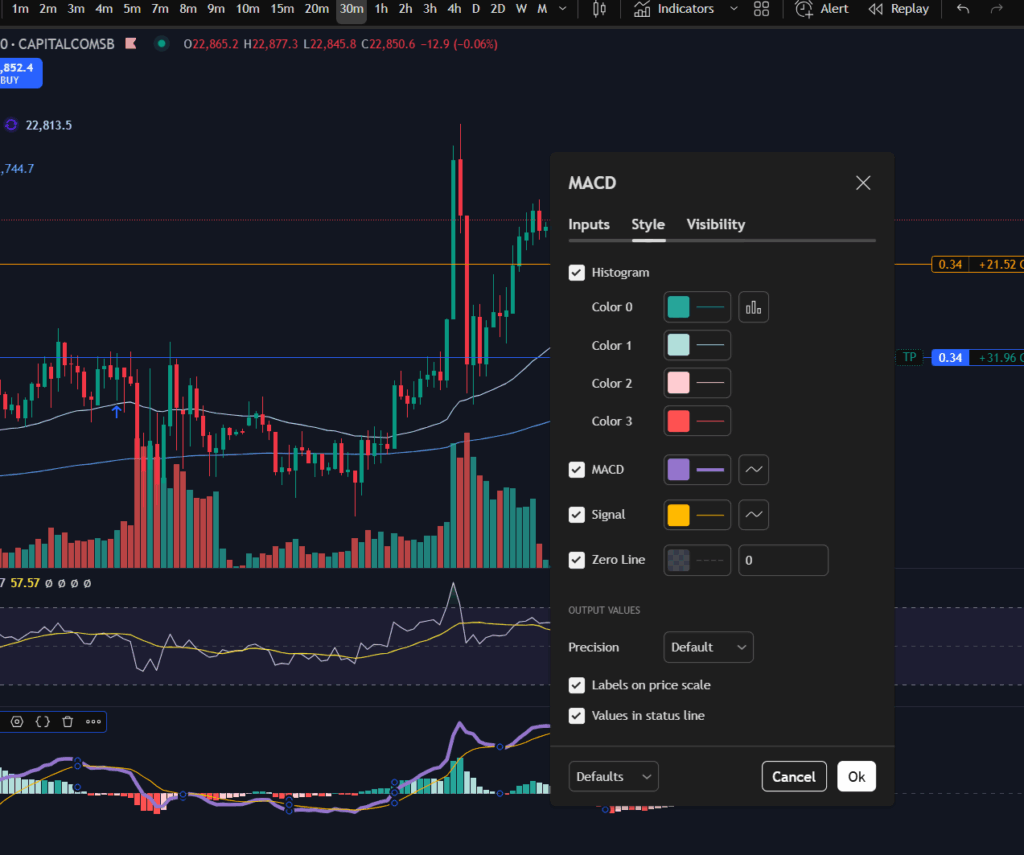
Once you are happy with your changes, press ‘OK’ on the menu, and the changes will be applied to your chart.
EMA lines
Let’s just look briefly at the EMA lines too. The period over which the average calculation is calculated can be changed in the same way as I described with the MACD indicator – click on the indicator once, to select it. Once you see the blue circles appear, click on the settings again:
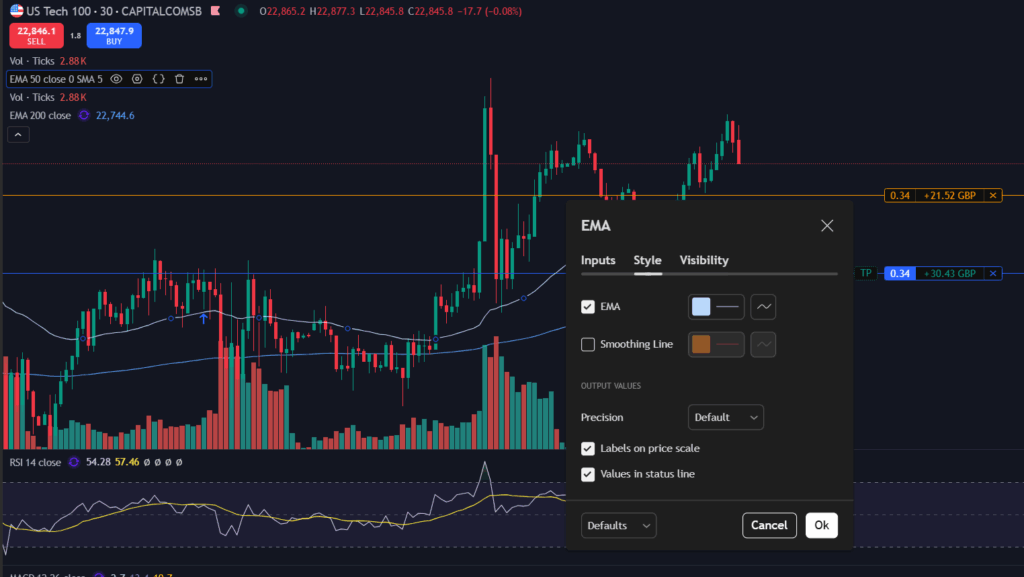
Once again, the technical inputs are on the ‘Inputs’ tab of the pop up menu:
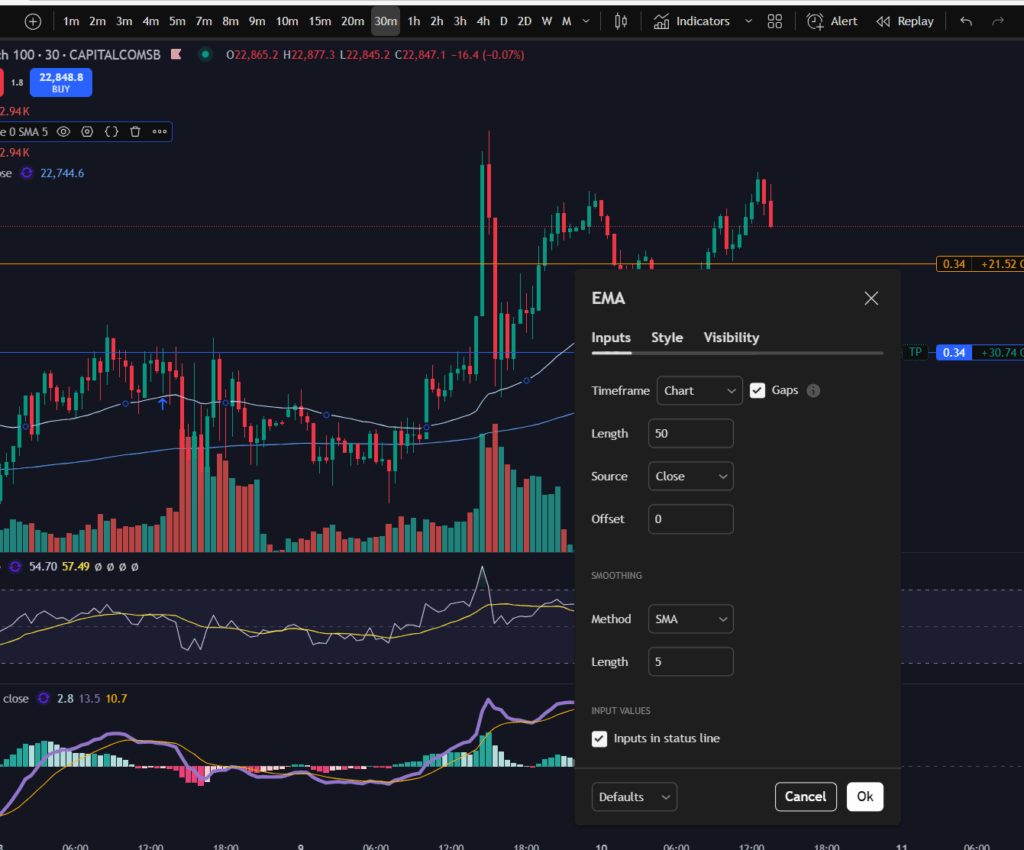
You can also change the colour and thickness of the EMA lines.
I hope you found this article helpful. If you would like to see the corresponding video on YouTube, please click on the link below:
For more great tips and advice on trading the stock market, please visit:
To watch me trade live please visit my patreon page here:
https://www.patreon.com/Traderpro8320
Finally, if you would like to receive a discount on the Trading View charting software I use, please click on the relevant link here:
https://www.tradingview.com/?aff_id=117138
Please note any subscriptions taken via my affiliate link with Trading View may result in me earning a small commission. However, I provide complete transparency on me using Trading View personally – I publish my success on the financial markets via my broker reports and any profits earned were done so by using my own Trading View subscription, so I genuinely do recommend them and have been using the Trading View charts for many years.