You may have heard it’s a good thing to buy stocks, to invest in stocks, etc, but you may be new to the financial markets completely and you may be wondering what they are. Perhaps you are someone who has worked your whole life in a manual job and you have never had any dealings with the financial markets or business. Perhaps you have been a stay at home mum and you now want to understand how to look after your wealth and your finances for yourself? You have come to the right place. Let me help you understand, what are stocks…
What are stocks? The basics
In a nutshell, a stock is a share of a company. When answering the question, what are stocks, you should think of the answer like a literal slice of pie:
The pie – the whole pie, is a company/business and buy purchasing a ‘share’ you will literally own a fraction of the business. Stocks have particular ‘control’ rights when it comes to running the business. Since you would partly own the business by owning a share, you would have the right to control what goes on in the business. This is handled by shareholder meeting and votes. Note that some shares do not attract voting or control rights. You need to pay attention to the ‘class’ of shares which you are buying and what rights are attached to them. When answering the question what are stocks, therefore, we must note that different stocks have different benefits and rights attached to them.
What other benefits come from owing a stock?
Since you own a part of a business when you purchase a stock, you are also entitled to receive income from the business (insofar as its profitable). You may receive income as ‘dividends’, or you can wait for your stock to accumulate in capital value. Over time, the business will ‘hopefully’ grow, and this will mean that your share will be worth more, later. What do we mean by ‘grow’? The business will be striving to make profit and that profit can be reinvested into new technologies, so that the business can sell more product. Note that if a company distributes a lot of its profits by way of dividends, then you are likely to get less capital growth in that particular shareholding. You can buy stocks which are good for capital growth (i.e. the directors typically decide to reinvest the profits into making the business grow and become more profitable), or you can buy stocks where the directors are usually paying a good chunk of the profits earned, out to shareholders in the form of dividends. You can tailor your stock portfolio to hold some of each!
I would like to refer you to my other article on dividends and how these can affect the share price of a company, which you may find helpful:
I hope this article helped you to understand the answer to the question, ‘what is a stock?’.
Disclaimer!
Nothing on this blog should be taken as financial advice or encouragement for you to enter a trade. You are expected to speak to a financial adviser or carry out your own due diligence before entering any positions. Everything on this blog is made for educational purposes and to equip you with the knowledge you need to be able to make your own financial decisions.
For more great tips and advice on trading the stock market, please visit:
Please note any subscriptions taken via my affiliate link with Trading View may result in me earning a small commission. However, I provide complete transparency on me using Trading View personally – I publish my success on the financial markets via my broker reports and any profits earned were done so by using my own Trading View subscription, so I genuinely do recommend them and have been using the Trading View charts for many years.
What is scalping in trading? This is a common question asked by beginner traders so I hope I can help you out with an understanding….Scalping is a very specific style of trading. In order to understand what it is, you need to know how it contrasts with the other styles… Let me explain!
What is Scalping in Trading? – Background
So just to give some background, there are many different types of traders, and what distinguishes you as a trader, from an investor to begin with, is that you hold positions for shorter periods of time and selling them on quickly. Within the sphere of trading, however, there are different styles again – and some of these styles can be categorised based on how long the position is held open as with trading versus investing. There are ‘swing’ traders who typically hold positions overnight or for a few days, and there are day traders who are in and out of trades within the same day. Then there are scalpers…
So what is Scalping in Trading?
A scalper trader jumps in and out of the markets many times over, within the space of just minutes. They execute many trades over the course of a day, accumulating profits slowly in small increments. I hope you are starting to understand the answer to the question, what is scalping in trading.
Positions are typically held for a few seconds to a few minutes. Traders who trade in this way, tend to focus on markets with high liquidity, so that they can enter and exit position easily. (If there are many buyers and sellers it helps them get in and out multiple times). They trade the smaller timeframe charts.
What scalping strategies are available?
There are many scalping strategies available to follow and many higher time frame strategies can be used on the smaller timeframes too. You can find a lot of traders on YouTube sharing their scalping strategies with you. My advice would be to test one with very small risks at first (risk only, say, £1 per trade) until you know it works, as there are many traders on YouTube who are misinforming people.
Is Scalping better than Swing trading?
This is a very difficult question to answer, because it depends on what you need and want from your trading. You may say, well, just money! However, the other details can be important for some traders. For example, I am a female trader, and the aim of this blog is especially to encourage other women to have the confidence and knowledge on how to trade the stock market. If a woman has small children, it may not be a suitable strategy for her to employ, as she will have many distractions and scalping may require high levels of concentration over a period of time. Unless of course she has childcare or periods where the kids are with Granny, hubby etc. This is in contrast to swing trading, where the trader can probably set a stop loss and target, and walk away for several hours or days.
Some traders are also more comfortable with deciding slowly and carefully, what the plan is, and executing it – and placing orders to safeguard it, whereas other traders may prefer to make decisions quickly in the moment! For some traders, the speed at which you need to make decisions as a scalper, will terrify them. It probably depends heavily on your preference for handling other things in life – do you like working under extreme pressure, or do you like to go carefully and slowly, and take your time? Only you can answer this.
What types of indicators are common in a scalping strategy?
Scalping traders commonly use indicators like the moving averages, the RSI, the MACD, and bolinger bands as indicators on where to get in and out of the markets. I personally use the MACD indicator a lot, and I know it can be used on the smaller timeframes, but it must be applied with discipline when the ‘direction’ of the market, is clear. I am not a scalper, however.
If you would like to understand more about the MACD indicator and some of the other ones I’ve mentioned, you can refer to the technical indicators section of this blog:
I hope you found this article helpful in understanding the answer to the question, what is scalping in trading.
Disclaimer!
Nothing on this blog should be taken as financial advice or encouragement for you to enter a trade. You are expected to speak to a financial adviser or carry out your own due diligence before entering any positions. Everything on this blog is made for educational purposes and to equip you with the knowledge you need to be able to make your own financial decisions.
For more great tips and advice on trading the stock market, please visit:
Please note any subscriptions taken via my affiliate link with Trading View may result in me earning a small commission. However, I provide complete transparency on me using Trading View personally – I publish my success on the financial markets via my broker reports and any profits earned were done so by using my own Trading View subscription, so I genuinely do recommend them and have been using the Trading View charts for many years.
In this article i’m going to explain everything you need to know about how to start trading. I will explain to you how to build a plan, understand the markets and this blog contains a lot of free information about the different tools you can use to help you in your trading. Let’s get started!
How to start trading – the best place to start!
The best place to start in understanding how to start trading, is to ensure you have a broad understanding of the financial markets, and how they work. To get you started with this, i’ve linked below a video I posted for beginner traders, explaining how the markets work and how to read a stock chart:
OK, so now that you understand how markets work and how to read the charts, the next step in understanding how to start trading, is that you must also put together a trading plan. The trading plan article i’ve linked below, is based on ‘technical analysis’ but you may wish to be a trader who focuses on fundamental analysis. I’ve linked below another article examining the difference between these methods of trading:
I’m now going to share with you, my key article on how to create a trading plan, but you can tailor this to include parameters based on ‘fundamental analysis’ instead of ‘technical analysis’ in order to suit your preferences. Here is the key article I published, on how to create a trading plan:
In the trading plan article, I outline they key steps to help you create and execute a trading plan, including risk management, a trading strategy (this is where you decide what method will determine how you will decide to enter each trade), and risk to reward ratio.
Risk management is an extremely important topic and you must understand this and how to use leverage and a margin account, before you commence trading so in light of this, I also recommend you read the articles on this section of the blog:
Once you have understood the basics about how the markets work, and you now understand how to create a trading plan and manage it with proper risk management, and you understand how to avoid getting a margin call, you will be in a good place to start trading. You can also see the key technical indicators I recommend, on this blog, by reviewing my ‘chart analysis’ page. This shows you a real trader applying technical analysis to the charts and the idea of this section of the blog is to show you how you can apply this analysis in exercising your own due diligence before entering trades, and build this type of technical knowledge into your own trading plan, and journey.
I would like to wish you the best of luck on your trading journey!
I hope you found this article helpful.
Disclaimer!
Nothing on this blog should be taken as financial advice or encouragement for you to enter a trade. You are expected to speak to a financial adviser or carry out your own due diligence before entering any positions. Everything on this blog is made for educational purposes and to equip you with the knowledge you need to be able to make your own financial decisions.
For more great tips and advice on trading the stock market, please visit:
Please note any subscriptions taken via my affiliate link with Trading View may result in me earning a small commission. However, I provide complete transparency on me using Trading View personally – I publish my success on the financial markets via my broker reports and any profits earned were done so by using my own Trading View subscription, so I genuinely do recommend them and have been using the Trading View charts for many years.
I want to help beginner traders understand and answer the question, ‘what is trading’. I’m going to explain what trading is in this article, the difference between trading and investing, what types of returns you should expect from trading and how you can get started. Let’s get straight into it.
What is trading? Some basics…
Trading is the buying and selling of equities (shares), commodities, metals, contracts or other types of assets on an exchange. For every buyer, there is a corresponding seller and these buy and sell actions, drive the price and volume in any market. The idea with trading, is that you buy and sell at favorable points on a chart (or based on fundamental data), and the buy and sell happens more quickly typically, when compared to what an investor does. An investor typically buys assets over and over and holds them until they increase in value by a large amount, over a long period of time. Traders can be day traders – people who get in and out of trades within one day, or swing traders – where trades can span over the course of a couple of days or more. I’ve provided a link below to help you understand ‘fundamentals’. Fundamental analysis is the method of inspecting financial statements to try and ascertain the value of a share with a view to buying it low and selling it high!
I am also providing you with a link to a structured course which can help you understand how traders decide where to buy or sell based on ‘technical analysis’. Technical analysis is purely based on the patterns forming on a chart (which stem from events and real world scenarios – the patterns can form based on what real people think a share is worth for example):
What types of returns can you make from trading the stock market?
Traders can make 100% return on their capital, in a year. The reality is that different traders make different amounts – but if you are trading, rather than investing, you definitely want to be making more than a regular investment return. You are taking more risk than what you take with investing money in a more straight forward way as an investor, so risk normally goes hand in hand with return (or it should).
So how do these transactions take place?
We cannot answer the question ‘what is trading’ without considering how these transactions come about. Most transactions take place online these days. You can open a broker account to either buy shares and own the shares or you can open a position based on the movement in the price and enter into a ‘contract for difference’. This is where you enter into a contract with the other party, to agree that if the price goes the way you think it will, the other party will pay you xzy amount of money and vice versa. If the price goes against you, you will need to pay them. The other way of trading is via a ‘spread betting’ account. This is like placing a bet on the price movements of the underlying asset and for most intents and purposes, it is treated and seen, as gambling. There are different tax implications for these three different methods of trading, and broker accounts can be opened online to go with any method you believe is right for you.
What else do you need to know when understanding the answer to the question, ‘what is trading’
Some of the types of broker accounts which can be opened (contracts for difference (“CFD”) accounts, and spread betting accounts) include leverage. Leverage is a loan which is offered by the broker to allow you to get into a larger position size than you may otherwise have been able to do. You put a deposit down on the open position, and these accounts are dangerous for a new trader because you can lose more than you put into your account! You should not trade with a margin/leverage account until you have a good understanding of this and how leverage and margin work. There are other articles on this blog explaining how you can manage your risk as a trader, which you may find helpful, as well as explaining margin and leverage:
I also published a video on YouTube which you may find helpful, on understanding how you can manage risk as a stock market trader:
I’ve also posted a video on YouTube explaining what margin is:
This introductory video on understanding the stock market, may be helpful for people who are new to the markets:
So now you understand the answer to the question, ‘what is trading’, how can you get started?
The best place to start would be by viewing my ‘Structured Course’ playlist on YouTube – which gives you some of the key lessons on how to become a stock market trader (below), and also refer to my blog article here, on how to create a trading plan:
I also recommend you browse the other ‘structured course’ articles on this blog which take you through technical indicators, risk management, understanding the spread and many other things, here:
I hope you found this article on ‘what is trading’ helpful. Perhaps if you did, you can leave a comment below.
Disclaimer!
Nothing on this blog should be taken as financial advice or encouragement for you to enter a trade. You are expected to speak to a financial adviser or carry out your own due diligence before entering any positions. Everything on this blog is made for educational purposes and to equip you with the knowledge you need to be able to make your own financial decisions.
For more great tips and advice on trading the stock market, please visit:
Please note any subscriptions taken via my affiliate link with Trading View may result in me earning a small commission. However, I provide complete transparency on me using Trading View personally – I publish my success on the financial markets via my broker reports and any profits earned were done so by using my own Trading View subscription, so I genuinely do recommend them and have been using the Trading View charts for many years.
In this article i’m going to talk about how you can avoid pitfalls in trading with young children around you as a woman, when trading the stock market. I’m going to talk about practical tips you can apply in your trading right now, to avoid some of the things which can go wrong and cause stress. Let’s get straight into it!
First of all, let’s talk about what can go wrong in trading with young children around you
Wow – where do I begin? Here are a few examples:
Example 1 – You miss your target: you are in a trade and it’s going to go up to your target area, so you are keeping a bit of an eye on it while your toddler is eating their lunch. Sometimes trading with young children around you is unavoidable depending on the needs of the child and what’s happening with your trade set up and the market. Toddler drops lunch on the floor (along with the beaker, the rattle, the baby wipe and anything else within reach which has ended up on the floor in the preceding ten minutes). Crying ensues, stress in mommy ensues – “what am I going to feed them now – i’ve just made that lunch and it’s gone”. Trade goes near the target but mommy is focused on clearing up the spaghetti on the floor. Trade failed – it went back down to below target level and then into loss position by the time mommy realised what’s happened.
Example 2 – You forget to add a stop loss: You’re baby is asleep while you are planning and trying to execute your trade set up and entry point. You enter a buy position and just before you can set your take profit and stop loss, baby wakes up and is screaming for milk – it needs it NOW. You rush over to bubba to console them while you try and get a bottle ready and in the meantime, you have forgotten about adding your stop loss. Trade goes against you while you are heating up the baby’s milk and you end up in the red, to a level which is two times the size of the loss which would have happened, had you set your stop.
These are two examples of a multitude of things which could happen while you are keeping an eye on trades, while simultaneously looking after your baby or toddler. If you are a man or non caregiver of young children, I do not expect you to understand this. This is something which mothers contend with every day – it maybe that they are trying to do something else besides trade, quickly before their baby wakes up – there are many things which a woman could need to deal with while looking after small children, and the children are not interested in anyone else’s schedule, but their own. This is the biological reason why women ended up better at multi tasking.
OK, so we know these things can go wrong. What can you do about it as a trader to protect your account and your confidence?
The first recommendation I can make is for you to trade higher timeframes. The timeframes which should be avoided are the 5, 10, 15 minute time frames. Maybe even the 30 minute time frame. Why? The higher the timeframe you use, the more time you will have to execute your entries and exits and plan your trades. The price moves more slowly on the higher timeframe. It will give you time to sort your baby out, give him/her a bottle, adjust your target or add one automatically.
Another suggestion is to do your research at times when you know baby will be sleeping – the tasks which could have an interruption and not go wrong – like choosing which market to enter from the really high time frames like the daily, the weekly, and you can do this while your baby is sleeping in the evening but tend to him/her if he/she wakes up.
My recommendation would be to not trade without a stop loss or take profit being automatically set on your trades. You can do some analysis of what actually happened with the price movements (whether you made an error, why it went down instead of going up as you had planned etc) at a convenient time, as long as your position is automatically protected from going wrong.
I hope you found this article helpful in deciding how you can avoid pitfalls when trading with young children around you. I also published a video on my YouTube channel, on avoiding pitfalls when trading with young children- which you may find helpful:
Disclaimer!
Nothing on this blog should be taken as financial advice or encouragement for you to enter a trade. You are expected to speak to a financial adviser or carry out your own due diligence before entering any positions. Everything on this blog is made for educational purposes and to equip you with the knowledge you need to be able to make your own financial decisions.
For more great tips and advice on trading the stock market, please visit:
Please note any subscriptions taken via my affiliate link with Trading View may result in me earning a small commission. However, I provide complete transparency on me using Trading View personally – I publish my success on the financial markets via my broker reports and any profits earned were done so by using my own Trading View subscription, so I genuinely do recommend them and have been using the Trading View charts for many years.
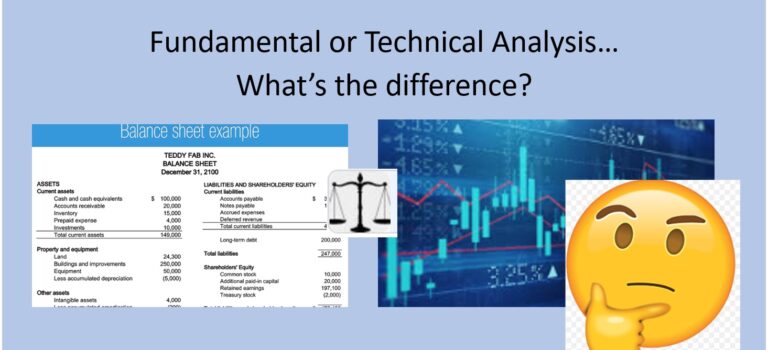
In this article i’m going to talk about the key differences between fundamental and technical analysis. Should you use fundamental or technical analysis in your trading? Which one is more profitable? Let’s find out…
Fundamental or technical analysis – what is fundamental analysis?
In a nutshell, traders who perform fundamental analysis look at the ‘fundamentals’ behind a company – they consider the company’s balance sheet and financial statements. The consider directors’ reports and any other information they can get hold of about the company, in order to predict future price movements. This might include using key ratios on the company’s balance sheet, to assess the company’s health or liquidity. The ratios used are not covered in this article. I just want to explain to you what the difference is between these two different approaches to analysing the markets and making trading and investment decisions. Some of the ratios can be used to determine a ‘value’ for a company and therefore, by dividing this value by the number of shares issued, you could derive an estimate of what the company should be priced at in terms of share price, and then see if you can see a discount to this as a purchase opportunity. Such ratios include the company’s P/E ratio. These types of ratios give an idea of how much the company can earn vs the amount of investment you would need to put down to purchase the shares.
It is my intention to post another article explaining some of the key balance sheet ratios and how you can use these to assess the health of a company. Watch out for this.
Fundamental or Technical analysis – what is technical analysis?
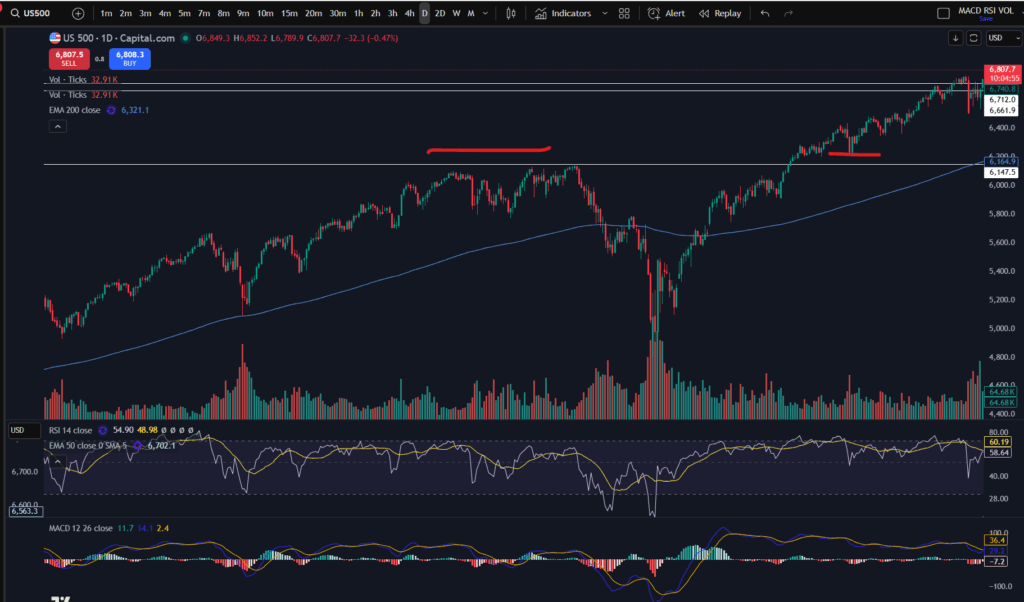
Technical analysis does not rely on the financial statements directly and other documents and information. Technical analysis is performed by analysing patterns on the stock charts. The stock charts can give indications of places where there is strong buying or selling pressure by noting patterns of price rejection at these levels. These can be used to predict future price movements. If you would like to understand more about technical analysis, there are plenty of articles on this blog to help you get started. Let’s look at an example of some areas where this price action can be noted:
Note on the above chart how the price met some resistance at around 6,164.9 – where I have applied a horizontal support/resistance line in white to the chart. The price bumped on this level a few times and then sailed down very low – what this tells me, as a technical analysis trader, is that the price met a lot of selling pressure at that point. The highs could not be sustained – the buyers became depleted in the market – they did not believe the price was worth more than this level, at that time. This lack of buyers affected the volume of transactions in relation to people ‘buying’ which in turn drove the price down further.
Note that once a price becomes a resistance area, it can, subsequently become a support – note how after the price went past this level some time later, it dipped back down to ‘test’ the level – where I have marked the chart in red, before ascending further up. These patterns are common and can be seen in every stock chart across the markets. So the volume, and demand, which I can see on the chart, tells me a lot about how the share should be priced – it’s almost real time information as opposed to looking at the fundamentals.
So how does one method compare to the other?
Note that I stated technical analysis does not rely ‘directly’ on the fundamental analysis/documentation. However, the price which plays out as patterns on a stock chart, is ‘driven by’ the company’s fundamentals. As a technical analysis trader, I do not perceive these two methods as distinct – I understand that the price patterns I use on the chart, are driven by the fundamentals. I am a qualified chartered accountant by vocation, so although it would be very easy for me to check a company’s fundamentals, I personally, feel that the charts tell me everything I need to know. Therefore, the question of fundamental or technical analysis and which one is better or more profitable, is a bit of a misnomer.
I do keep aware of general major news in the markets and how this may affect what I would like to trade – for example, Trump’s tweets on tariffs and how these have been affecting Apple. However, in the most part, I rely on the technical analysis to give me an idea of when to invest or trade, where to invest or trade and most importantly, when not to!!
One of these methods is not necessarily going to make you more money than the other – it is best for you to become a ‘master’ of what you are doing, and develop skill in either one – this will help you best to make more profit.
I hope you found this helpful in terms of understanding fundamental or technical analysis.
I also published a video on YouTube which you may find helpful:
https://youtu.be/5nnCg5CfOMw
Understand my strategy in full: https://www.patreon.com/Traderpro8320
For more great tips on trading the financial markets, please visit my blog:
In this article I will share with you what a trading plan is, and give you examples of what this might look like. I will also explain to you how to create your own trading plan. I hope you find this useful.
What is a Trading Plan?
A trading plan is a plan of how to make money from the financial markets by trading – sounds obvious! There are a few components to this (which complement/feed into each other), as follows:
Risk management
A trading strategy
Risk to reward ratio
I discuss each of these aspects of the overall trading plan, below.
Trading Plan: Risk management
I have provided a detailed article on risk management here:
In short, you want to control the value of your money at risk on each trade by restricting the value to a predetermined level and by keeping this value consistent for each trade placed. In the examples provided in my risk management article, I talk about limiting risk to £100 per day as an example. It is crucial that this element of your trading is ‘under control’ as otherwise you will likely fail to become consistently profitable. By limiting your risk to 1% of your capital balance, your emotions will remain calm and your reward to risk ratio can be analysed and understood more easily. Also, keeping the amount at risk consistent between trades placed, will be an essential part of your trading strategy / it is necessary to do this for your strategy to work. (More below). Please consider the article I published on risk management, very carefully and incorporate this into your Trading Plan.
Trading Strategy
A trading strategy is the plan of how you will find and execute trades. It’s the type of trade opportunity you will look for when considering the markets. Traders can either be technical traders or fundamendal traders. Technical traders place trades by considering the price action taking place on the charts. Fundamental traders consider the market’s detailed financials by looking at financial statements, PE ratios, return on investment ratios etc. Although my professional career started as a chartered accountant, and I have the ability to understand the fundamentals of a company when considering its financial statements etc, I do not trade using fundamental data. I only trade based on what is happening on the charts and price action. Either approach can work. However, this blog is tailored towards helping you understand technical analysis (analysing the charts) and this type of trading style in particular.
Within the technical analysis you may look for particular set ups/patterns to appear on the chart. When you see the pattern you are looking for, you would then execute a trade, while controling/limiting your risk to £100 (or whatever value you choose) in the event the trade goes against you, per the risk management plan. You would typically look to make a bit more than your ‘at risk’ value whenever you make a profit.
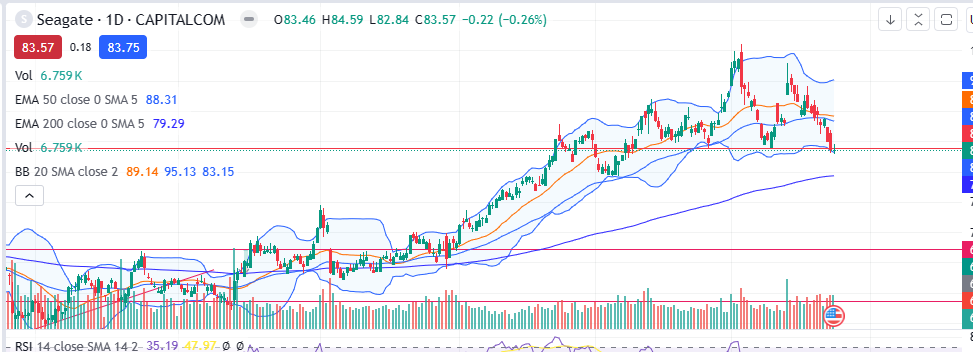
There are many different types of trading strategies based on technical analysis which work. You may have found one already and you have come here to understand how the strategy fits into an overall trading plan. Or perhaps you are completely new to trading and you need to start at the beginning. Many traders use different types of indicators to signal to them where to enter a market or exit. This will be a key part of their trading strategy. For example, some traders like to use Bollinger bands. I have provided a screen shot below of what these look like:
I do not use this strategy (not for any other reason other than I haven’t learnt to use it yet and traders typically find a niche and stick to what they know). Some traders would use this indicator to enter the market at a particular place within the blue bands and aim to exit at the top of the bands to get a profit and they might set their stop loss or exit the trade in a loss scenario, near the bottom of the bands. This is just one type of example of how the indicators can be used to plan entry and exit points.
In my own trading style, I use a ‘buy the dip’ strategy. I achieve a 60% win rate with this strategy and I get roughly a 1.5:1 reward risk ratio (more below). If you would like to see how my strategy works, please visit my Patreon page here:
You can learn about different strategies from traders on You Tube and see what suits you best. I would advise you to ensure you can trust the person teaching you. There are many people on the internet which lead new inexperienced traders into losing money! I used to be one of these. I provide assurance over what I write in my blog articles by publishing my win rate, as confirmed in reports from my broker. I also publish my weekly profits and losses. Please see this section of my blog:
Once you have found a strategy that you believe works and you can trust, you want to make sure that it has a good risk to reward ratio, and that the risk to reward ratio works with the overall win rate – more below. You should have an idea of the win rate of the strategy you want to follow from the person who taught you the strategy. As I said above, in my buy the dip strategy , the win rate is roughly 60%.
Risk to Reward Ratio
What is risk to reward ratio? This ratio is the ratio of profit to loss when you are controlling your trades in accordance with what is discussed on the risk management page of this blog. The risk to reward ratio can vary between trading strategies. For example, a ‘break out’ strategy can achieve high reward to risk ratios. (I’m not a break out trader so I could not advise you of the win rate of these types of strategies). In the trading strategy I teach on Patreon, the reward to risk ratio is roughly 1.5:1, respectively. This means, for every trade I place, I look to make, lets say, either £100 as a loss or £150 as a profit.
It is the combination of risk to reward ratio as well as your win rate, which will determine whether or not the overall strategy works and is profitable. Here is an example based on the strategy I follow personally:
Every 10 trades placed will, on average, have the following outcome:
6 will be profitable – with a value of £900 (60% x 10 trades x £150 profit = £900)
4 will be losses – with a value of £400 (40% x 10 trades x £100 loss = £400)
Therefore over the course of 10 trades, I would expect to make circa £500 with this strategy.
As explained in the risk management article, the level of risk will be set by your account balance size… (typically 1% of your entire balance) but it is the ratio of profit to loss and the win rate which are important and these can be applied to any account size.
Lets consider an example with a great reward risk ratio but a poor win rate:
Win rate: 20%
Reward/risk ratio: 4:1
Every 10 trades placed will, on average, have the following outcome:
2 will be profitable – with a value of £800 (20% x 10 trades x ££400 profit = £800)
8 will be losses – with a value of £800 (80% x 10 trades x £100 loss = £800)
Therefore over the course of 10 trades, I would expect to make nothing with this strategy.
I hope you can see how the combination of win rate with reward to risk ratio works and there is an imperative connection/dependency between these two factors and that they, when combined in the right way, will allow you to make profit.
So, once you have got a plan in place for risk management, and a trading strategy which combines win rate with risk to reward ratio to make profit, you will have your overall Trading Plan.
I hope you found this useful. If you have any questions please send me a message via the blog contact page. I do try to answer all queries if I can.
Please note any subscriptions taken via my affiliate link with Trading View may result in me earning a small commission. However, I provide complete transparency on me using Trading View personally – I publish my success on the financial markets via my broker reports and any profits earned were done so by using my own Trading View subscription, so I genuinely do recommend them and have been using the Trading View charts for many years.
Cookie Consent
We use cookies to improve your experience on our site. By using our site, you consent to cookies.
Used by Google Analytics to determine which links on a page are being clicked
30 seconds
_ga_
ID used to identify users
2 years
_gid
ID used to identify users for 24 hours after last activity
24 hours
_gat
Used to monitor number of Google Analytics server requests when using Google Tag Manager
1 minute
__utmt
Used to monitor number of Google Analytics server requests
10 minutes
__utmb
Used to distinguish new sessions and visits. This cookie is set when the GA.js javascript library is loaded and there is no existing __utmb cookie. The cookie is updated every time data is sent to the Google Analytics server.
30 minutes after last activity
__utmc
Used only with old Urchin versions of Google Analytics and not with GA.js. Was used to distinguish between new sessions and visits at the end of a session.
End of session (browser)
__utmz
Contains information about the traffic source or campaign that directed user to the website. The cookie is set when the GA.js javascript is loaded and updated when data is sent to the Google Anaytics server
6 months after last activity
__utmv
Contains custom information set by the web developer via the _setCustomVar method in Google Analytics. This cookie is updated every time new data is sent to the Google Analytics server.
2 years after last activity
__utmx
Used to determine whether a user is included in an A / B or Multivariate test.
18 months
_gac_
Contains information related to marketing campaigns of the user. These are shared with Google AdWords / Google Ads when the Google Ads and Google Analytics accounts are linked together.
90 days
__utma
ID used to identify users and sessions
2 years after last activity
Marketing cookies are used to follow visitors to websites. The intention is to show ads that are relevant and engaging to the individual user.
A video-sharing platform for users to upload, view, and share videos across various genres and topics.
This cookie is used to play YouTube videos embedded on the website.
2 years
VISITOR_PRIVACY_METADATA
Youtube visitor privacy metadata cookie
180 days
GPS
Registers a unique ID on mobile devices to enable tracking based on geographical GPS location.
1 day
VISITOR_INFO1_LIVE
Tries to estimate the users' bandwidth on pages with integrated YouTube videos. Also used for marketing
179 days
PREF
This cookie stores your preferences and other information, in particular preferred language, how many search results you wish to be shown on your page, and whether or not you wish to have Google’s SafeSearch filter turned on.
10 years from set/ update
YSC
Registers a unique ID to keep statistics of what videos from YouTube the user has seen.
Session
DEVICE_INFO
Used to detect if the visitor has accepted the marketing category in the cookie banner. This cookie is necessary for GDPR-compliance of the website.