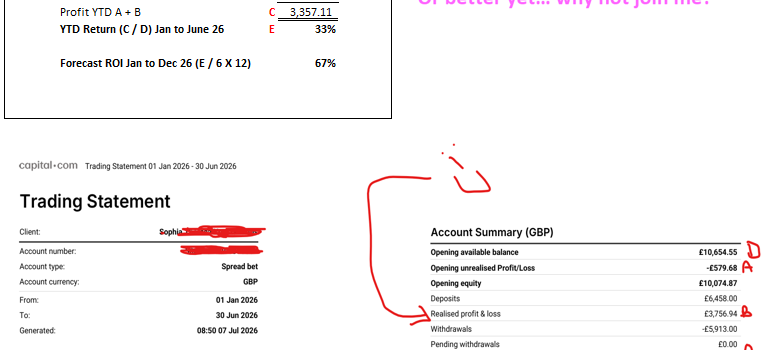
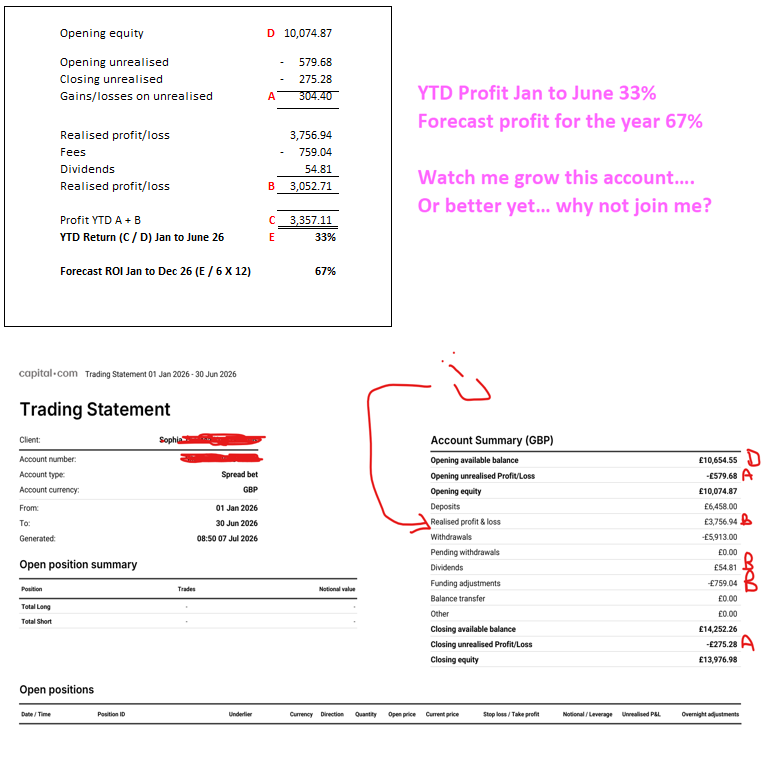
In the interests of being completely transparent with my success and win rates on the financial markets, I am publishing the answer to the question, how much money have I made trading, June YTD via my performance stats here with Capital.com. I trade in a few different broker accounts but I use this one to provide education on trading. I hope this gives you some confidence that I am a genuinely successful trader and there is money to be made on the financial markets. I trade with Capital.com. I do not have any affiliation with them. They send me weekly updates of my performance via email. I am sharing a screen shot for you.
For more great tips and advice on trading the stock market, please visit:
Please note any subscriptions taken via my affiliate link with Trading View may result in me earning a small commission. However, I provide complete transparency on me using Trading View personally – I publish my success on the financial markets via my broker reports and any profits earned were done so by using my own Trading View subscription, so I genuinely do recommend them and have been using the Trading View charts for many years.
In the interests of being completely transparent with my stock market profit on the financial markets, I am publishing a screen shot here, of my recent success. I hope this gives you some confidence that I am a genuinely successful trader and there is money to be made on the financial markets. I trade with Capital.com. I do not have any affiliation with them.
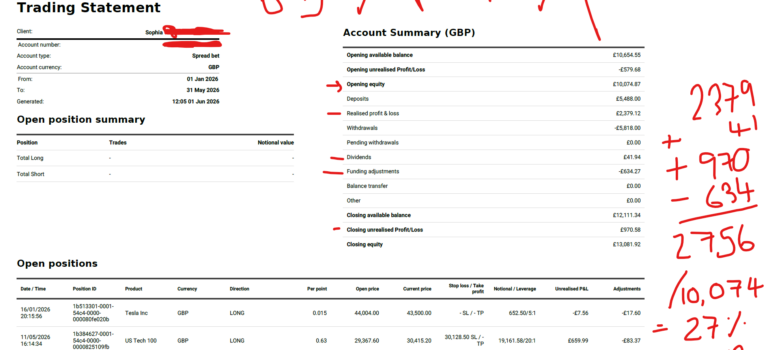
Over the month of May 2026 I have been trading the NASDAQ. This resulted in a profit of over £2.2k. When you gross this up for a year i’m on track for a return of 200% for the year. Note the markets were dipping at the start of the year so I did have a period of waiting to trade for a couple of months and this would reduce the annualised rate. I do not short the markets. You can see my YTD profit statement on a separate blog post. To understand and learn exactly how i’m doing this, you can join me on my Patreon account, linked below.
I hope you found this article on my recent stock market profit, helpful!
Nothing on this blog should be taken as financial advice or encouragement for you to enter a trade. You are expected to speak to a financial adviser or carry out your own due diligence before entering any positions. Everything on this blog is made for educational purposes and to equip you with the knowledge you need to be able to make your own financial decisions. I am not regulated by the Financial Conduct Authority.
For more great tips and advice on trading the stock market, please visit:
Please note any subscriptions taken via my affiliate link with Trading View may result in me earning a small commission. However, I provide complete transparency on me using Trading View personally – I publish my success on the financial markets via my broker reports and any profits earned were done so by using my own Trading View subscription, so I genuinely do recommend them and have been using the Trading View charts for many years.
In the interests of being completely transparent with my stock market profit on the financial markets, I am publishing a screen shot here, of my recent success. I hope this gives you some confidence that I am a genuinely successful trader and there is money to be made on the financial markets. I trade with Capital.com. I do not have any affiliation with them.
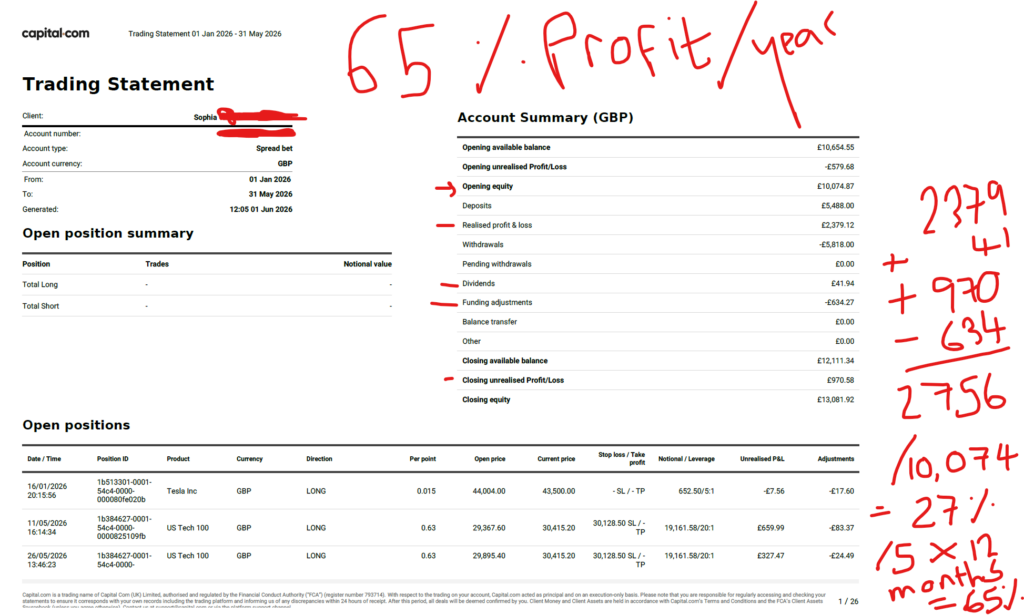
Over the last few months I have been trading the NASDAQ. This resulted in a profit of over £2.7k. When you gross this up for a year i’m on track for a return of 65% for the year. To understand and learn exactly how i’m doing this, you can join me on my Patreon account, linked below.
I hope you found this article on my recent stock market profit, helpful!
Nothing on this blog should be taken as financial advice or encouragement for you to enter a trade. You are expected to speak to a financial adviser or carry out your own due diligence before entering any positions. Everything on this blog is made for educational purposes and to equip you with the knowledge you need to be able to make your own financial decisions. I am not regulated by the Financial Conduct Authority.
For more great tips and advice on trading the stock market, please visit:
Please note any subscriptions taken via my affiliate link with Trading View may result in me earning a small commission. However, I provide complete transparency on me using Trading View personally – I publish my success on the financial markets via my broker reports and any profits earned were done so by using my own Trading View subscription, so I genuinely do recommend them and have been using the Trading View charts for many years.
In the interests of being completely transparent with my stock market profit on the financial markets, I am publishing a screen shot here, of my recent success. I hope this gives you some confidence that I am a genuinely successful trader and there is money to be made on the financial markets. I trade with Capital.com. I do not have any affiliation with them.
Over the last couple of weeks I gradually added more to my position size on the NASDAQ and this resulted in a profit of over £1,200. You can see my total profit for the month in a separate blog post. My first entry was made on 11th May 2026. The balance on this account at the start of the year was circa 11k.
I hope you found this article on my recent stock market profit, helpful!
Nothing on this blog should be taken as financial advice or encouragement for you to enter a trade. You are expected to speak to a financial adviser or carry out your own due diligence before entering any positions. Everything on this blog is made for educational purposes and to equip you with the knowledge you need to be able to make your own financial decisions. I am not regulated by the Financial Conduct Authority.
For more great tips and advice on trading the stock market, please visit:
Please note any subscriptions taken via my affiliate link with Trading View may result in me earning a small commission. However, I provide complete transparency on me using Trading View personally – I publish my success on the financial markets via my broker reports and any profits earned were done so by using my own Trading View subscription, so I genuinely do recommend them and have been using the Trading View charts for many years.
In this article i’m going to talk about stocks today – what’s happening on the S&P 500 and the NASDAQ. I just made over £1,000 trading the NASDAQ over the course of the last couple of days. Let’s take a look at how I did it and what the markets are doing now…
OK, so in terms of stocks today, let’s consider the trade I just hopped out of!
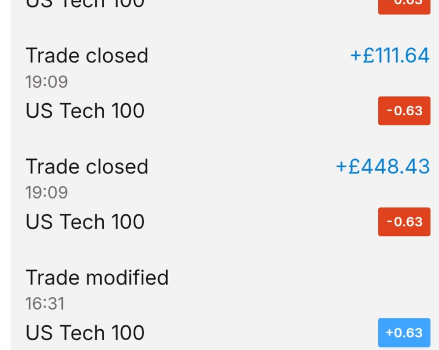
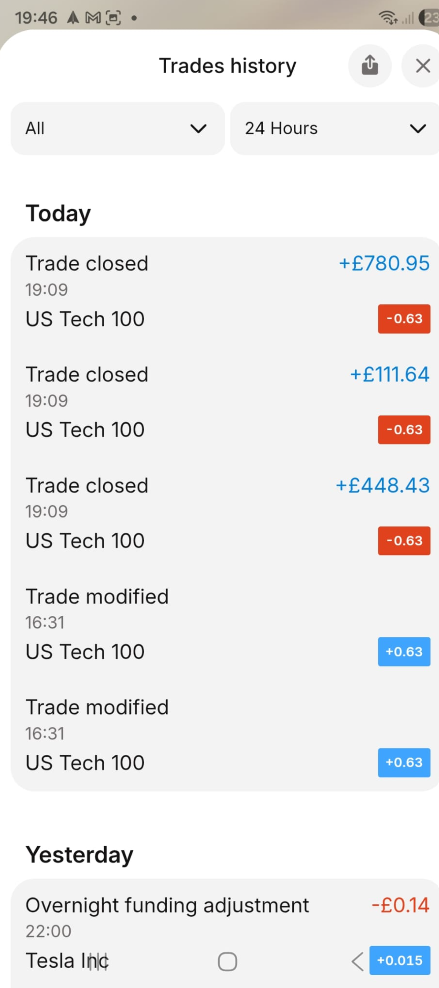
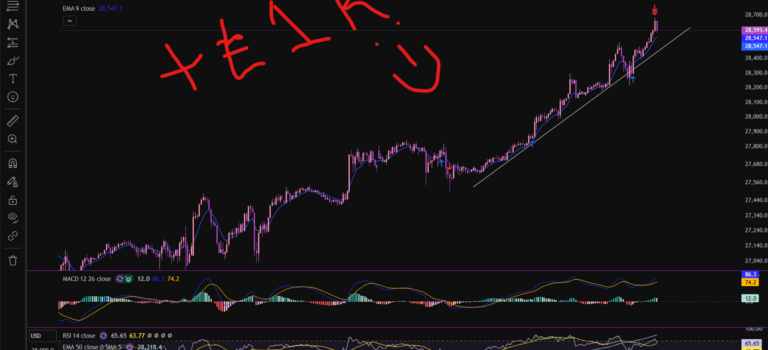
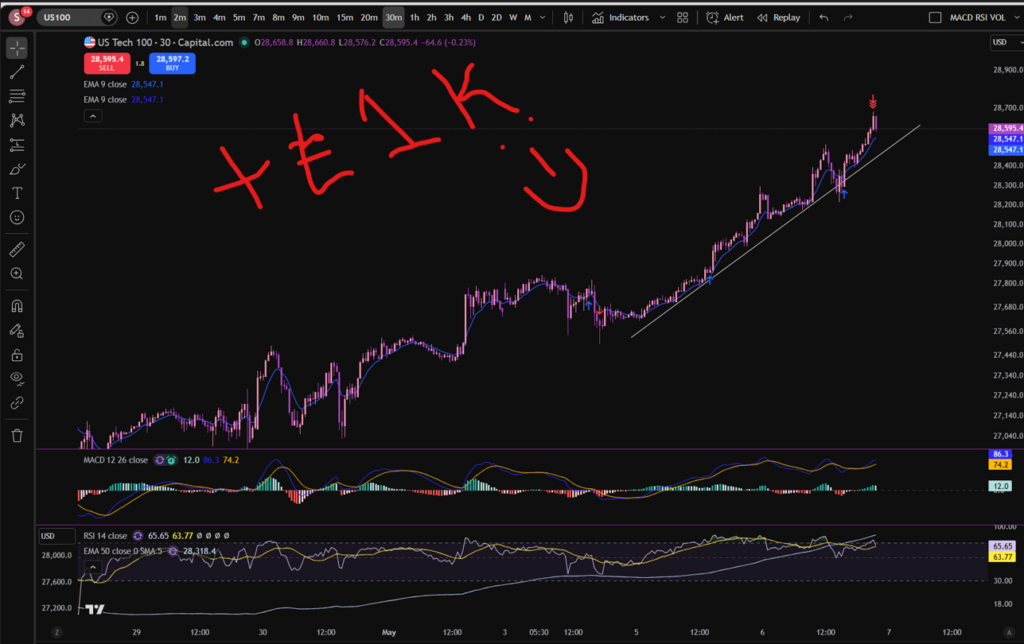
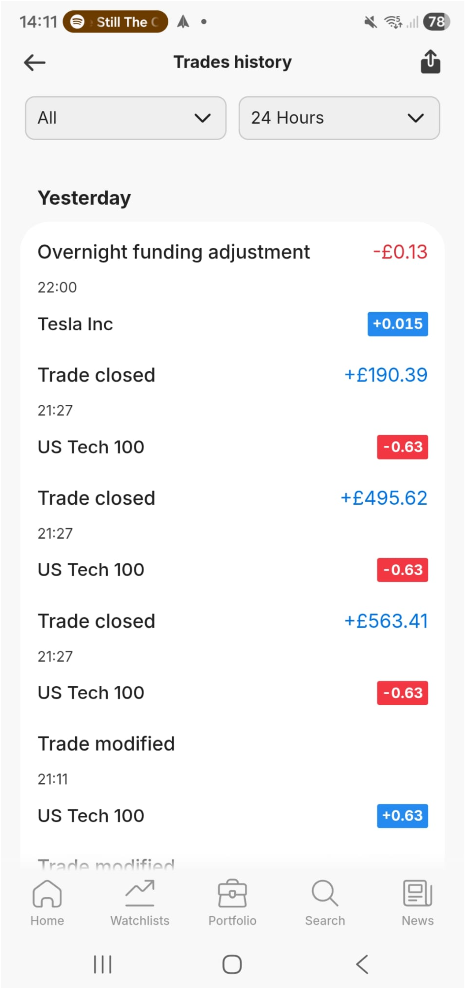
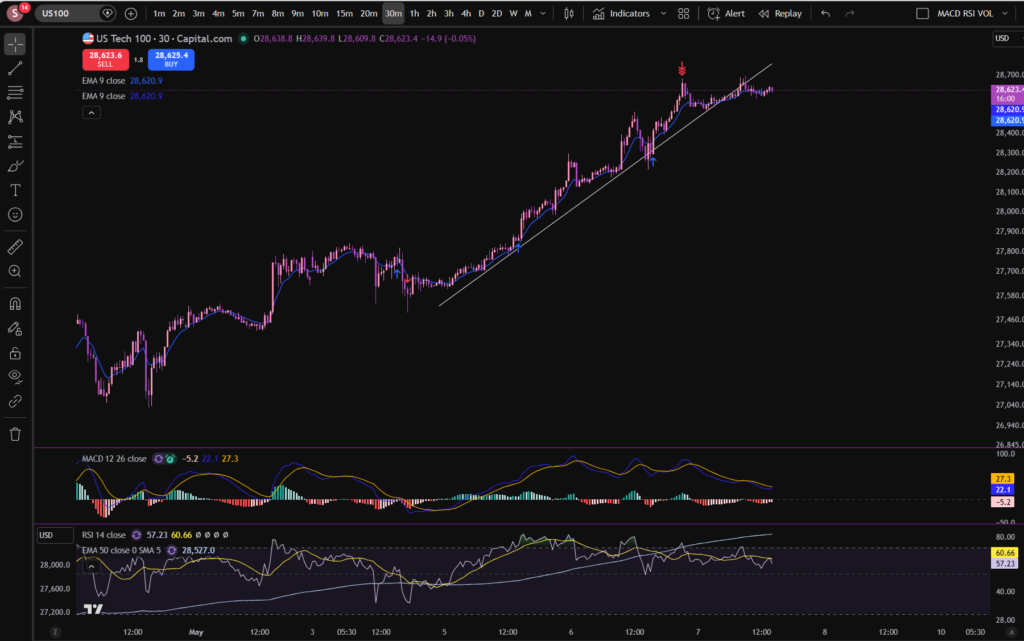
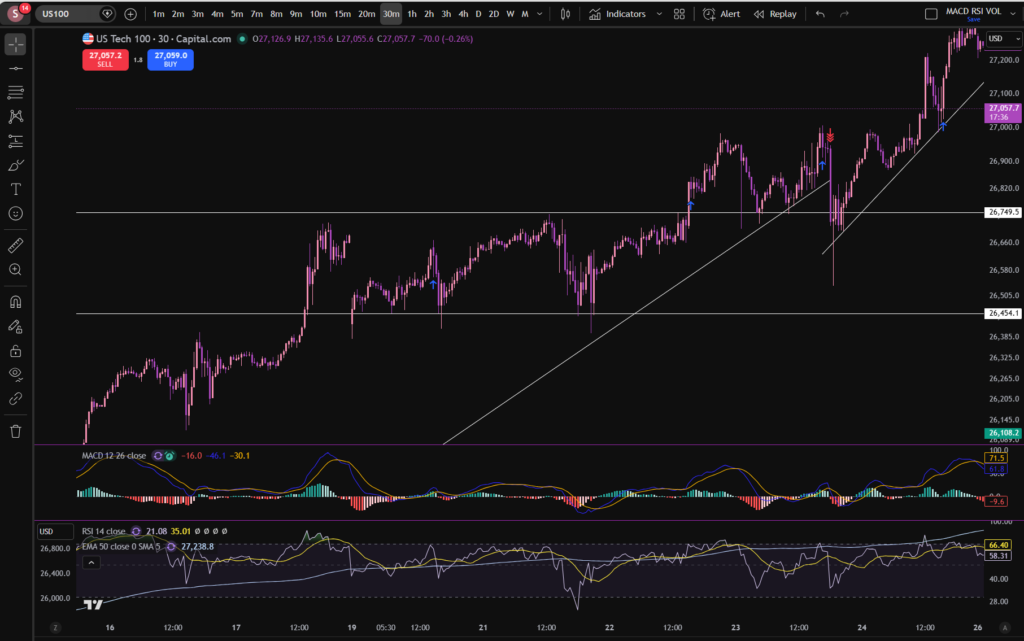
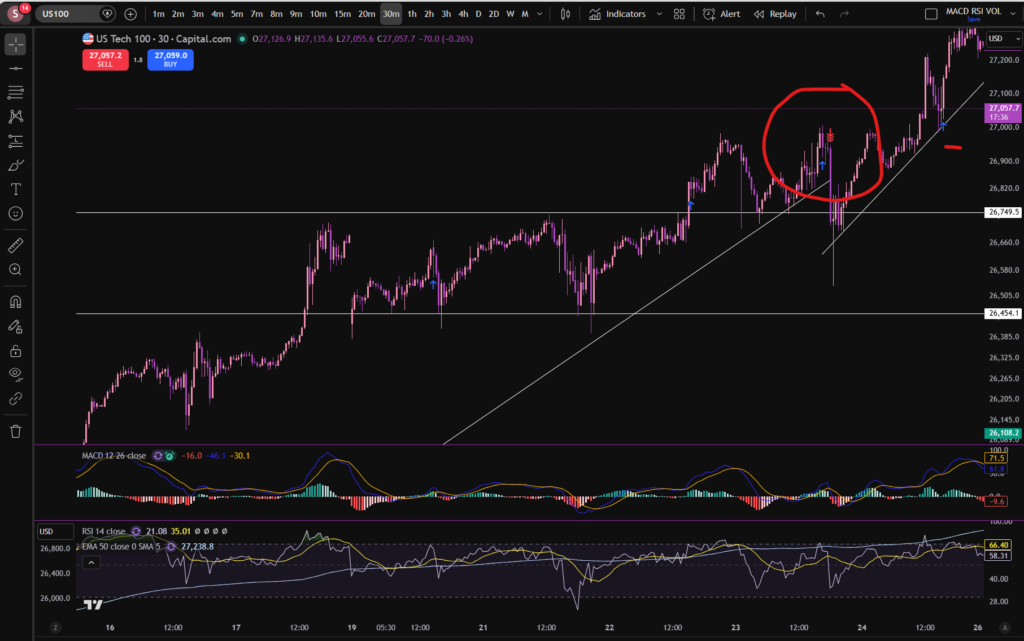
In this trade I entered into several positions as the price increased. You can see where I entered the market. In the end I had averaged up a total of three times before taking all profit off the table. I ended up with over £1,000 from these positions. You can see when I got into the first position on the chart with the blue arrows. This was around the 3rd or 4th of May. I exited them yesterday – see the collection of red arrows at the top of the upwards push. How did I know that the market may start pulling back there? It had sailed away from the diagonal support level I had placed on the chart, and the MACD was starting to lose it’s pigmentation on the histogram. The RSI was quite over extended and I was expecting it to pull back, at least to the diagonal support, but my thoughts were, it could pull back even further as it may have exhausted itself and I had a good chunk of profit sitting on the table which I didn’t want to give back 🙂
Here are my closed positions per my Capital.com app:
So what is next for the NASDAQ?
In terms of stocks today and the NASDAQ in particular, I can see the market has started chopping sideways through the diagonal support I drew on the chart, which is not a great sign! It’s possible it could still come up further, but right now, i’m waiting.
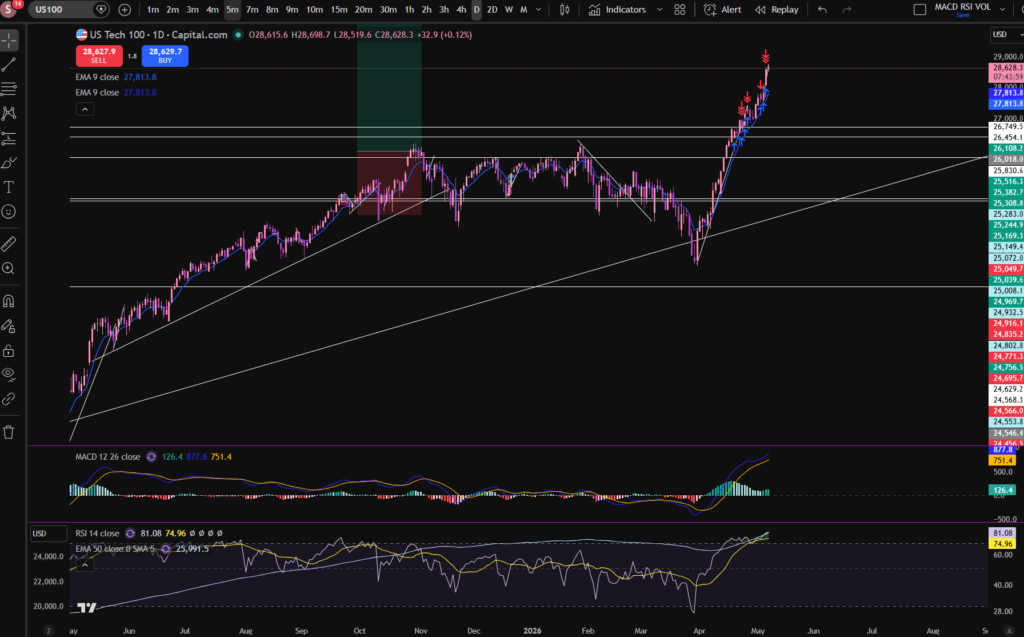
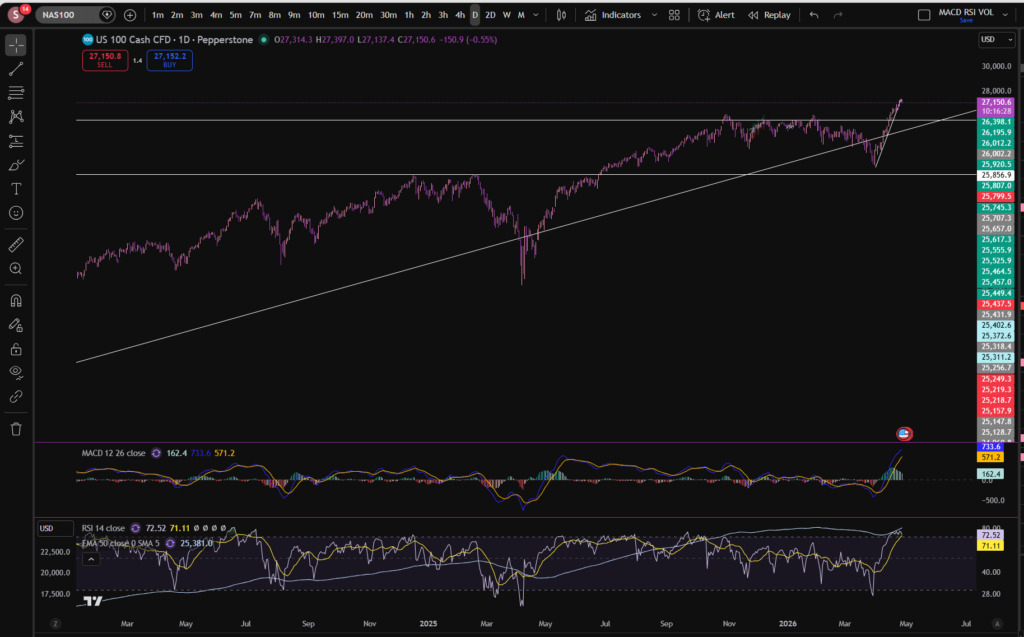
When you become an experienced trader, you sometimes get a ‘smell’ for when the market is peaking… it’s a combination of observations which give you a feeling that you need to jump out of the trades. The indicators, yes, but also your past experience of what they all collectively look like when the market is about to lose some momentum. Let’s take a look at the birds eye view to see if we can see what’s going on, from a higher level:
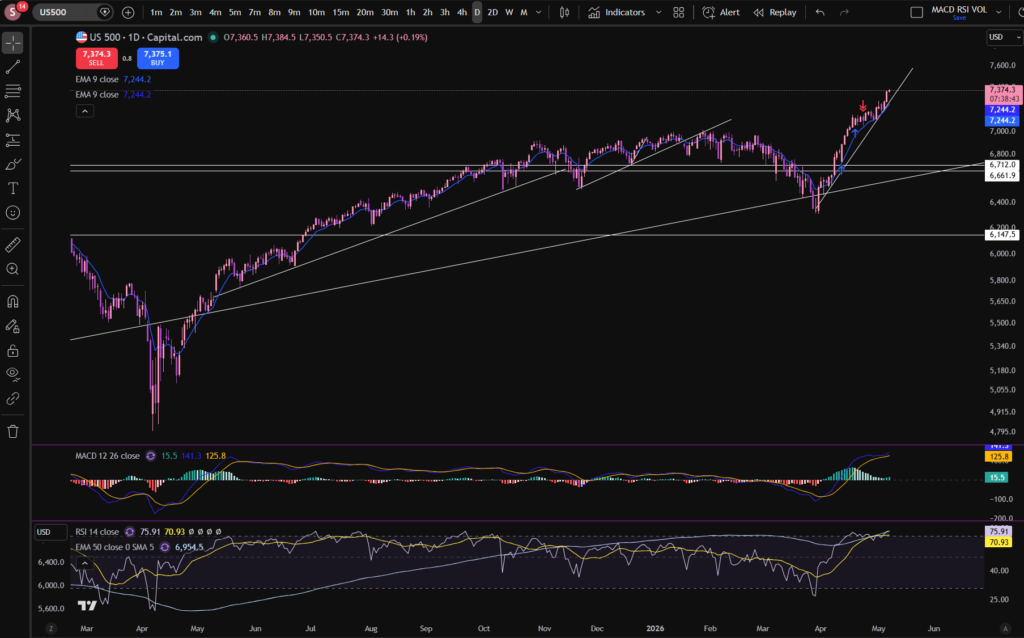
So, as you can see from the daily timeframe, the market has pushed off strongly from a strong long term diagonal support. The RSI is VERY high on this timeframe. Its a possibility that the market may be due a bit of a pull back – take a look at the shape of the previous upwards swing from this trend line. It tends to push up and then bump over in a ‘cloud’ shape rather than sky rocketing to the moon without any let up! So I have this in mind, while i’m waiting and also the fact that it’s chopping through the diagonal trend, now, on the 30 minute timeframe so it’s broken that support as of now.
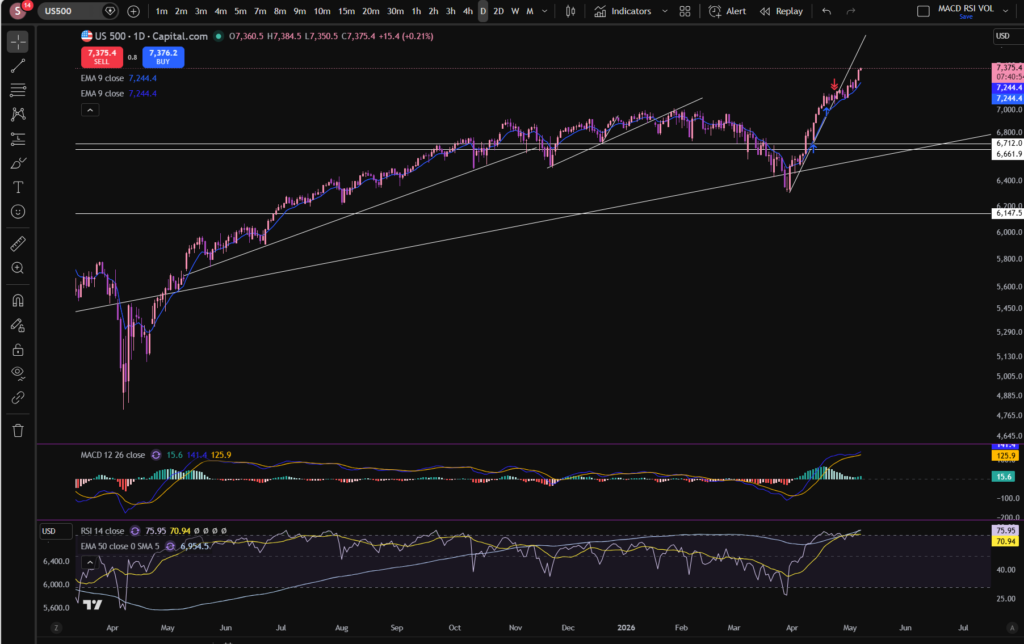
Let’s take a look at the S&P 500 for good measure – we can’t really consider stocks today without looking at this. This is heavily influenced by the NASDAQ so likely it will follow a similar story:
As you can see, a similar story has occurred on the S&P 500… This one looks like it broke through a previous diagonal support. It could be that this support can now be adjusted for a better fit – see below. (Don’t be afraid to readjust your trend lines as the markets play out):
There – that’s better!
This one actually looks more strong than the NASDAQ to me, but obviously you need to decide for yourself before entering any market. Why do I say it looks stronger? The histogram has turned dark green again on the MACD indicator, and it’s just bounced on the readjusted trend line!
I hope you found this article on stocks today helpful!
Disclaimer!
Nothing on this blog should be taken as financial advice or encouragement for you to enter a trade. You are expected to speak to a financial adviser or carry out your own due diligence before entering any positions. Everything on this blog is made for educational purposes and to equip you with the knowledge you need to be able to make your own financial decisions.
For more great tips and advice on trading the stock market, please visit:
Please note any subscriptions taken via my affiliate link with Trading View may result in me earning a small commission. However, I provide complete transparency on me using Trading View personally – I publish my success on the financial markets via my broker reports and any profits earned were done so by using my own Trading View subscription, so I genuinely do recommend them and have been using the Trading View charts for many years.
I made over £900 on the stock market over the last few days, and I wanted to share with you my entry and exit points so that you can learn from me, how to trade stocks. I’ve been using my usual MACD strategy, which you can find on my Patreon page, but I am also ‘averaging up’ my trades and this is leading me to make significantly more profits in the markets than I had been, previously… Let’s take a look at how I did it…
As you can see, the NASDAQ has been in a long term steady uptrend but it had been pulling back per the daily timeframe, since around November! Once I saw that the price bounced near the long term upwards diagonal trendline on the daily timeframe, I found an entry on the 30 minute timeframe. I noted that the price started bouncing on another lower level diagonal trend line per the 30 minute chart, and got into the market near a horizontal support level. It’s best if you can get into the market where it is supported both diagonally and horizontally, but just one type of support can be ok too:
I tend to get into the market when the MACD is crossing again, to the upside, at a good support level. I do this now, repeatedly adding more and more to my position as the price increases. At each scoop down, I add another portion. I do this in a very controlled way, keeping an eye on my margin and the potential losses. Averaging up in this way is an important consideration and tool you can use when learning how to trade stocks.
In the above chart screen shot, you can see the first entry I made which ended up in over £500 of profit, and then the second one which took over £200 and the third (over £80). In total I increased my position size, about four times. I don’t have screen shots from the whole time the trade was open to show you, i’m afraid, but I hope you can see the step ups in the market I have made, here.
After the market was starting to cut through the support level on the chart, I took profit from the market, on all my open positions. You can see where I closed them with the little red arrows, here:
I also made another £300 or so this week since I closed these ones, and you can see my subsequent entry, but I’m aware that there will be an FOMC meeting soon and I don’t want to leave open positions on the table while this meeting is starting. I published another blog article yesterday about these meetings and how they can affect your trading, here:
If you are interested in learning to trade stocks and you don’t know where to start, or you are already applying a strategy and you feel you are struggling to get it to work, I can offer you some assistance. I offer one to one, educational consultations, during which I aim to provide some feedback and helpful guidance on how you could improve your strategy and make it successful. Please see the contact section of the blog and reach out if you think this would be of assistance to you.
I hope you found this article on how to trade stocks, helpful!
Disclaimer!
Nothing on this blog should be taken as financial advice or encouragement for you to enter a trade. You are expected to speak to a financial adviser or carry out your own due diligence before entering any positions. Everything on this blog is made for educational purposes and to equip you with the knowledge you need to be able to make your own financial decisions.
For more great tips and advice on trading the stock market, please visit:
Please note any subscriptions taken via my affiliate link with Trading View may result in me earning a small commission. However, I provide complete transparency on me using Trading View personally – I publish my success on the financial markets via my broker reports and any profits earned were done so by using my own Trading View subscription, so I genuinely do recommend them and have been using the Trading View charts for many years.
I made £370 in profit trading Diamondback within the space of a couple of hours recently as a day trader. I talk about this below. I have placed these types of trades many, many times and had similar success.
How I made £370 in profit trading Diamondback
Patience is key in waiting for the right opportunity – I am always striving to prioritise quality over quantity with trading. I have talked about Diamondback becoming ready for a trade on my You Tube channel here:
http://www.youtube.com/@Trader-Pro-fe6xs
You can see in this video I called this market as one I was watching very closely before I placed my trade on it. My Patreon members benefit from having commentary under a microscope prior to me entering these types of trades. I explain to them where I will get in, what I’m waiting for, what I’m thinking while my trades are open, and where I am planning to close them. You can get all of this on my Patreon page by becoming a member of my channel – I would love for you to join me and share in my success:
Please note any subscriptions taken via my affiliate link with Trading View may result in me earning a small commission. However, I provide complete transparency on me using Trading View personally – I publish my success on the financial markets via my broker reports and any profits earned were done so by using my own Trading View subscription, so I genuinely do recommend them and have been using the Trading View charts for many years.
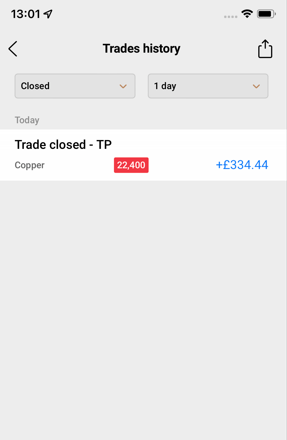
I made £330 in profit trading Copper within the space of a couple of hours last week as a day trader. I talk about this below. I have placed these types of trades many, many times and had similar success.
How I made £330 in profit trading Copper
Patience is key in waiting for the right opportunity – I am always striving to prioritise quality over quantity with trading. I have talked about Copper becoming ready for a trade on my You Tube channel here:
You can see in this video I called this market as one I was watching very closely before I placed my trade on it. My Patreon members benefit from having commentary under a microscope prior to me entering these types of trades. I explain to them where I will get in, what I’m waiting for, what I’m thinking while my trades are open, and where I am planning to close them. You can get all of this on my Patreon page by becoming a member of my channel – I would love for you to join me and share in my success:
Please note any subscriptions taken via my affiliate link with Trading View may result in me earning a small commission. However, I provide complete transparency on me using Trading View personally – I publish my success on the financial markets via my broker reports and any profits earned were done so by using my own Trading View subscription, so I genuinely do recommend them and have been using the Trading View charts for many years.
Cookie Consent
We use cookies to improve your experience on our site. By using our site, you consent to cookies.
Used by Google Analytics to determine which links on a page are being clicked
30 seconds
_ga_
ID used to identify users
2 years
_gid
ID used to identify users for 24 hours after last activity
24 hours
_gat
Used to monitor number of Google Analytics server requests when using Google Tag Manager
1 minute
__utmt
Used to monitor number of Google Analytics server requests
10 minutes
__utmb
Used to distinguish new sessions and visits. This cookie is set when the GA.js javascript library is loaded and there is no existing __utmb cookie. The cookie is updated every time data is sent to the Google Analytics server.
30 minutes after last activity
__utmc
Used only with old Urchin versions of Google Analytics and not with GA.js. Was used to distinguish between new sessions and visits at the end of a session.
End of session (browser)
__utmz
Contains information about the traffic source or campaign that directed user to the website. The cookie is set when the GA.js javascript is loaded and updated when data is sent to the Google Anaytics server
6 months after last activity
__utmv
Contains custom information set by the web developer via the _setCustomVar method in Google Analytics. This cookie is updated every time new data is sent to the Google Analytics server.
2 years after last activity
__utmx
Used to determine whether a user is included in an A / B or Multivariate test.
18 months
_gac_
Contains information related to marketing campaigns of the user. These are shared with Google AdWords / Google Ads when the Google Ads and Google Analytics accounts are linked together.
90 days
__utma
ID used to identify users and sessions
2 years after last activity
Marketing cookies are used to follow visitors to websites. The intention is to show ads that are relevant and engaging to the individual user.
A video-sharing platform for users to upload, view, and share videos across various genres and topics.
This cookie is used to play YouTube videos embedded on the website.
2 years
VISITOR_PRIVACY_METADATA
Youtube visitor privacy metadata cookie
180 days
GPS
Registers a unique ID on mobile devices to enable tracking based on geographical GPS location.
1 day
VISITOR_INFO1_LIVE
Tries to estimate the users' bandwidth on pages with integrated YouTube videos. Also used for marketing
179 days
PREF
This cookie stores your preferences and other information, in particular preferred language, how many search results you wish to be shown on your page, and whether or not you wish to have Google’s SafeSearch filter turned on.
10 years from set/ update
YSC
Registers a unique ID to keep statistics of what videos from YouTube the user has seen.
Session
DEVICE_INFO
Used to detect if the visitor has accepted the marketing category in the cookie banner. This cookie is necessary for GDPR-compliance of the website.